Recap of US Markets
STOCKS
Stock prices peaked on Monday for the Nasdaq and on Tuesday for the Dow Jones industrials and subsequently headed lower over the course of the week. Economic news was sparse and trading volumes were thin during this holiday-shortened week. On Thursday, April 8, the DJIA included three new companies (AIG, Pfizer, and Verizon); three old companies (AT&T, Eastman Kodak, and International Paper) were removed from the index.

BONDS
Of course yields shot up last Friday after the economically bullish labor market report. But this week economic news was in short supply, though the few indicators that were on the docket were generally favorable. Consequently, bond yields edged up further during the week. Next week's calendar is chock full of key economic indicators such as retail sales, industrial production and housing starts.

Markets at a Glance

Weekly percent change column reflects percent changes for all components except interest rates. Interest rate changes are reflected in simple differences.
The Economy
Labor market indicators confirm improving trend
New jobless claims fell in March, posting a weekly average of 340,000; this is a sharp improvement from the January and February pace of 356,000 per week. The friendly trend continued in the first week of the new month as claims decreased 14,000 to 328,000 in the week ended April 3.

Continuing claims slid 40,000 in the week ended March 27 to 3.01 million. This brought the monthly average to 3.04 million, that is the number of jobless receiving continuing benefits. Some pessimists might argue that the drop in continuing claims is due to the fact that many unemployed workers, with their benefits having expired, are no longer eligible for benefits. It is true that some workers lost benefits, but the combination of a reduction in new claims coupled with a spurt in March nonfarm payrolls suggests to us that at least some of the people no longer receiving benefits are now employed.

Challenger, Gray & Christmas reported that 68,034 job cuts were announced in March. This is an 11.9 percent reduction from the February pace and a 20.3 percent reduction from the same month a year ago. Layoff announcements are a good indicator of broad trends, but this indicator must be taken with a degree of salt since it is not known which portion of the layoffs are short term and how many jobs will simply be lost to attrition over the coming year. Nevertheless, the chart below does reveal that job cut announcements have diminished in the past 12 months.

On the whole, these labor market indicators are consistent with the March employment report which shows an improving trend in the labor market. Undoubtedly, the level of unemployment is still high and the level of new and continuing jobless claims, despite recent improvement, remains high. But at least the movement is currently in the right direction.
Inflation update
If the Bureau of Labor Statistics were on schedule, the PPI would have been released on Thursday, April 8. However, the agency is still trying to catch up after a conversation to NAICS (pronounced 'nakes').
Import and export prices were released on schedule. Import prices jumped 0.9 percent in March after moderating in February with a 0.4 percent gain. Petroleum prices surged 6.1 percent for the month, but still were only 1.9 percent higher than a year ago. Non-oil prices inched up 0.2 percent and are 1 percent higher than March 2003.
Export prices increased 0.9 percent in March as agricultural export prices jumped 3.3 percent, twice as fast as the previous month. Non-ag export prices increased 0.6 percent for the second straight month. Agricultural export prices are up a whopping 20.7 percent from a year ago, although non-ag export prices are 1.9 percent higher.

The BLS reports import prices by country of origin. Interestingly, prices of goods imported from Japan and NICs (newly industrializing countries) were unchanged in March. However, prices of goods from Latin America rose 1.6 percent; prices of Canadian goods rose 1.3 percent and goods prices from the EU rose 0.6 percent.
The best inflation news is behind us. Deflation and disinflation are terms of the past. However, inflationary pressures are not likely to start percolating any time very soon and the Fed still has time to start raising rates. Inflation is sufficiently low that the Fed can wait to see continued improvement in the labor market before raising rates.
House hunters
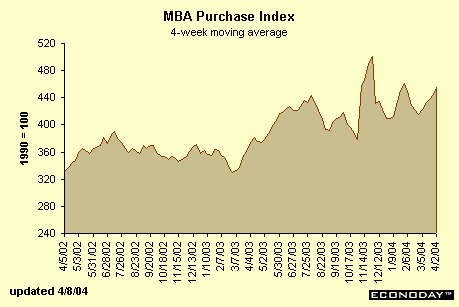
The Mortgage Bankers' Association's purchase index jumped more than 30 points in the week ended April 2 to reach the highest level since the week of January 16. The chart below depicts the 4-week moving average of this purchase index to more accurately focus on long term trends. Housing activity peaked at the end of 2003, moderated for a while but now seems to be growing again. Overall, the level of the purchase index is higher in the past four months than it was in the previous four months. Housing starts may have dipped in January and February, but housing activity continues strong.

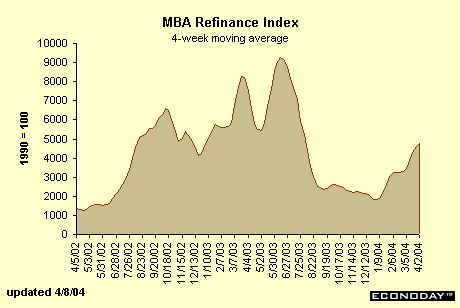
Refinance activity is also on the rise, although it dropped sharply in the week ended April 2. The 4-week moving average reveals a healthy upward trend that began around the middle of January. While one would think that anyone who needed to refinance was able to do so last summer, there are always procrastinators that missed the golden opportunity. Although mortgage rates were up in the latest week (5.79 vs. 5.52 percent) since the employment report, interest rates are still low and the refinancing opportunity remains favorable for homeowners.

Most of the time, refinancing is good for homeowners since they are able to reduce their monthly payment and have more discretionary income at their disposal. However, many homeowners tap into the equity of their homes. While the lower interest rates since allow a smaller interest burden, homeowners may not be getting lower monthly payments if they borrow more on their homes to finance cars and vacations or pay off credit card debt.
The Bottom Line
From an economic perspective, it was a slow news week. Indicators were generally showing that the economy was continuing to grow at a healthy rate and that inflation was not a problem. The labor market seems to be on the mend, but some investors may continue to reserve judgment until they see more than one good nonfarm payroll report.
The upcoming week will see many important indicators - including retail sales, the CPI, housing starts, industrial production and the international trade balance. Equity and bond investors will surely be on their toes!
Looking Ahead: Week of April 12 to April 16
Tuesday
Retail sales rose 0.7 percent in February after a 0.3 percent hike in January. February sales were boosted by a rise in motor vehicle sales. This is not likely to be the case in March as motor vehicle sales were roughly unchanged during the month with a drop in light truck sales offset by a slight rise in auto sales. Excluding autos, sales were unchanged in February after a 1.2 percent hike in January.
Retail sales Consensus Forecast for Mar 04: 0.7 percent
Range: 0.5 to 1 percent
Retail sales ex autos Consensus Forecast for Mar 04: 0.6 percent
Range: 0.3 to 0.9 percent
Business inventories inched up 0.1 percent in January after a 0.3 percent hike in December. February inventories are likely to be higher: manufacturers' inventories rose 0.5 percent while wholesale trade inventories jumped 1.2 percent during the month. Retail trade inventories are the missing link.
Business inventories Consensus Forecast for Feb 04: 0.5 percent
Range: 0.2 to 0.7 percent
The Treasury budget has posted an average deficit of $39.7 billion over the past 10 years during March. In 2003, the March deficit amounted to $58.9 billion. Economists are looking for higher federal budget deficits as far as the eye can see. Expect a larger budget deficit this year.
Treasury budget Consensus Forecast for Mar 04: $-70 billion
Range: $-65 to $-74 billion
Wednesday
The consumer price index rose 0.3 percent in February after a higher 0.5 percent gain in January. It appears that energy prices are accelerating again. Excluding the volatile food & energy components, the CPI rose 0.2 percent in each of the two months. Petroleum import prices surged in March, and this could be reflected in the March CPI.
CPI Consensus Forecast for Mar 04: 0.4 percent
Range: 0.2 to 0.5 percent
CPI ex food & energy Consensus Forecast for Mar 04: 0.2 percent
Range: 0.1 to 0.3 percent
The international trade deficit on goods and services widened in January to $43.1 billion after increasing to $42.7 billion in December. In January, both exports and imports fell, but the drop in January imports was not large enough to offset the December rise. Despite the weaker dollar, U.S. exports are not growing as fast as imports.
International trade deficit Forecast for Mar 04: $-43 billion
Range: $-41.5 to $-44.6 billion
Thursday
New jobless claims fell 14,000 in the week ended April 3 to 328,000. Claims were stagnant for a while, but the downward trend has resumed. This bodes well for April nonfarm payrolls.
Jobless Claims Consensus Forecast for 4/10/04: 335,000 (7,000)
Range: 325,000 to 350,000
The Empire State manufacturing index fell back to 25.3 in March after surging to 42.1 in February. While the drop suggested a setback, there is no question that any level above 20 reflects continued expansion in the manufacturing sector in the New York Fed district.
Empire State manufacturing Consensus Forecast for Apr 04: 28.5
Range: 19.5 to 33.3
The Philadelphia Fed's business outlook survey also showed a drop in March, but not as large as the Empire State index drop. At 24.2, the index level remained strong and showed healthy manufacturing activity in this Fed district.
Philadelphia Fed business outlook survey Consensus Forecast for Apr 04: 26.1
Range: 18.5 to 30
Friday
Housing starts fell 4 percent in February to a 1.855 million unit rate after dropping 6.3 percent in January. At least part of the January drop was weather related. With a drop in mortgage rates during March and improved weather conditions, housing construction could show improvement.
Housing starts Consensus Forecast for Mar 04: 1.90 million unit rate
Range: 1.85 to 1.97 million unit rate
The index of industrial production rose 0.7 percent in February after gaining 0.8 in January. Factory payrolls were unchanged in March but the factory workweek dipped by 6 minutes. This suggests that March production will not be as robust as in the past two months.
Industrial production index Consensus Forecast for Mar 04: 0.3 percent
Range: -0.2 to +0.7 percent
Capacity utilization rate Consensus Forecast for Mar 04: 76.8 percent
Range: 76.4 to 77.1 percent
The University of Michigan's consumer sentiment index edged up to 95.8 in March from February's 94.4 level. Consumer attitudes are likely to improve in coming months in tandem with employment.
Consumer sentiment index Consensus Forecast for mid-Apr 04: 97
Range: 92 to 99


