It would have been a light week anyway with respect to economic indicators, but since President Bush declared Friday, June 11 a federal holiday in honor of former President Reagan a third of the week's numbers - including two market-moving indicators - were postponed. Stock exchanges will be closed and the Bond Market Association also recommended that the bond market close on Friday.
Whether it was because of the sparse news week or because market players are getting more and more jittery these days about the Fed, financial markets keyed in on Alan Greenspan's comments on Tuesday. He indicated that the Fed would raise rates at a "measured" pace, or perhaps not if inflation turned out to accelerate more rapidly than they predict. Pundits suggested that Greenspan's speech was purposely nuanced so that market players would indeed realize that the Fed stood ready to take care of inflation, should it become a problem, but would otherwise not raise rates too rapidly in coming months.
Whether the Fed will raise rates at a measured pace - or more rapidly - there is no question that the first rate hike of 25 basis points will be announced on June 30th at the end of a two-day FOMC meeting. Be forewarned, banks will be quick on the draw with a 25 basis point hike in the prime rate. My bet is that at least one bank if not all banks will announce a rate hike within minutes. (I'm betting one minute, but perhaps it will take as long as five minutes before the announcements hit the wires.)
Recap of US Markets
STOCKS
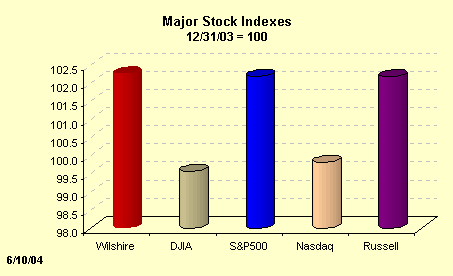
Stock prices posted healthy gains this week, although the majority of the rise in the week's major indexes was due to a burst of activity on Monday. Though gains on Tuesday and Thursday were solid, stock prices dipped on Wednesday. The chart below shows how the major indexes are performing year-to-date: the Dow and the Nasdaq are just under their year-end (2003) levels. The Wilshire 5000, the S&P 500 and the Russell 2000 are all 2 percent higher than year-end.
BONDS
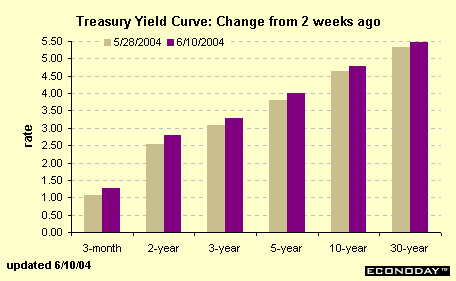
Economic news, Fed speak, and signs of potential inflationary pressures are all contributing to a rising interest rate environment. Yields are up across the board on the Treasury curve with the 2-year note up 27 basis points from two weeks ago while the 30-year bond is up a less severe 13 basis points. The 3-month bill now stands 27 basis points above the fed funds rate target; typically the 3-month bill is virtually identical to the fed funds rate. No question, bond market players are ready for a 25 basis point rate hike at month end.
Markets at a Glance
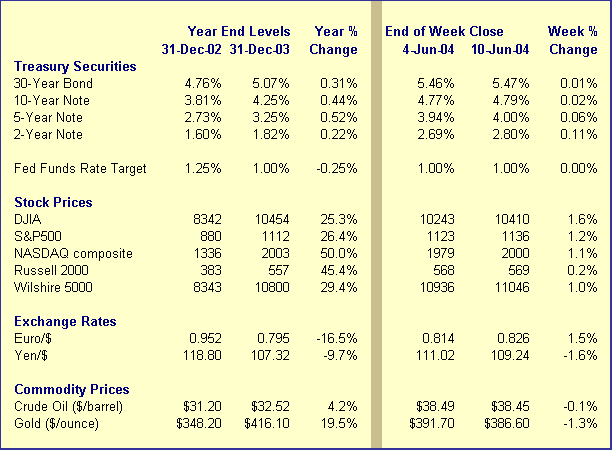
Weekly percent change column reflects percent changes for all components except interest rates. Interest rate changes are reflected in simple differences.
The Economy
Importing inflation
The Bureau of Labor Statistics (BLS) originally scheduled the May PPI to be reported on June 11, but when the federal holiday for Ronald Reagan was first announced, the BLS shifted the report to Thursday afternoon. As it turns out, they instead postponed the release indefinitely for a fourth time this year. They are having problems with their antiquated computer system - which is not conforming to their new method (introduced this year) of calculating industry price changes.
The import and export price index was released on Thursday morning. Import prices jumped 1.6 percent in May as petroleum import prices surged 10.3 percent for the month! Oil import prices are posting a whopping 43.9 percent year-over-year change. Since non-oil import prices increased only 0.4 percent in May and are 3 percent higher for the year, the total import price index is now 7 percent higher than last May. Export prices rose a modest 0.3 percent in May after posting larger gains in the past few months. Agricultural export prices increased a moderate 0.5 percent, much less than April's 2.7 percent hike and March's 3.4 percent gain. Nonetheless, agricultural export prices are up 20.9 percent from last May. Non-ag export prices inched up 0.2 percent in May and are only 2.8 percent higher than a year ago.
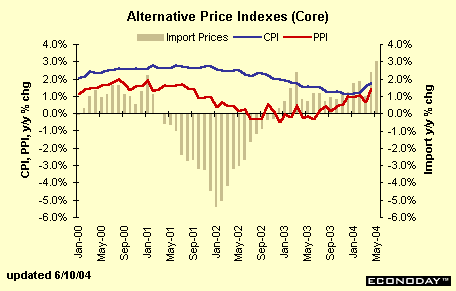
Imports make up a large portion of goods that we purchase. Certainly, one can't exclude oil from this mix. While foreign producers want to keep market share in the United States, they don't always raise prices to their fullest extent. Even though the foreign exchange value of the dollar has plunged relative to the euro and other foreign currencies, U.S. imports are probably not reflecting the entire gain. Consequently, changes in import prices will not always get factored in domestic inflation. But there is no question that the import price index moves in the same direction, albeit not by the same magnitude, as the producer price index and the consumer price index.
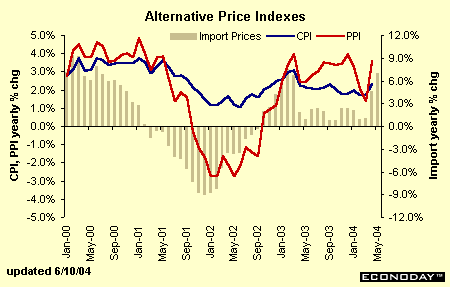
Notice that the changes in the import price index tend to lead both the CPI and the PPI. Also, note that the yearly changes in the import price index (the right axis in the chart above) are more than twice as large as the yearly changes in the PPI or the CPI (the left axis in the chart above). The producer price index corresponds more neatly with the import price index because both indexes are primarily reflecting prices of goods rather than services. The CPI has a much smaller goods component and is primarily governed by prices of services. Nevertheless, notice that even the CPI moves in the same direction as the import price index.
In the past two months, the import price index has jumped sharply after a period of relative stability. CPI and PPI gains are likely to accelerate for at least a couple of months more. Keep in mind that energy prices are the primary movers. The chart below compares the non-petroleum import price index to the core CPI and PPI (excluding food and energy prices). Notice that the trends are much less pronounced here and the lag between changes in import prices and the PPI and the CPI is longer. However, rising import prices have translated into rising PPI and CPI eventually.
Labor market in holding pattern
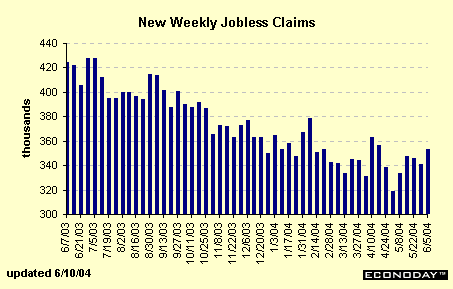
New jobless claims rose 12,000 in the week ended June 5 to 352,000 after decreasing in the two previous weeks. This week did include a holiday which makes seasonal adjustment more difficult. On the whole, the trend in claims is fairly stagnant, as claims have settled in around 340,000 per week. In the second half of the 1990s, new weekly claims were running well below this level, reaching a low of 270,000 in March 2000. At this point, it would be more promising if the jobless claims levels were running closer to 320,000 on average.
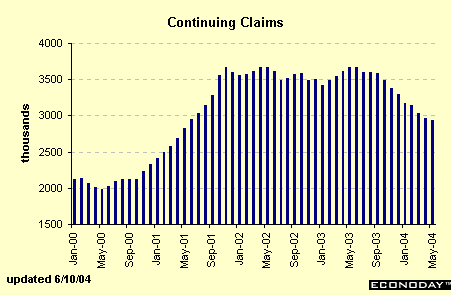
Continuing claims are headed lower but the rate of decline has moderated significantly in the past few months. In the past few months, the level of continuing claims has fallen below 3,000,000. However, many believe that at least some of the drop in continuing claims is due to the fact that workers have become ineligible to collect unemployment insurance and benefits have run out. Note that continuing claims were running close to 2,000,000 in 2000, significantly fewer than today.
The Bottom Line
Financial market players are becoming more jittery over inflation prospects and concerns that the Fed, despite their assurances to the contrary, will raise rates in rapid succession as they did in 1994. Yes, inflation has accelerated from last year, but then many analysts and policy makers were worried that disinflation (a slowing in the rate of inflation) would turn to deflation (outright declines in the general price level a la Japan).
Fed Chairman Alan Greenspan commented on the Fed's monetary policy, as he sees it today. As usual, his explanation was as clear as mud and left lots of room for trading opportunities depending on one's interpretation of his remarks.
Next week promises to be chock full of economic data beginning Monday with retail sales and the international trade deficit (a holdover from this week). Tuesday's CPI will also be closely monitored for signs of incipient inflationary pressures. Industrial production and housing starts will be widely monitored on Wednesday.
Looking Ahead: Week of June 14 to June 18
Monday
Retail sales fell 0.5 percent in April after posting six straight monthly gains. A drop in sales at motor vehicle dealers dampened sales, but even excluding autos, retail sales dipped 0.1 percent for the month. Early indications for May suggest that sales should rebound: domestic motor vehicle sales alone jumped 9 percent in May.
Retail sales Consensus Forecast for May 04: 1.1 percent
Range: 0.6 to 1.5 percent
Retail sales ex autos Consensus Forecast for May 04: 0.5 percent
Range: 0.2 to 0.8 percent
The international trade balance on goods and services widened to $46 billion in March after reaching a $42.1 billion shortfall in February. Exports did rise during the month, but were outpaced by gains in imports.
International trade balance Consensus Forecast for Apr 04: $-45 billion
Range: $-47.5 to $-43.5 billion
Tuesday
The consumer price index rose 0.2 percent in April after a 0.5 percent hike in March. Surprisingly, energy prices inched up a mere 0.1 percent. Since we know that gasoline prices were rising steadily, look for a jump in energy prices in May. Excluding food and energy, the CPI rose 0.3 percent in April, less than March's 0.4 percent jump.
CPI Consensus Forecast for May 04: 0.5 percent
Range: 0.3 to 0.7 percent
CPI ex food & energy Consensus Forecast for May 04: 0.2 percent
Range: 0.1 to 0.3 percent
Business inventories jumped 0.7 percent in March and 0.8 percent in February. It is unlikely that the April gain will be as large: manufacturers' inventories grew 0.4 percent while wholesale trade inventories dipped 0.1 percent in April. Retail trade inventories account for roughly one-third of the total and would have to jump sharply to match the gains of the past two months.
Business inventories Forecast for Apr 04: 0.3 percent
Range: 0.2 to 0.6 percent
The Empire State Manufacturing survey fell back to 30.2 in May after reaching 34 in April. These levels still represent a healthy pace of manufacturing activity in the New York region. Market players believe this survey is a precursor to the ISM manufacturing survey.
Empire State Forecast for June 04: 30
Range: 27 to 36.8
The University of Michigan's consumer sentiment index dropped several points in May to 90.2 after reaching a level of 94.2 in March. Consumer finances were hit by rising mortgage rates as well as higher gasoline prices and this likely dampened consumer optimism to some degree.
Consumer sentiment Consensus Forecast for mid-June 04: 90
Range: 87 to 93
Wednesday
Housing starts fell 2.1 percent in April to a 1.969 million-unit rate after recording a 6.1 percent spurt in March. Rising interest rates are likely to curtail housing construction, but improved income prospects should limit the fall.
Housing starts Consensus Forecast for May 04: 1.95 million-unit rate
Range: 1.89 to 2.01 million-unit rate
The index of industrial production increased 0.8 percent in April after dipping 0.1 percent in March. Among major product groups, consumer goods, business equipment and construction supplies all posted healthy gains for the month; defense and space equipment production dipped 0.2 percent, though. Continued gains in factory payrolls and the workweek bode well for May production.
Industrial production Consensus Forecast for May 04: 1.0 percent
Range: 0.2 to 1.2 percent
Capacity utilization rate Consensus Forecast for May 04: 77.6 percent
Range: 77.0 to 77.9 percent
The Fed's Beige Book will be reported on Wednesday afternoon. Market players will closely monitor this report for news on potential inflationary pressures and labor market conditions.
Thursday
New jobless claims increased 12,000 in the week ended June 5 to 352,000. As a result, the 4-week moving average increased to 346,000. On the whole, May claims are down from April levels, but June is not off to a good start.
Jobless Claims Consensus Forecast for 6/12/04: 340,000 (-12,000)
Range: 335,000 to 355,000
The index of leading indicators inched up 0.1 percent in April with about half of the indicators posting increases. In May, at least two components will contribute in a negative fashion: stock prices and consumer expectations. The factory workweek, new claims, vendor performance and the 10-year note to fed funds spread will be positive influences on the leading indicator index in May.
Leading indicators Consensus Forecast for May 04: 0.4 percent
Range: 0.2 to 0.6 percent
The Philadelphia Fed's business outlook survey fell back in May as the general conditions index dipped to 23.8 from 32.5. Any level above zero shows an expanding manufacturing sector. Indeed, in nine of the past 12 months this index has surpassed a level of 20, suggesting robust activity.
Philadelphia Fed Consensus Forecast for June 04: 25
Range: 23 to 30
The current account is an indicator more frequently monitored in foreign countries than in the United States. Since the foreign exchange value of the dollar has fallen so sharply in the past year, more market players are looking at this quarterly indicator. The current account deficit amounted to $127.5 in the fourth quarter of 2003.
Current account Consensus Forecast for Q1 04: $-142 billion
Range: $-145 to $-128 billion

