Recap of US Markets
STOCKS
Stock prices fell on Monday as interest rates rose on fears that inflationary pressures were percolating and that the Fed would need to start raising the fed funds rate target by 50-basis-point chunks. The May CPI alleviated these fears on Tuesday, along with remarks by Fed Chairman Alan Greenspan who was speaking at his confirmation hearings. Stock prices managed to pick up a bit on Tuesday, but except for the Dow, never managed to get back to the prior week's closing levels. Indicators reflected healthy economic growth during the week, but inflation worries, along with the ever-present concern over terrorist attacks, overwhelmed investor sentiment. Prices were generally down on the week, though the Dow did inch up 0.1 percent.

BONDS
On Monday, bond investors, fearing the worst, were anxiously anticipating Tuesday's CPI report. The inflation news wasn't great, but later that day Alan Greenspan commented on inflation at his confirmation hearing and still indicated that the Fed would raise the funds rate target at a "measured pace". Despite a larger-than-expected jump in the PPI on Thursday, yields still managed to hold their own. Monday's spurt was really reflecting the possibility that the Fed would possibly raise the funds rate target by 50 basis points. By the end of the week, bond investors came to the conclusion that the upcoming rate hike will be 25 basis points.

Markets at a Glance

Weekly percent change column reflects percent changes for all components except interest rates. Interest rate changes are reflected in simple differences.
The Economy
May inflation hike: PPI and CPI spurt
The producer price index jumped 0.8 percent in May after an equally sharp 0.7 percent hike in April. In both months, energy prices leaped 1.6 percent, which was no surprise to anyone. However, food prices also posted another 1.5 percent hike in May after already gaining 1.4 percent in April. While energy prices are up 15 percent from a year ago, food prices are 7.4 percent higher than last May. In contrast, the PPI excluding food and energy prices, also known as the core PPI, rose 0.3 percent in May after rising 0.2 percent in each of the two previous months. The core PPI is 1.7 percent higher than a year ago, significantly less than the total PPI which is up 5 percent from May 2003.

In 2002 and the first half of 2003, the core PPI spent almost as much time below the zero line as above it, but year-over-year changes in the index were steadily accelerating throughout the first half of 2004. The year-over-year rise is the largest since July 2001.
In May, tobacco product prices as well as computer prices declined during the month, but higher auto and light truck prices helped to lift the core PPI. While a few components of the PPI for finished goods posted declines for the month, increases dominated the index. This is in contrast to a year ago when prices of many major components were declining.
Market players also like to look at the crude and intermediate goods indexes (excluding food and energy) to gauge prices in the pipeline. While the intermediate goods index less food & energy rose 0.9 percent in May, crude materials prices plunged 3.8 percent for the second straight month. Despite the two-month drop, crude materials prices (less food & energy) are 21.7 percent higher than a year ago. Intermediate goods prices (excluding food & energy) are 5.1 percent higher than last May. While price hikes at earlier stages of processing sometimes are passed along the pipeline to the finished goods index, the majority is not. Pricing power may have improved lately, but don't expect to see the core PPI for finished goods double from 1.7 percent to 3.4 percent in the next couple of months. We haven't seen increases of that magnitude in the core PPI since 1991.

The consumer price index rose 0.6 percent in May, three times as fast as the April gain. This was almost entirely due to a 4.6 percent spurt in energy prices; food prices increased 0.9 percent. Excluding these two volatile components, the core CPI inched up only 0.2 percent in May, less than the increases of the two previous months. While many of the major components are posting gains similar to previous months, apparel prices increased 0.3 percent, the third straight month of gains. Apparel prices had been posting year-over-year declines since December 1998!

When speaking on inflation and the CPI at his confirmation hearing, Greenspan did not seem alarmed. He reaffirmed his inclination to raise the federal funds rate target at a "measured pace". Perhaps it was because the Fed chairman was looking at a chart similar to the one below which suggests that prices of services are still softening. Service prices were up 2.8 percent from a year ago in May, compared with a 3 percent yearly gain in April. Goods prices have surged recently, but these are largely related to energy prices. The best inflation news for this cycle is probably behind us, but it doesn't mean that inflationary pressures are set for a disastrous course. Since services comprise 58 percent of the CPI, a moderate inflation pace in this component will help hold down inflationary pressures allowing the Fed to increase the fed funds rate target at a "measured pace" indeed. The Fed could very well increase the funds rate target at each of the five upcoming FOMC meetings in 2004, but by 25 basis point increments, not 50. That would be a measured pace that would bring the funds rate target to a more appropriate rate for the cycle and still be in tune with inflation news.

Production jumps!
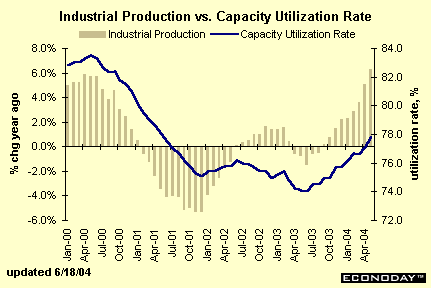
The index of industrial production jumped 1.1 percent in May, the largest monthly gain since August 1998. While a healthy 3.3 percent hike in utilities production helped to boost the total, gains were robust among major market groups. Consumer goods rose 0.8 percent, business equipment gained 1.4 percent, and nonindustrial supplies (which includes construction supplies) rose 1.7 percent. As a result, the industrial production index was up 6.3 percent in May from a year earlier, continuing the strong climb of the past several months. Incidentally, the Philadelphia Fed's business outlook survey for June continued to climb. This regional indicator is a good predictor for industrial production and it suggests that we could very well see another healthy rise in production next month.

The rise in production was accompanied by an increase in the capacity utilization rate to 77.8 percent from 77.1 percent in April. Notice the steady upward trend in operating capacity that began last summer. The Fed monitors capacity utilization rates closely because they can indicate whether supply bottlenecks are occurring that would eventually lead to percolating inflationary pressures. Historically, utilization rates would need to surpass 85 percent to suggest imminent danger of inflation; we have a ways to go before that happens. A rising operating rate, though, also has beneficial implications for an economy. If producers believe that capacity constraints will soon be reached, they are inclined to invest in new plant and equipment: thus, capital spending is born!
The Consumer: Spending & Investing
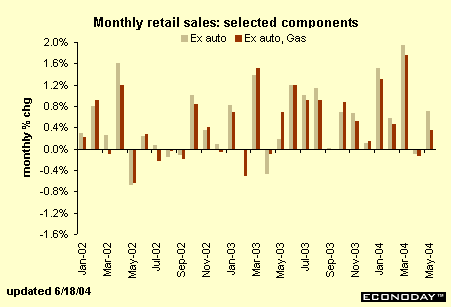
Retail sales rose 1.2 percent in May, more than reversing April's 0.6 percent drop. Motor vehicle sales rose 2.7 percent in May after declining 2.1 percent in April. Nonauto retail sales also improved in May, rising 0.7 percent after a 0.1 percent dip in the previous month. However, given the sharp rise in gasoline prices, it is useful to look at nonauto sales excluding gas stations. These sales increased 0.3 percent in May after inching down 0.1 percent in April. Yes, sales improved during the month, but are sluggish relative to the robust pace recorded in the first three months of this year. It is hard to believe that consumers aren't feeling the pinch of $2-per-gallon gasoline prices. In the past couple of weeks, it appears that gasoline prices have decreased by a few cents - let's see whether that helps retail sales this summer.

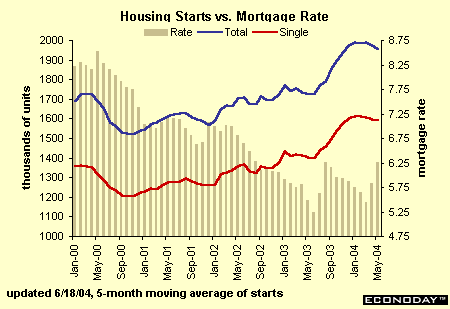
Housing starts edged down 0.7 percent in May after a 1 percent drop in April. Nonetheless, starts are still 12.5 percent higher than last May. Single-family housing starts rose 1.4 percent in May, more than reversing the previous month's 0.4 percent dip. Single-family starts are 17.7 percent higher than a year ago despite the fact that 30-year mortgage loans, at an average 6.27 percent in May, are 79 basis points higher than last year! The drop in housing starts was entirely due to a 9.9 percent decline in multi-family units. Year-on-year multi-family starts are down 7.9 percent. Multi-family construction tends to be more volatile than single-family housing starts from one month to the next. It is likely that starts will continue to head lower in coming months as interest rates rise further. However, housing analysts expect the market to remain relatively healthy over the next year as rising income levels stemming from improved employment compensate for higher interest rates.

International trade deficit widens in April
The international trade deficit widened to $48.3 billion in April after reaching a $46.6 billion shortfall in March. Imports edged up a meager 0.2 percent in April, but exports declined 1.5 percent for the month, contributing to the widening deficit. Key export markets posted declines in April, including nonauto capital goods (which include civilian aircraft), as well as auto exports. Imports of crude oil and petroleum products decreased in April, but imports of nonauto capital goods and consumer goods posted healthy gains. Auto imports also increased marginally.

The bilateral trade figures show that the trade deficit worsened against many major trading partners in April. Since these figures are not adjusted for seasonal variation, it is useful to compare year-to-date trade balances. In the first four months of 2004, the trade deficit has worsened significantly with most major trading partners excluding a handful of exceptions: Western Europe, Newly Industrialized Countries (NICs), and Brazil.
The Bottom Line
Inflation is the name of the game these days, a sharp contrast to a year ago when Fed policymakers and market players were worried about deflation. Both the CPI and the PPI were reported this week, with the latter surprising investors with its large gain. Luckily for investors, Alan Greenspan indicated that the Fed was likely to move at a "measured pace" despite the May CPI report because he didn't think that consumer prices would continue to escalate at the same pace in coming months.
Aside from inflation news, economic growth appeared on a healthy path as industrial production grew at its fastest monthly pace in six years, retail sales rebounded from April's drop, and housing starts dipped only modestly despite rising mortgage rates. The international trade deficit widened, and this will indeed put a damper on GDP growth in the second quarter.
In contrast to this past week, next week will be relatively sparse with respect to economic indicators. It may not matter too much: market players are in a holding pattern for June 30th, the day of the FOMC announcement.
Looking Ahead: Week of June 21 to June 25
Thursday
New jobless claims decreased 15,000 in the week ended June 12 to 336,000, but these figures need to be taken with a grain of salt. Many states shut down their unemployment insurance offices in honor of former president Ronald Reagan's memorial services on Friday of that week. The 4-week moving average dipped to 343,250.
Jobless Claims Consensus Forecast for 6/19/04: 345,000 (9,000)
Range: 335,000 to 355,000
Durable goods orders plunged 3.2 percent in April after two monthly gains that totaled nearly 10 percent rise. Declines were widespread across the major categories with only a 3.4 percent spurt in electrical equipment. Boeing orders jumped in May and this could help boost total durable goods orders for the month.
Durable goods orders Consensus Forecast for May 04: 1.3 percent
Range: 0.3 to 2.6 percent
New home sales dropped a precipitous 11.8 percent in April to a 1,093,000-unit rate after rising sharply in March. Until now, monthly home sales have surpassed levels set a year earlier. Now that home sales have moderated in the past few months, year-over-year gains may be harder to achieve.
New home sales Consensus Forecast for May 04: 1,130,000
Range: 1,100,000 to 1,225,000
Friday
The Commerce Department's final estimate for first quarter real GDP is not likely to vary much from the previous estimate that showed a 4.4 percent growth rate. The same report also showed that real final sales grew at a healthy 3.7 percent rate and the GDP deflator accelerated to a 2.6 percent rate. Usually, final revisions show minor changes among the components, but not sharp variations in total growth.
Real GDP Consensus Forecast for Q1 04: 4.5 percent annual rate
Range: 4.2 to 4.5 percent annual rate
GDP deflator Consensus Forecast for Q1 04: 2.6 percent annual rate
Range: 2.6 to 2.6 percent annual rate
Existing home sales rose 2.5 percent in May to a 6.64 million-unit rate after increasing 5.7 percent in March. Despite rising mortgage rates, buyers are still finding affordable homes. As interest rates continue to increase in coming months, home sales are likely to dip.
Existing home sales Consensus Forecast for May 04: 6.50 million-unit rate
Range: 6.25 to 6.70 million-unit rate
The University of Michigan's consumer sentiment index jumped five percentage points at mid-month as signs of an improving labor market and slightly lower gasoline prices may have led consumers to become more optimistic about the economy.
Consumer sentiment Consensus Forecast for June 04: 95
Range: 93 to 95.5


