The Federal Open Market Committee (FOMC) met this week and, as anticipated by market players, voted unanimously to raise the federal funds rate target 25 basis points to 1.5 percent. Economists and investors expected the Fed to raise the target despite the fact nonfarm payroll growth sputtered in July. The bigger surprise faced by market participants was the Fed's post-FOMC statement which basically described the current situation as a temporary soft patch. According to the Fed, "The economy nevertheless appears poised to resume a stronger pace of expansion going forward." This implies that Fed officials are optimistic about the economy's prospects and that their intentions to "remove policy accommodation" probably remain in place.
The Fed's statement did note the "substantial rise in energy prices" was likely hampering economic growth. But they said, "Inflation has been somewhat elevated this year, though a portion of the rise in prices seems to reflect transitory factors." They also went on to declare the upside and downside risks of "price stability for the next few quarters are roughly equal." However, the minutes of the June 29-30 FOMC meeting suggested otherwise, showing many FOMC members were more concerned, not less concerned, about inflation and that they wanted to put that information in the statement. However, even last month's statement did not indicate that inflation was a major concern among Fed officials.
This week has been all about oil prices. Crude oil futures surpassed $45 per barrel and then traded well above $46 per barrel to reach a new historic high on Friday. Earlier this week, a Saudi spokesman said his country was prepared to increase production by 1.3 million barrels per day and suggested that hedge funds and speculators were responsible for the surge in prices. The Saudis apparently don't believe that current demand justifies such prices. Well, the futures market is all about speculation, and oil traders have a lot to speculate on.
Some analysts are not convinced the Saudis have sufficient capacity to meet additional demand. Furthermore, fighting intensified in Iraq, particularly in the region that pumps oil. Venezuela is in the midst of a presidential election recall, raising the risk that another labor strike might reduce oil production. And if that isn't enough, the Russian oil production company Yukos remains a question mark. Oh, yes, Bonnie and Charley raised fears that Gulf of Mexico oil production would be adversely affected on Thursday and Friday, but the pair of storms seem to be flooding the shores of Florida instead.

Recap of US Markets
STOCKS
There was no change in the stock market story this week. The orange terror alert is still on in selected cities on the East Coast, and oil remains a major concern for equity investors. July was a disastrous month for the stock market, and the first half of August has been even worse. Oddly enough, the only day in which stock prices surged this last week was the day the Fed raised the federal funds rate target by 25 basis points. It seems that equity investors were relieved the Fed went ahead with its rate hike after all, despite the dismal employment report. Market players apparently interpreted the Fed move as a signal the economy really isn't so bad. Is this perverse or perfectly reasonable'

BONDS
In contrast to the June 30th hike in the federal funds rate when yields of Treasury securities fell, yields rose after the Fed announced their second 25 basis points rate hike on August 10. The rate hike alone would not have caused the markets to even blink, but the hawkish statement that accompanied the rate hike on Tuesday caused Treasury investors to reassess their thinking on the Fed. A week ago, the Labor Department announced that nonfarm payrolls rose by a meager 32,000, a paltry number no matter how you cut it. While market players expected the Fed to still raise rates on Tuesday, they thought the sluggish employment report would lead the Fed to give some indication (via the statement) that perhaps upcoming rate hikes would be slower than "at a measured pace". The statement, however, seemed to imply the Fed stood quite ready to raise rates again at their September 21 meeting. While the statement was indeed hawkish, it is unlikely the Fed would raise the fed funds rate target in September if the August employment report proves as bad as July's.

Market players are having a hard time trying to figure out exactly what's going on these days and how the Fed will react. For instance, rising energy prices hamper economic growth and this would be good for the bond market - implying that the Fed would not need to raise rates rapidly. However, rising energy prices could also be inflationary. A rise in energy prices alone is not inflationary; oil prices are up because either supply or demand conditions (or both) have changed. But if higher energy prices are reflected in higher product prices of goods (which require energy for production and shipment) then prices will indeed rise for many goods. This then becomes inflationary. Inflation is always "bad" for bonds, and bond investors would prefer the Fed to stay ahead of the inflation curve. Of course, staying ahead of the curve means Fed tightening - or in this case "removing policy accommodation." So how do bond investors make sense of the situation'
Due to the uncertain energy price situation, the stock market is collapsing. Normally, that would imply inflows into Treasury securities, the safe-haven security. Indeed, Treasury yields declined in the second half of the week. Yields are still a little bit higher than they were a week ago (larger increases were recorded for the 2-year and 3-year notes relative to the rest of the maturity spectrum) but not by much.
A significant portion of the increase in rates that took place after the rate hike on Tuesday eventually faded away over the course of the week - and this despite the week's quarterly Treasury refunding that flooded the market with new supply. Note in the chart below that the 10-year note yield is down 57 basis points from its peak reached in May - even after two hikes in the fed funds rate.

Markets at a Glance

Weekly percent change column reflects percent changes for all components except interest rates. Interest rate changes are reflected in simple differences.
The Economy
July inflation in check
The producer price index increased 0.1 percent in July after decreasing 0.3 percent in June. Excluding the volatile food and energy components, the PPI also posted a 0.1 percent hike after posting larger hikes in the two previous months. As a result, the year-over-year change in the total PPI remained at 4 percent in July, the same as in June. Similarly, the year-over-year rise in the core PPI (excluding food and energy) was 1.7 percent, nearly the same as in the previous month. While it appears the core PPI has stabilized in the past few months after having accelerated, there is no question that inflationary pressures are stronger today than they were a year ago.

The question at the top of everyone's list is whether core inflation will accelerate further in coming months. To that end, most economists and market players turn to the producer price index at earlier stages of production such as the intermediate goods index and the crude materials index. The intermediate goods index rose 0.8 percent in July while the crude materials index fell 0.2 percent. But energy prices play a major role in these two indexes. Excluding food and energy, the intermediate goods index increased 0.5 percent, the same as last month. Relative to a year ago, this index was up 6.4 percent, reflecting an accelerating trend over the past 12 months. The crude materials index excluding food and energy prices jumped a whopping 8.6 percent in July, but this must be taken in context - and reflects a cumulative drop of 9.7 percent over the three previous months. In any case, the year-over-year change accelerated to 28.8 percent. There may indeed be price hikes in the pipeline that have yet to be passed through to the finished goods index. However, and this is an important point, the crude and intermediate price indexes are more volatile than the finished goods index, meaning they will hit higher highs and lower lows. The full amount of the gains in the crude and intermediate price indexes will not filter through to the finished goods index.

Retail sales rise
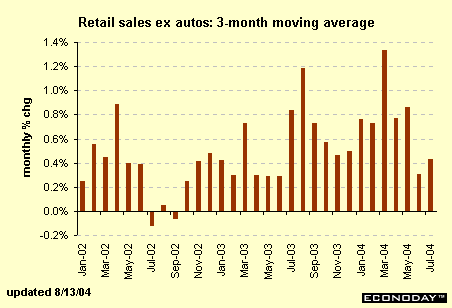
Total retail sales rose 0.7 percent in July after a revised 0.5 percent drop in June. Initially, the June drop was estimated at 1.1 percent. Sales at motor vehicles & parts dealers rose 2.4 percent in July after declining 3 percent in June. Motor vehicle sales fluctuate sharply from month to month depending on the kind of incentives that automakers offer on cars and trucks. Excluding the auto group, retail sales edged up 0.2 percent after an upward revised gain of 0.3 percent in June. Market players should have been disappointed with the July figures since they were weaker than expected, but the upward revision seemed to offer reassurance that June really wasn't all that bad. Fact is, retail sales were crummy in June as well as July.
The chart below depicts the three-month moving average of the monthly change in non-auto retail sales. Notice how much sales weakened in July and July relative to previous months! Indeed, non-auto retail sales are posting their weakest pace of growth since the period covering April to June 2003. With slow job growth and high gasoline prices, consumer spending has to be limited.

It should have been no surprise then that the University of Michigan's consumer sentiment index dipped to 94 at its mid-August reading from a level of 96 in July. Consumers who have to lay out more money on gasoline purchases and have a hard time getting a job are not going to be optimistic about the economy or their financial conditions.
Trade deficit a whopper!
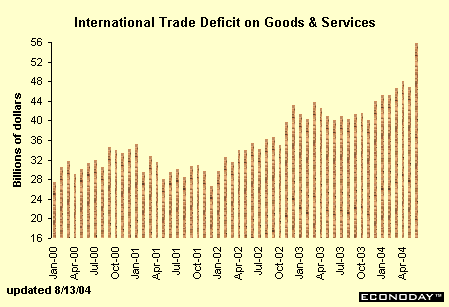
The international trade deficit on goods and services widened sharply to $55.8 billion in June after narrowing to $46.9 billion in May. This was the largest monthly deterioration in the history of the series. While exports fell by 4.3 percent in June, imports jumped 3.3 percent. The combination ended badly for the trade figure - and will lead to a sharp downward revision in second quarter GDP growth. Among the export market, most of the key components posted declines with the largest drop in capital goods excluding autos. Among the import market, nearly every category (except autos) posted large increases, including crude oil and petroleum products.

It is difficult to believe the June figure is anything but an anomaly as a confluence of factors caused exports to drop in the same month that imports surged. However, even if the trade deficit narrows in coming months, imports are not going to plummet nor are exports going to skyrocket. U.S. economic growth may have moderated but it is still fairly healthy. Given that the United States has a higher propensity to consume and import than our major trading partners, it means that large trade deficits are with us for the duration. Furthermore, imports tend to rise during the summer months and early fall as retailers place orders for the holidays.
Nonfarm productivity moderates, but remains healthy
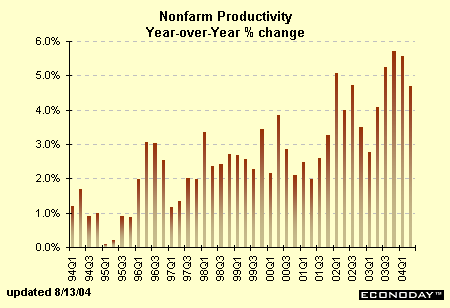
Nonfarm productivity grew at a 2.9 percent rate in the second quarter, slower than the first quarter's 3.7 percent rate. Quarterly productivity growth tends to fluctuate a bit, so most analysts prefer to look at year-over-year percent changes in productivity which tend to be a bit smoother. The chart below depicts productivity growth over the past ten years. On a year-over-year basis, growth has remained relatively steady within a 3 to 6 percent range since 2002, up from a 2 to 4 percent range between 1996 and 2001. The faster productivity pace helps to explain why employment gains have been so meager in this recovery.

The Bottom Line
Economic news was mixed this past week with good inflation (PPI) numbers and less than stellar retail sales data. Productivity figures were healthy but more moderate than previous quarters. The Fed surprised no one by raising the federal funds rate by 25 basis points bringing the target rate to 1.50 percent. The post-FOMC statement was somewhat more hawkish than many analysts expected suggesting that the Fed believes the current slower pace of growth is just a temporary soft patch that will soon be resolved. Nevertheless, Fed officials admitted that high energy prices could be a problem.
Gasoline prices haven't suddenly surged at the pump these past few weeks (in fact, local prices have dropped a few cents), but crude oil futures have reached new historical highs. Given problems in more than one oil-producing nation (Russia, Venezuela and Iraq), crude oil futures are nearly certain to reach $50 per barrel well before they head lower.
Looking Ahead: Week of Aug 16 to Aug 20
Monday
The empire state manufacturing survey's diffusion index jumped more than six points in July to 36.5, the highest level since February. This index is usually released before the Philadelphia Fed's business outlook survey and sometimes signals its direction of change. In both cases, these manufacturing surveys cover local regions, not the nation as a whole.
Empire State Consensus Forecast for Aug 04: 32
Range: 29 to 38
Tuesday
The consumer price index increased 0.3 percent in June after rising by a more rapid 0.6 percent in May. Energy prices rose sharply in both months but less so in June. Energy prices might be less of a problem in July since the June PPI actually saw a drop in energy prices (though the June CPI did not). Moreover, gasoline prices declined in July from the previous month. Excluding food and energy prices, the CPI rose 0.1 percent in June after a 0.2 percent hike in May.
CPI Consensus Forecast for July 04: 0.1 percent
Range: 0.0 to 0.3 percent
CPI ex food & energy Consensus Forecast for July 04: 0.2 percent
Range: 0.1 to 0.2 percent
Housing starts fell 8.5 percent in June to a 1.80 million-unit rate, the largest drop this year. The drop was concentrated in single-family units; multi-family housing starts fell less rapidly in June although the latter declined sharply in both April and May. While interest rates have risen from their lows, they are still low by historical standards.
Housing starts Consensus Forecast for July 04: 1.89 million-unit rate
Range: 1.725 to 1.95 million-unit rate
The index of industrial production fell 0.3 percent in June after rising 0.9 percent in May. Among major market groups, production of consumer goods fell 0.7 percent in June, although production of business equipment and defense & space equipment posted gains. The capacity utilization rate edged down to 77.2 percent in June after rising to 77.6 percent in May. Typically, these two series move in the same direction.
Index of industrial production Consensus Forecast for July 04: 0.5 percent
Range: 0.2 to 0.8 percent
Capacity utilization rate Consensus Forecast for July 04: 77.5 percent
Range: 77.3 to 77.6 percent
Thursday
New jobless claims fell 4,000 in the week ended August 7 to 333,000; as a result, the 4-week moving average dropped to 339,2500. A variety of special factors have caused more weekly volatility than normal around this time of year. Perhaps claims are now back on track and once again reflect current conditions.
Jobless Claims Consensus Forecast for 8/14/04: 335,000 (2,000)
Range: 325,000 to 340,000
The Conference Board's index of leading indicators fell 0.2 percent in June. Some economists are looking for another drop in July. Among components already available, the average workweek and consumer expectations rose in July. However, new jobless claims will be a drag on the index as will vendor performance, stock prices and the spread between the 10-year note and the fed funds rate.
Leading indicators Consensus Forecast for July 04: -0.2 percent
Range: -0.4 to 0.2 percent
The Philadelphia Fed's business outlook survey improved in July. The general conditions index rose to 36.1 from a level of 28.9, pointing to greater manufacturing activity in this region. This manufacturing survey often correlates to the index of industrial production and is widely followed by market players.
Philadelphia Fed business outlook survey Consensus Forecast for Aug 04: 32
Range: 29 to 38.5


