Recap of US Markets
STOCKS
July and the first half of August hurt the equity markets terribly. But once oil prices calmed down in the second half of August, stock prices began to turn up again. Employment news was relatively decent for August, but this didn't help lift stock prices on Friday. Since stock prices behaved fairly well this week, except for the Nasdaq composite index, the Friday decline didn't keep prices from rising week to week. For the first time in eight weeks, the S&P 500 is up vs. year-end levels, though just barely at 0.1 percent. The Russell 2000 is nearly there, but not quite. The Dow Jones Industrial Average is still 1.9 percent below year-end levels and the Nasdaq composite index is now under water by 7.9 percent.

BONDS
As the week began, Treasury yields fell as the Treasury market was considered a safe haven - in case of potential terrorist attacks during the Republican Convention in New York City. By Thursday, all was well. Consequently, bond investors realized interest rate levels were way too low given that the Fed has already raised rates twice this summer. Market players also became concerned on Thursday that the employment situation for August might actually be strong and that the Fed might be inclined to raise the fed funds rate target once again in September in keeping with their "measured pace" philosophy. The August employment situation wasn't stellar but was certainly good enough to give Fed officials room to raise rates at their September 21 FOMC meeting.

Bond investors will be particularly interested in Fed Chairman Alan Greenspan's remarks before the House Budget Committee on Wednesday - in case he gives any clues about his intentions for the approaching FOMC meeting. Expect to see upward creep in interest rates in coming weeks - particularly on the 10-year note, which has declined, rather than increased, since the Fed raised the fed funds rate target by 50 basis points.
Markets at a Glance
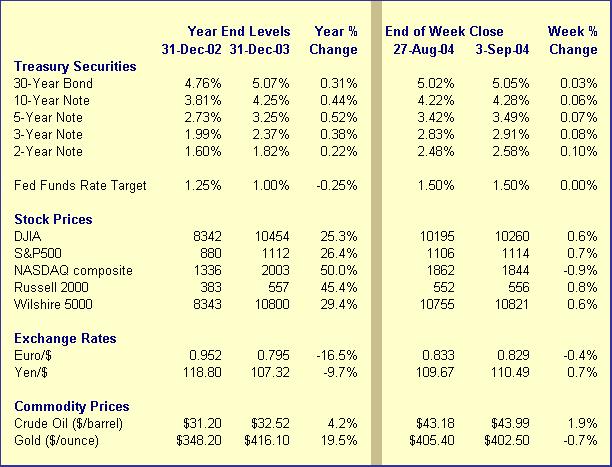
Weekly percent change column reflects percent changes for all components except interest rates. Interest rate changes are reflected in simple differences.
The Economy
Is employment growth strong enough to propel further Fed rate hikes in September'
Nonfarm payroll employment grew 144,000 in August, roughly in line with expectations. Equally encouraging was the upward revision to June and July payrolls which now show growth at 96,000 and 73,000 respectively. The July and June figures are still sub par, but the upward revisions make them somewhat more palatable. Make no mistake, the three monthly reports reveal that employment growth is still expanding significantly less than it should be at this stage of the business cycle. A year ago, we were able to blame healthy productivity growth for the anemic employment picture. However, the most recent payroll data - coupled with other economic indicators - suggest that less than stellar demand for goods and services are causing employers to hire fewer workers. In our view, the most recent employment slowdown is due to dampened demand, perhaps stemming from significantly higher gasoline prices, rather than productivity growth curtailing hiring.
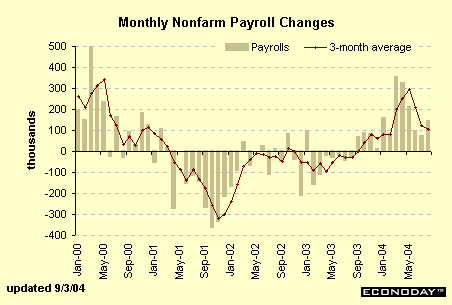
Among the various sectors, it is encouraging to see another 22,000 worker gain in factory payrolls. In the past seven months, manufacturing employment has posted only one minuscule decline. Of course, factory payrolls are down 3.2 million from the December 1997 peak, so a gain of 107,000 is just a blip on the screen. But the direction is right, at least.
Construction payrolls continued to rise, suggesting the housing boom still has legs. Service-producing employment rose 108,000 in August after posting smaller gains in the previous two months. Only two major sectors shed workers in August: trade, transportation & utilities (which is one sector) and retail trade. The latter posted the second straight monthly drop.
All in all, the payroll figures were considered good news simply because June and July figures were so anemic. If we had seen an increase of 144,000 during the mature phase of the expansion, that would have been fine. But an increase of this magnitude, without prior recovery in employment, is simply sluggish, particularly when there were no special factors to dampen activity. According to Labor Department officials, Hurricane Charley did not impact the August data in any perceptible manner.
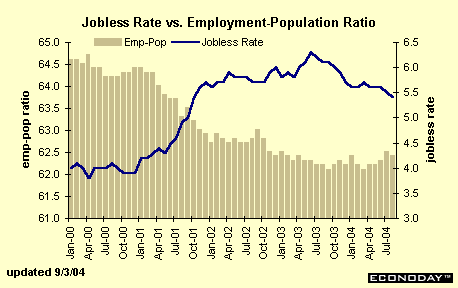
The civilian unemployment rate dipped to 5.4 percent in August after edging down to 5.5 percent in June. Statistically speaking, a change of 0.1 percentage points is not considered significantly different. However, when one sees the rate dropping month by month by 0.1 percentage points, it eventually adds up to a statistically significant change! Thus, the 5.4 percent unemployment rate might not be considered statistically different from the 5.5 percent rate posted in July, but these rates are both lower than the 5.6 percent jobless rate recorded from April through June.
Since the unemployment rate can be jostled from month to month from changes in the labor force, it is useful to also look at the employment-to-population ratio which ignores labor force changes that can be affected by the business cycle (when jobs are hard to find, many people leave the labor force and aren't counted as unemployed). While this ratio dipped to 62.4 in August from 62.5 in July, it does look like the trend has improved in the June-to-August period from the March-to-May period. This confirms the improvement in the unemployment rate. However, these are minor changes; the employment situation is not even as "strong" as it was in 2002 when the jobless rate was higher, while the employment-to-population ratio was much higher then as well.
It was our contention that if nonfarm payrolls grew less than 150,000 in August, the Fed would have a hard time justifying a rate hike on September 21. However, the August gain, coupled with upward revisions to June and July figures, support the Fed's "soft patch" theory to some extent. The drop in the unemployment rate combined with the improved payroll figures suggest the Fed will indeed continue to "remove policy accommodation at a measured pace". This means they are likely to raise the federal funds rate target by 25 basis points at the September meeting. Most likely rate hikes will continue at the November and December meetings as long as nonfarm payrolls - and the economy - cooperate.
ISM Surveys
The NAPM-Chicago is released on the last day of the month and is often used as a precursor for the ISM manufacturing index. In fact, the Chicago index incorporates both manufacturing and non-manufacturing business activity and thus can sometimes be a misleading indicator for the ISM manufacturing index. The Chicago index plunged 7.4 points in August to 57.3. In reality, this isn't such a bad number since anything over 50 suggests that economic activity is expanding.
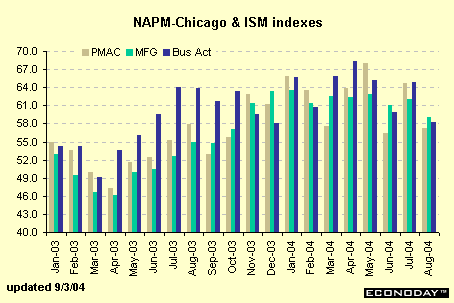
On Wednesday, the ISM's manufacturing index fell 3 points to 59. Certainly this wasn't as bad as the Chicago report, but it did bring the index down below 60 to the disappointment of investors. In fact, levels above 60 for any length of time are unusual; the last time we saw the ISM manufacturing index consistently above 60 for more than one or two months was in 1983. Thus, the posted level of 59 should be considered healthy - and indicative of expansion in the manufacturing sector.
Finally, after the employment report, the ISM non-manufacturing survey came in below expectations for the month of August. The business activity index, which is akin to the production index in the manufacturing report, fell back to 58.2 in August from a level of 64.8 in July. In contrast to its manufacturing cousin, the business activity index, which is the most widely watched reading in the report, has shown more instances of levels above 60. Nevertheless, levels in the high 50s still represent fairly healthy activity.
All in all, these surveys point to slower economic activity in August relative to July. Nonetheless, these levels of activity are fairly healthy. However, since we are accustomed to looking at growth rates, rather than levels, it could be that August indicators will rise at a less rapid pace than July indicators.
Confidence drops
Market players were nearly undone by the 7.5-point drop in The Conference Board's (TCB) consumer confidence index which fell back to 98.2 in August after increasing above 100 in both June and July. According to TCB, both the White House and the Federal Reserve Board called them for a more detailed interpretation of the August report. It seems the survey period ended in the third week of the month - before the significant drop in crude oil futures which had climbed to $49 before dropping back down to $43 by month end. Higher energy prices directly affect consumers - who are sure to become less optimistic about their economic prospects when they are paying significantly higher pump prices. Oddly enough, the run-up in crude oil prices was not matched by a comparable escalation in pump prices in August, although gasoline prices began to inch higher by the end of the month, approaching Labor Day.

As we have indicated in many previous articles, consumer confidence surveys are not always accurate reflections of consumer spending (our view is that actions speak louder than words). However, the August drop in the confidence index did mirror the month's drop in motor vehicle sales.
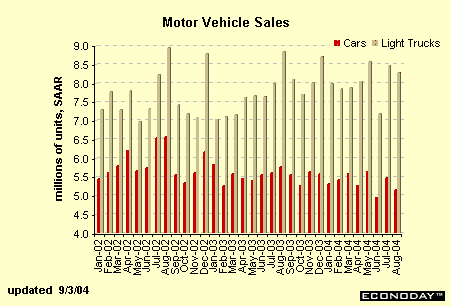
Domestic motor vehicle sales fell 3.6 percent to a 13.4 million-unit rate in August. Higher gas prices should have prompted consumers to opt for cars instead of SUVs. Instead, light truck sales decreased roughly 2.5 percent during the month while autos decreased nearly 6 percent, despite incentives.
The Bottom Line
Aside from the employment report, most of the August indicators this week showed a slower pace of activity from July. The employment report, while not stellar, was in line with expectations and in addition was boosted by upward revisions to June and July figures. Drops in consumer confidence and auto sales are probably not going to prevent the Fed from "removing its policy accommodation" at their September 21 policy meeting and raising the federal funds rate target by 25 basis points to 1.75 percent. At least, this appears to be the developing consensus among economists and market participants.
Fed Chairman Alan Greenspan will be testifying before the House Budget Committee on Wednesday (September 8). Market players are bracing themselves - and believe that Greenspan will give a clue about the expected actions at September FOMC meeting.
Looking Ahead: Week of Sept 6 to Sept 10
Wednesday
The Beige Book will be closely monitored by market players to see if current conditions strongly support - or not - another Fed rate hike this month. While the August employment situation will play a major role in the determination of Fed policy this month, every indicator matters as we approach the election. Market players will be looking at the pace of retail sales, labor market conditions, inflation and manufacturing activity.
Consumer installment credit expanded $5.5 billion in June after a larger $8.1 billion gain in May. While revolving credit plays a role in consumer credit growth, most monthly movements are governed by fluctuations in motor vehicle sales, which are largely financed rather than purchased outright in cash!
Consumer credit Consensus Forecast for July 04: $8 billion
Range: $5 to $10 billion
Thursday
New jobless claims jumped 19,000 in the week ended August 28 to 362,000. This brought the moving average up to 343,000. According to Labor Department officials, about half the rise was due to the effects of Hurricane Charley.
Jobless Claims Consensus Forecast for 8/21/04: 345,000 (-17,000)
Range: 335,000 to 360,000
The import price index inched up 0.2 percent in July after dipping 0.1 percent in June. Excluding petroleum imports, prices rose 0.1 percent in July. Export prices rose 0.4 percent in July after declining 0.7 percent in June. Most of the time, export price fluctuations are due to farm prices.
Import prices Consensus Forecast for Aug 04: 0.7 percent
Range: 0.1 to 1.1 percent
Export prices Consensus Forecast for Aug 04: NA
Range: NA
Friday
The producer price index inched up 0.1 percent in July after declining 0.3 percent in June. Energy prices contributed to the drop in June as well as the rise in July. Excluding food & energy, the PPI edged up 0.1 percent in July after posting larger gains the four previous months.
PPI Consensus Forecast for Aug 04: 0.2 percent
Range: -0.1 to +0.5 percent
PPI ex food & energy Consensus Forecast for Aug 04: 0.1 percent
Range: 0.1 to 0.2 percent
The international trade deficit on goods and services soared in June to reach a new record of $55.8 billion. In the same month a confluence of factors led to a sharp drop in exports and a spurt in imports. Until May, export growth had been pretty good and income growth a bit more moderate. But even if the trade deficit were to narrow, it won't get back to the lower levels posted 6 to 9 months ago.
International trade balance Consensus Forecast for July 04: $-51.5 billion
Range: $-49.5 to $-56 billion

