Recap of US Markets
STOCKS
It was not a good quarter for the equity market! Key market indexes were mostly negative - some more so than others! The smallest quarterly drop, by a hair, came from the Wilshire 5000, the broadest stock market measure. Although the Wilshire posted a 1.6 percent gain in September and a minuscule 0.2 percent rise in August, it was not enough to offset July's 3.9 percent drop. It fell 2.2 percent for the quarter. The S&P 500 fell by 2.3 percent in the third quarter with a 0.9 percent gain in September, a 0.2 percent increase in August and a 3.4 percent drop in July. These were the two best performing indexes.

The Russell 2000, a well-known measure of the small cap sector, decreased 3.1 percent in the third quarter. The index managed to post a healthy 4.6 percent hike in September but this was not sufficient to offset the combination of a 0.6 percent decline in August and a 6.8 percent drop in July.
The Dow Jones Industrial Average fell 3.4 percent in the third quarter. It posted a 0.9 percent drop in September, a meager 0.3 percent rise in August and a 2.8 percent decline in July. The Dow may have done better in September, save for a plunge in Merck's stock price on the last trading day of the month, which depressed the Dow.
Finally, the Nasdaq composite index plunged 7.4 percent in the third quarter despite a 3.2 percent hike in September. Economic conditions, crude oil prices, earnings announcement and warnings were the primary factors that led to a 7.8 percent drop in July and a 2.6 percent decline in August. The September gain was meager in comparison - although really not bad on its own.
As of September 30, only the Wilshire 5000 stood above year-end levels at 0.9 percent.
BONDS
The Fed raised the fed funds rate target on June 30th, the last day of the second quarter, and then twice more during the third quarter (August 10 and September 21). Yet, yields have fallen in the past three months rather than risen. This has astounded market players and one can read articles about this conundrum nearly daily. With weaker than expected economic growth and a falling stock market, investors were more inclined to buy bonds. The demand for fixed income securities lifted their prices and reduced their yields. Aside from a reduction in the yield curve, it is also flatter than it was three months ago. The short end is recognizing that the Fed is raising rates; the long end is happy inflation is not a problem.

Markets at a Glance

Weekly percent change column reflects percent changes for all components except interest rates. Interest rate changes are reflected in simple differences.
The Economy
ISM moderates but still healthy
The NAPM-Chicago business barometer jumped four points in September to a level of 61.3 with a spurt in new orders (more than a 10 point hike!) as well as healthy gains in the rest of the categories including the beleaguered employment sector. It is important to remember the Chicago business barometer covers both the manufacturing and non-manufacturing sectors - and tends to move more dramatically (in either direction) than the ISM surveys.
In contrast to the Chicago index, the ISM manufacturing index edged back to 58.5 in September from a level of 59 in August. While a level in the high 50s can certainly be categorized as solid for this index, the ISM was at 60 or above for the nine-month period ending in July. The manufacturing composite index had not attained such consistently high levels since the early 1980s.

But since we are accustomed to monitoring monthly and quarterly changes in economic activity, the monthly moderation signals a slower rate of growth - and this might be viewed in a negative light by those who are looking for economic activity to grow more rapidly.
Labor market still in the doldrums
The Conference Board's help wanted index remained at 37 in August. It has been bumping along bottom for more than a year already. While we contend that fewer employers are using the printed media and instead putting want ads online, there should still be some improvement in the index at this stage of the business cycle. If labor demand were bustling, employers would be using all means at their disposal to post job availability. And that isn't the case these days.

New weekly jobless claims rose yet again in the week ended September 25 to 369,000. It is the highest recorded level this year since the week of February 7. While it is true that claims have risen in the past few weeks because of the impact of Charley, Frances, Ivan and Jeanne, it is still true that claims weren't on much of a downward trend even before the hurricanes hit. Notice the trend has been flat since March. Special factors aside, the situation is not happy.
Perhaps a soft jobs market is why both the Conference Board and University of Michigan consumer attitude surveys showed that consumers were less optimistic in September. Both surveys showed declines of roughly two points in their primary indexes. And in both cases, the declines were larger for the current situation; the assessment of future expectations was about on par with the previous month. Consumers are simply tired of facing higher energy prices (they can't conveniently remove them from their personal CPI since gasoline is a fact of life) and tired of a tough jobs market. The Conference Board's survey revealed that fewer people (16.8 percent vs. 18.4 percent) believed jobs were plentiful in September, and more people (28.3 percent vs. 26 percent) that jobs were hard to get.

Income grows, spending doesn't...
Personal income increased 0.4 percent in August, twice as fast as the previous month. Similarly, disposable income (which excludes taxes) also increased 0.4 percent after two months of smaller gains. At the same time, personal consumption expenditures were unchanged for the month due primarily to a 1.6 percent drop in durable goods spending. Sharp fluctuations in motor vehicle sales cause large monthly variations in durable goods expenditures. In July, durable goods jumped 6.2 percent! The flat consumer spending figure coupled with the improved disposable income gain helped to boost the personal savings rate to 0.9 percent in August from 0.5 percent in July. The savings rate is woefully low - even if one believes this measurement of savings to be less than reliable.

...But home sales do
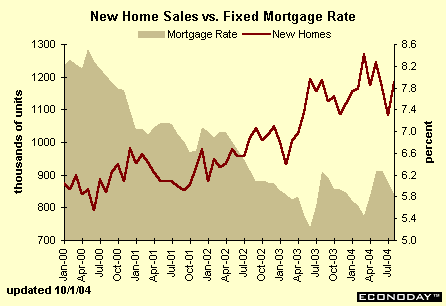
New single-family home sales jumped 9.4 percent in August to a 1,184,000-unit rate. This was in contrast to the prior week's report that existing home sales fell during the month. Historically, the two series move in tandem although in the past few years it has not been unusual to see flip flops between the series (when one rises, the other falls). Despite the healthy rise in new home sales in August, notice the level is well below levels seen in the first half of the year. Sales were 0.4 percent below last August's new home sales.

While the median price of a new home was 9.7 percent higher than a year ago and the average price up 10.8 percent, it is interesting to note that both the median (-2.6 percent) and average (-5.9 percent) fell sharply from the previous month. Many pundits are citing anecdotal evidence that housing appreciation is moderating - and here are some signs. Existing home sale prices also dipped in August.
GDP revised up in Q2
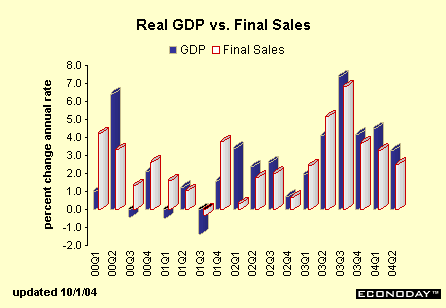
The Bureau of Economic Analysis reported that its previous estimate of second quarter real GDP was too low and revised up the growth rate to a 3.3 percent rate from 2.8 percent. Market players seemed to get quite excited about the upward revision but this is old news and has virtually no bearing on current events! Indeed, look at the pattern of growth in real GDP and final sales: it is simply moderating quarter after quarter. A faster rate of growth would promote corporate profits - and employment.

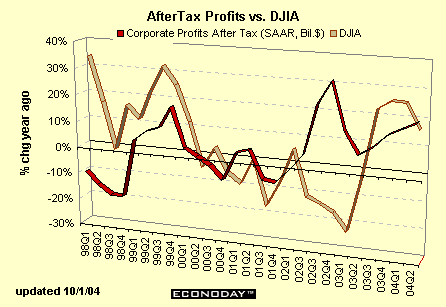
After tax corporate profits did accelerate in the second quarter, rising 19.5 percent during the period after growing 17.2 percent in the first quarter. These are year-over-year gains. Notice that yearly changes in profits move with yearly changes in stock prices. It does appear that changes in the Dow may be leading changes in corporate profits by a quarter or so (at least in the period spanning 1998 - 2004). The recent drop in the Dow could be signaling a drop in corporate profits in the upcoming quarter.

The Bottom Line
While most of the stock indexes managed to post a gain in September, indexes posted declines for the third quarter due to extreme weakness in the equity markets in July. The bond market benefited and bond prices rose during the quarter - and yields declined. The declining rate environment in the bond market is unusual given the fact the Fed has raised rates three times in three months.
Economic indicators were generally in line with expectations. Growth is progressing at a relatively decent pace but isn't accelerating - and this could bode poorly for the labor market. Without healthy growth in nonfarm payrolls, consumer spending gains will be limited.
Economic news will be sparse in the first half of the upcoming week, but the mother of all indicators (employment) will be released on Friday. Fasten your seat belts!
Looking Ahead: Week of Oct 4 to Sept Oct 8
Monday
Factory orders increased 1.3 percent in July after rising 1.2 percent in June. Nondurable goods new orders have been posting healthy gains in the past several months. New orders for advance durable goods declined 0.5 percent in August and this could dampen total factory orders.
Factory orders Consensus Forecast for Aug 04: 0.1 percent
Range: -0.3 to 0.5 percent
Tuesday
The ISM non-manufacturing survey fell back in August. The business activity index, which garners the most attention, declined sharply to 58.2 from a level of 64.8 in July. In contrast, the employment index increased in August to a level of 52.5, marking the eleventh straight month the index has posted a level above the 50 percent.
Business activity index Consensus Forecast for Sept 04: 59
Range: 56.5 to 62.5
Thursday
New jobless claims increased 18,000 in the week ended September 25 to 369,000 after rising 33,000 in the two previous weeks. Consequently, the moving average increased to 343,500. According to Labor Department officials, the latest week's rise was mostly hurricane related.
Jobless Claims Consensus Forecast for 10/2/04: 351,000 (-18,000)
Range: 335,000 to 375,000
Consumer installment credit expanded $10.9 billion in July after a smaller $4.3 billion gain in June. While revolving credit plays a role in consumer credit growth, most monthly movements are governed by fluctuations in motor vehicle sales, which are largely financed rather than purchased outright in cash.
Consumer credit Consensus Forecast for Aug 04: $5.9 billion
Range: $4.0 to $7.5 billion
Friday
Nonfarm payroll employment increased 144,000 in August after posting smaller gains in the two previous months. Despite the overall weakness, factory payrolls managed to post a 22,000 hike in August. The civilian unemployment rate dipped to 5.4 percent in August from a level of 5.5 percent in July and after remaining at 5.6 percent in the three previous months. Average hourly earnings rose 0.3 percent in August, on par with the average of the past several months. The average workweek remained unchanged at 33.8 hours in August.
Nonfarm payrolls Consensus Forecast for Sept 04: 150,000
Range: -10,000 to 190,000
Unemployment rate Consensus Forecast for Sept 04: 5.4 percent
Range: 5.4 to 5.5 percent
Average hourly earnings Consensus Forecast for Sept 04: 0.3 percent
Range: 0.1 to 0.4 percent
Average workweek Consensus Forecast for Sept 04: 33.7 hours
Range: 33.6 to 33.8 hours


