Recap of US Markets
STOCKS
How many times have we mentioned oil prices in the past few weeks' Too many to count, I'm sure. But once again, rising oil prices hammered equity prices. Despite crude oil (futures) prices touching $55 per barrel, Friday's session proved strong thanks to good retail sales data. However, Friday's rise in prices did little to curtail the market's week-to-week drop.

BONDS
Rates have fallen across the board - except for the 3-month bill which edged up to 1.74 percent on Friday. While rates rose on Friday, they are down not only this week, but also from two weeks ago. Lately, declines in stock prices have been accompanied by declines in yields as investors park their funds in bonds. Although last week's employment report was anemic, this week's set of economic numbers weren't all that bad. And for the most part, bond investors still believe the Fed will probably raise the fed funds rate target on November 10 by 25 basis points bringing the rate to 2 percent.

Markets at a Glance

Weekly percent change column reflects percent changes for all components except interest rates. Interest rate changes are reflected in simple differences.
The Economy
Strong September sales, but Q3 growth rate still moderates
Retail sales jumped 1.5 percent in September after dipping 0.2 percent in August. A 4.2 percent spurt at motor vehicles & parts dealers helped to boost total spending during the month, in contrast to the 1.3 percent drop in August that helped to dampen that month's total. In July, motor vehicle sales posted a healthy 3 percent hike spurring a 1 percent rise in total retail spending.
Excluding the auto group, retail sales rose 0.6 percent in September, stronger than the 0.2 percent gain recorded in August and the 0.4 percent hike posted in July. Sales at gasoline stations, boosted by higher prices, were not the impetus behind growth (gas station sales inched up a meager 0.1 percent in September). Sales hikes were pretty healthy across the board - with only two exceptions (furniture & home furnishings, sporting goods, hobby, book, & music stores). General merchandise store sales jumped 1.1 percent, building materials stores jumped 1.4 percent, clothing & accessory stores increased 0.8 percent and restaurant sales rose 0.7 percent.
Despite the fairly healthy gains in September, third quarter retail sales grew at a slower rate than in the second quarter (6.6 vs. 5.7 percent annual rate). Excluding autos and gasoline, sales rose at a 4.7 percent rate in the third quarter compared with a 6 percent rate in the second quarter. Undoubtedly, higher gasoline prices are a drag on consumer spending. Indeed, Fed Chairman Alan Greenspan indicated in a speech on Friday that higher crude oil prices have already taken a big bite out of GDP growth - to the tune of three-quarters of one percent.

Readers of this column know we are not fans of consumer confidence surveys as predictors of monthly retail spending. However, consumer attitudes do play a role in their decisions to spend over time. The downward trend in consumer sentiment pretty much follows the path of retail sales since the beginning of the year: consumer confidence has deteriorated and retail sales growth has moderated. The consumer attitude surveys are simply reflections of current events: job growth is lousy; gasoline prices are high and reduce consumer purchasing power on other goods and services. The consumer sentiment index for mid-October showed another sharp drop in the index - to 87.5 from 95.8 in September.

Core PPI jumps
The producer price index inched up 0.1 percent in September, merely reversing the previous month's drop. This matched the June-July offset. Thus, for the past four months, the PPI has remained about unchanged. This has allowed the year-over-year growth in the producer price index to moderate to 3.3 percent in September from a high of 4.7 percent in May. On the whole this is friendly news.
Excluding food and energy prices, the September core PPI rose 0.3 percent; this was the largest gain in four months. Consequently, the year-over-year rise in the core PPI accelerated to 1.9 percent in September, once again matching the June rise, which had been the highest since January 2001.

Among nonenergy, nonfood consumer goods, we've picked a few components that increased more than the rest of the group: car prices (1.1 percent), women's & girls apparel prices (0.6 percent); soaps & synthetic detergents (1.1 percent); household glassware (1.7 percent); sporting & athletic goods (1.3 percent); and mobile home prices (2.6 percent).
Among capital goods, communication & related equipment prices rose 0.7 percent; prices for ships increased 2.5 percent; heavy motor trucks rose 0.6 percent while truck trailers increased 0.7 percent. Light motor trucks (SUVs) inched up a mere 0.2 percent.
Market players and economists like to look at the intermediate and crude price indexes to see whether inflationary pressures are developing in the pipeline. Excluding food and energy prices, the intermediate goods index rose 0.7 percent, less than the previous month's 1 percent hike. The crude goods index (excluding food and energy) fell 2.5 percent, reversing more than half of August's 4.5 percent spurt.

Production moderates further in Q3
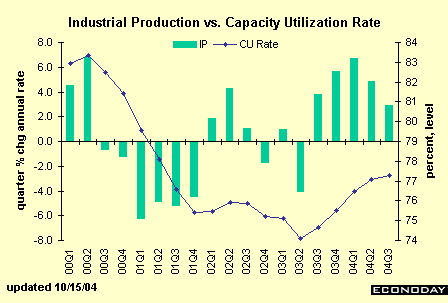
The index of industrial production inched up 0.1 percent in September after dipping 0.1 percent in August. While mining production dropped 2.3 percent during the month, utilities production surged 5.4 percent, pretty much offsetting the declines of the three previous months. Manufacturing production, which comprises the lion's share of the industrial production index, fell 0.3 percent in September. Given the drop in the factory workweek and factory payrolls, this came as no surprise. At least some of the September weakness was due to a reduction in motor vehicle assemblies. Excluding motor vehicles, the production index rose 0.2 percent for the month. High tech industries were primarily responsible for any strength - rising 1 percent in September, faster than in either of the two previous months. Indeed, production in select high tech industries is up 20.8 percent from a year ago. In contrast, motor vehicle production is down 1.2 percent from last September. Total industrial production is 4.6 percent higher than a year ago.
The quarterly path of industrial production growth is not encouraging. This year, growth was strongest in the first quarter and has moderated from a 6.7 percent rate to a 4.9 percent rate to a 2.9 percent rate in the third quarter. The capacity utilization rate had continued to rise through the third quarter, but the pace of gains has moderated. The operating rate is nowhere near levels that would cause inflationary pressures to accelerate rapidly because of supply bottlenecks.
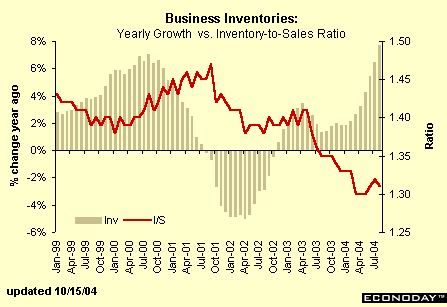
The pace of inventory growth should help to determine whether or not industrial production has more room to quicken in upcoming quarters. Notice in the graph below the sharp year-over-year gains in business inventories over the past few months. Rising inventories at a time of slowing sales should be worrisome. However, notice that the inventory-to-sales ratio has ticked up only a minuscule amount in the past couple of months from the rock bottom level reached in April 2004. With greater inventory controls in place, it is likely this ratio can rise further without indicating excessive inventory growth. This suggests to us, that even the current sales pace can withstand more inventory building in the near term. This bodes well for production in the upcoming quarter.
Trade deficit widens
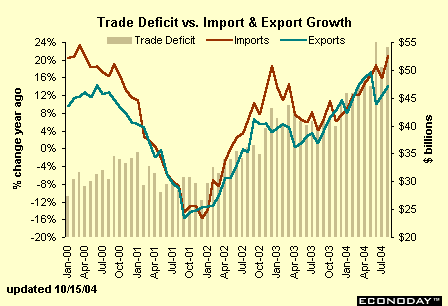
The international trade deficit on goods and services widened sharply again in August to $54 billion after narrowing in July to $50.5 billion. Exports inched up 0.1 percent in August after expanding 3 percent in July. Imports grew 2.5 percent in August, more than reversing August's 1.1 percent drop. Not surprisingly, the bulk of the wider trade deficit was due to a surge in petroleum imports as well as a rise in their cost. We could very well see more red ink in coming months. No doubt, the widening trade deficit will act as a drag on GDP growth in the third quarter.
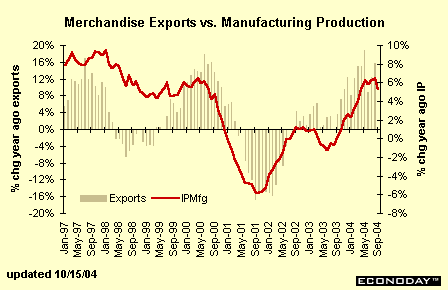
The slowdown in export growth is impacting our production path. Notice that yearly gains in production have moved in tandem with yearly gains in exports. The slower rate of growth in September production may be signaling a drop in exports for September. If export demand improves, manufacturing production will likely pick up steam.
Fiscal year deficit gathers red ink
The U.S. Treasury announced late Thursday afternoon that the fiscal year budget deficit amounted to $412.6 billion for 2004. This was roughly in line with economists' expectations. The budget deficit for the fiscal year reached a new record - accelerating from last year's record deficit. To be fair, one should measure the deficit as a share of GDP to take into account inflation. The fiscal year 2004 deficit edged up to 3.6 percent, from 3.5 percent last year. The all-time high was in fiscal year 1992 when the deficit was 4.8 percent of GDP. But there is no question that the fiscal year deficits of 2003 and 2004 are huge and problematic.
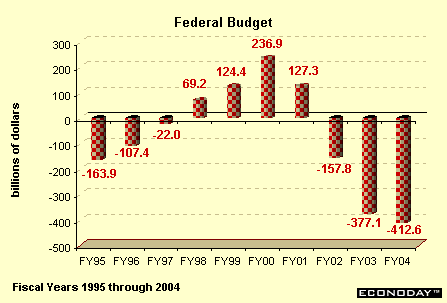
The U.S. Treasury has already increased its borrowing by issuing more Treasury securities this year than last year. For instance, 5-year notes are now issued every month, instead of four times a year. The 10-year note is issued eight times a year, instead quarterly. The Treasury brought back the 3-year note (issued quarterly) and also increased the number of TIPs issues (Treasury Inflation-Protected Securities) that can now be purchased in denominations of 5-year notes, 10-year notes and 20-year bonds. Right now, Treasury securities have acted in their safe-haven capacity and this has allowed yields to remain low. Eventually, the higher quantity of Treasury securities will lead to higher interest rates.
The Bottom Line
Economic news for September was fairly decent - particularly retail sales. However, the quarterly path has deteriorated for both retail spending and industrial production. The international trade deficit widened sharply - and this will also have a detrimental effect on U.S. growth for the third quarter. Consumers are not very optimistic these days - and no wonder with the anemic job market and rising gasoline prices.
Next week is light on economic news. The key economic reports will be released on Tuesday: housing starts and the consumer price index.
Looking Ahead: Week of Oct 18 to Oct 22
Tuesday
The consumer price index edged up 0.1 percent in August, reversing the previous month's drop. Food prices edged up 0.1 percent while energy prices dipped 0.3 percent. Excluding food and energy prices, the CPI rose 0.1 percent in August, matching the gains of the two previous months. Higher gasoline prices could boost the CPI.
CPI Consensus Forecast for Sept 04: 0.2 percent
Range: 0.1 to 0.3 percent
CPI excluding food & energy Consensus Forecast for Sept 04: 0.2 percent
Range: 0.1 to 0.2 percent
Housing starts edged up 0.6 percent in August after recording a 9.4 percent spurt in July. This boosted starts to a 2.0 million unit rate for the month. Low mortgage rates can help starts again in September, but activity might be dampened by hurricane activity in the Southeast.
Housing starts Consensus Forecast for Sept 04: 1.95 million-unit rate
Range: 1.90 to 2.02 million-unit rate
Thursday
New jobless claims rose 15,000 in the week ended October 9 to 352,000 after falling 35,000 in the previous week. The moving average increased to 353,000. According to Labor Department officials, the latest week's rise was not hurricane related; seasonal adjustment is typically difficult this time of year.
Jobless Claims Consensus Forecast for 10/16/04: 345,000 (-7,000)
Range: 340,000 to 362,000
The index of leading indicators fell in August and economists are predicting another drop in September. Among the already reported components, the factory workweek declined; vendor performance decreased; consumer expectations fell and so did the spread between the 10-year note and the funds rate. New jobless claims rose, but rising claims are a negative for the index.
Leading Indicators Consensus Forecast for Sept 04: -0.1 percent
Range: -0.3 to 0.1 percent
The Philadelphia Fed's general business conditions index fell back sharply to 13.4 in September from a level of 28.5 in August. While that still reflects an expanding manufacturing sector, it shows some moderation in the rate of growth.
Philadelphia Fed survey Consensus Forecast for Oct 04: 18
Range: 9 to 24.4


