Simply Economics is taking Thanksgiving weekend off. The next Simply will be on December 3, 2004. Econoday wishes you all a happy holiday weekend.
Recap of US Markets
STOCKS
Stock prices were mostly buffeted by changes in crude oil prices this week, although the announcement that K-Mart would acquire Sears and that the combined retailer would be the third largest in the U.S. helped to boost stock prices for a day. When oil prices declined, stock prices rose - and vice versa. Finally, Friday's comments on the dollar by Fed Chairman Alan Greenspan helped to sink the stock market. Greenspan suggested that the dollar would have to go lower in order for the current account deficit to narrow. Also, he pointed out that foreign investors might need higher investment yields in order to continue to finance our deficit and that it would behoove the U.S. to reduce the budget deficit. (So why hasn't Greenspan commented on the burgeoning deficit before' It has been surging for several years now!)
Actually, a weaker dollar would be good for U.S. companies since import costs would rise and U.S. consumers would be more inclined to purchase domestically produced goods. Furthermore, a weaker dollar would also help our export market.
On the other hand, if the weak dollar promotes a rising interest rate environment, this would be somewhat negative for equities.
All in all, equity investors are somewhat skittish these days since they don't know whether or not economic growth will accelerate or moderate in upcoming months. Stronger economic growth would boost profits.

BONDS
Treasury investors were off kilter this week: the U.S. Treasury had to postpone the regular Tuesday auction of 4-week bills and then also postponed on Thursday the announcement for the 3 & 6 month bill auctions as well as the 2-year note auction. As it turned out, Congress approved an increase in the debt ceiling late Thursday night. Consequently, the 4-week bill was announced - and auctioned - on Friday morning. The 3 & 6 month bill auctions will take place as scheduled on Monday and the 2-year note will be auctioned on Tuesday.
Fed Chairman Alan Greenspan managed to roil the markets on Friday morning with his discussion of the dollar and the current account deficit. While he suggested that demand for the U.S. dollar and securities are in fine shape now, he warned that if we don't start reducing the budget deficit - and the current account deficit - then we will have trouble attracting capital into the U.S. at current yields. Oddly enough, the Fed chairman has not talked about budget deficit problems over the past couple of years. Did he just wake up' The FX value of the dollar plunged on his comments. This also led to a rise in Treasury yields - across the maturity spectrum. On a weekly basis, the 10-year note yield has been roughly unchanged over the past month. However, notice that the 2-year note yield is showing a steady upward trend. This is consistent with the market belief that the Fed will continue to raise the fed funds rate target from the current level of 2 percent.

Markets at a Glance

Weekly percent change column reflects percent changes for all components except interest rates. Interest rate changes are reflected in simple differences.
The Economy
Industrial production recovers
The index of industrial production gained a healthy 0.7 percent in October after posting a slight 0.1 percent gain in September (which merely offset the 0.1 percent drop in August). Major market groups all managed to post robust gains for the month, from 0.5 percent for business equipment to a high of 1 percent for construction supplies. Consumer goods increased 0.6 percent and materials rose 0.9 percent. Consequently, the index of industrial production is up 5.2 percent from last October, a slight improvement from the downward trend of the past several months. The capacity utilization rate also ticked higher to 77.7 percent in October after remaining unchanged in September at 77.3 percent.

Production of motor vehicles and parts jumped 2.3 percent in October after declining 1.3 percent in September. This sector is highly volatile from one month to the next, and underlying trends are better viewed with a 3-month moving average. The chart below shows the 3-month moving average of monthly changes in production of motor vehicles & parts and high tech industries. The high tech sector fluctuates less dramatically. Production in selected high tech industries rose 0.9 percent in September and October, and improvement over two earlier months of less robust gains. Production in this sector has moderated since the summer - notice that monthly gains were significantly stronger in the first half of 2004 (as well as 2003). These two sectors remain key drivers in the economy.

The outlook for production in November is still fairly friendly even though the general business conditions component of the Philadelphia Federal Reserve's business outlook survey fell back to 20.7 in November from a level of 28.5 in October. At the same time, the New York Fed's empire state manufacturing survey inched up to 19.8 from a level of 17.4 in October. Any level above zero means the manufacturing sector is expanding. Just like the industrial production index, these two economic indicators also appeared stronger in the summer. Nonetheless, they remain on a growth track.

Housing rebounds
Housing starts jumped 6.4 percent in October to a 2.03 million unit rate after declining 5.6 percent in September. Starts are 2.2 percent higher than a year ago. Single-family housing starts rose 5.7 percent to a 1.65 million unit rate, not quite recovering the entire 7.7 percent drop posted in the previous month. Single-family housing starts are just 0.1 percent higher than last October. Multi-family construction jumped 9.5 percent in October and stands 12.7 percent higher than a year ago.
According to the Census Bureau, it takes five months to establish a trend in housing activity. The chart below depicts the 5-month moving average of total and single family starts. Notice that housing starts have been virtually unchanged over the past several months after peaking early in 2004.

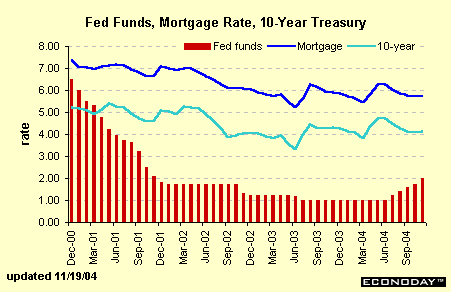
The 30-year fixed mortgage rate averaged 5.72 percent in October, down a bit from 5.76 percent in September. So far in November the rate is up one tenth, averaging 5.73 percent. It has been an unusually stable period! The 30-year mortgage rate is tied to the 10-year Treasury note yield. Historically, Treasury yields are affected by changes in the federal funds rate target. In the past five months, Fed rate hikes haven't appeared to change the direction of Treasury yields. Eventually, factors that are now holding down Treasury yields - safe-haven demand, strong foreign demand, high oil prices - may have less impact and the higher fed funds rate will eventually point to higher rates in the bond market - and mortgage market as well.

The return of inflation'
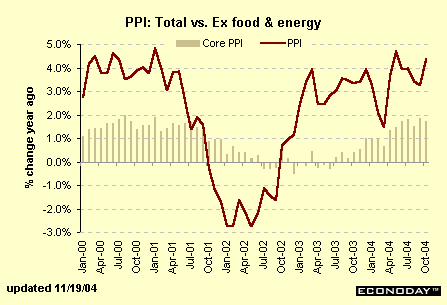
The producer price index jumped 1.7 percent in October shocking economists and market players alike. But the headline number shouldn't have been such a surprise considering that the bulk of the gain was due to higher energy prices (crude oil prices have been skyrocketing for months!) and higher food prices (hurricanes devastated large chunks of Florida where fruits and vegetables were damaged.) Volatility is the major reason why economists separate food and energy prices from core components which move less erratically from one month to the next. Of course higher food and fuel prices should not be discounted - it affects how consumers spend. But hurricane devastation does heal over time. And crude oil prices are declining from the stratospheric levels of a few months ago.
However, it is also important to monitor the core PPI. This rose 0.3 percent in October, matching the September gain. Between March and October, the core PPI posted an average monthly gain of 0.2 percent. In the eight previous months, the average monthly gain was only 0.1 percent. There is no question that the core PPI has accelerated its pace of growth. One can't say that current price levels are dangerously high, however, one never knows at which point inflation psychology sets in. It is inflationary expectations that lead to inflationary price spirals.

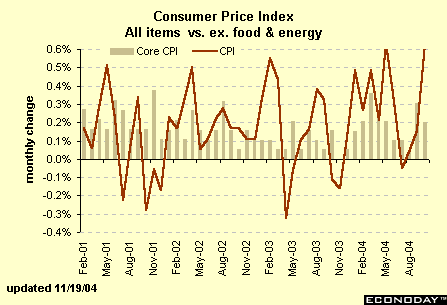
Oddly enough, the bond market rallied on Wednesday when the headline CPI figure revealed a "modest" gain of 0.6 percent, significantly less than the PPI's 1.7 percent hike. For the CPI, a monthly hike of 0.6 percent is high. Bond investors should have been concerned! Moreover, the core CPI (excluding food and energy prices) rose 0.2 percent in October after posting a 0.3 percent hike in September. In July and August, the core CPI posted monthly gains of only 0.1 percent. Notice that the monthly gains in the core CPI are significantly higher in 2004 than they were in 2003.

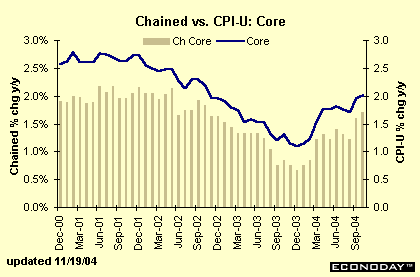
Now, everybody knows that the Federal Reserve doesn't really "believe" that the consumer price index tells us the truth about inflation. It overstates cost-of-living because consumers shift their spending to lower priced items when prices rise. Indeed, the 34.2 percent hike in fresh & dried vegetables in October probably had everyone shift their spending to eggs (-11.1 percent) and shortening & cooking oils (-5.1 percent). All kidding aside, consumers will spend less on items with rapid price gains and spend more on items with price declines or slower price hikes. The chained CPI allows for shifts in consumer spending. Notice that throughout the period depicted in the chart below, the chained CPI for core components increased less on a year-over-year basis than the regular core CPI which measures a fixed basket of goods. The key point, though, is that both measures are accelerating their rate of growth. While the core CPI rose 2 percent, the core chained CPI rose 1.7 percent. Both have accelerated in the past several months. The chained CPI is similar to the market-based PCE deflator that the Fed (particularly its chairman) like to monitor.

The Bottom Line
Economic growth, as measured by industrial production and housing starts, was pretty decent in October. But a more rapid pace of inflation is not considered particularly good news. The spurt in the PPI and the CPI could be attributed to special factors (higher food and energy costs) but the core components of these indexes are also rising more rapidly than they were nine months ago.
Fed officials monitor a slew of economic data and don't base their policy decisions on any one indicator (as much as the market likes to think they do). However, the Fed has to be concerned that inflation, even after taking into account special factors, is now on a rising trend, not on a falling trend. The October inflation figures are one more factor that would incline FOMC members to vote for a rate hike in December - even if they were less inclined to move in December for other reasons. It is not good on credibility grounds for market players to view the Fed as "behind the curve."
Looking Ahead: Week of Nov 22 to Nov 26
Tuesday
Existing home sales rose 3.1 percent in September to a 6.75 million unit rate. Sales have benefited by a continuation of low mortgage rates. Strong October housing starts suggest that existing home sales may have remained strong during the month as well.
Existing home sales Consensus Forecast for Oct 04: 6.80 million unit rate
Range: 6.50 to 6.90 million unit rate
Wednesday
New jobless claims fell 3,000 in the week ended November 13 to 334,000, after rising 5,000 in the previous week. The 4-week moving average inched up to 338,250. Claims appear to have improved lately, but claims are notoriously difficult to adjust for seasonal variation at this time of year.
Jobless Claims Consensus Forecast for 11/20/04: 335,000 (+1,000)
Range: 330,000 to 340,000
New orders for durable goods edged up 0.2 percent in September, boosted primarily by machinery orders and computers & electronic product orders. Primary and fabricated metals as well as electrical equipment and transportation orders fell last month.
Durable goods orders Consensus Forecast for Oct 04: 0.6 percent
Range: -0.5 to +1.0 percent
New home sales increased 3.5 percent in September after gaining 5.8 percent in August. Clearly, this sector has benefited from a low mortgage rate environment. The October housing market could be healthy as well.
New home sales Consensus Forecast for Oct 04: 1,200,000 unit rate
Range: 1,190,000 to 1,235,000 unit rate
The University of Michigan's consumer sentiment index jumped to 95.5 at the early November reading after dropping to 91.7 in October. The early November reading looks good in comparison, but consider that this only brings us back to August levels.
Consumer sentiment index Consensus Forecast for Nov 04: 96
Range: 94 to 97
Looking Ahead: Week of Nov 29 to Dec 3
Tuesday
The Commerce Department's advance estimate revealed that real GDP grew at a 3.7 percent rate in the third quarter and that the GDP deflator increased at a 1.3 percent rate during the period. The advance estimate usually has incomplete information on two pivotal sectors: inventories and net exports.
Real GDP Consensus Forecast for Q3 04: 3.7 percent rate
Range: 3.5 to 3.9 percent rate

