On the whole, the year was a positive one. Although most major stock indexes declined in the first quarter, they managed to post gains in subsequent quarters - with the exception of the Dow Jones Industrials, which declined in the second quarter of the year as well. The Dow rose in the fourth quarter, but was still down for the year as a whole. The Wilshire 5000, which is a comprehensive measure of the market, performed most strongly in 2005, followed by the Russell 2000. At the beginning of the year, analysts had predicted that the small cap market would under perform the large caps this year - but that was not the case. The tech market, represented by the Nasdaq composite were positive, but gained a small amount, nonetheless outperforming the Dow.

The chart below depicts the three key Dow indexes relative to December 1999, just about the time that the bubble was beginning to burst. The Dow Jones Industrial average has not quite yet returned to its pre-bubble bursting glory and remains below the closing level on December 1999. In contrast, the Dow Jones Transportation Average as well as the Dow Jones Utility Average has indeed recovered from 2000 - and surpassed the old high levels. The Transportation Index and the Utility index are more than 40 percent higher than their corresponding 1999 closing values but the Industrial average is 6.7 percent below its 1999 closing value.

Similarly, the S&P 500 has not yet recovered from the highs reached in 1999. However, the S&P Midcap index as well as the S&P Smallcap index are both well above levels reached during the 2000 bubble period. Note that the small cap sector is outperforming both the mid cap and large cap sector and the S&P Smallcap index is nearly 80 percent higher than its 1999 closing value while the S&P 500 is just about 15 percent lower than its 1999 closing value!

Most market indexes peaked in March 2000 and were still above their 1999 closing values in early 2000, but this quickly changed as key market indexes plunged through 2002. In early 2003, stock prices were showing better recoveries relative to their 1999 values. But through 2005, only the Russell 2000 has reached new highs post 2000. The Nasdaq composite, the Wilshire 5000 and the PSE 100 (technology) indexes are still well below 1999 closing levels, with the worst performance by the Nasdaq composite index which closes this year 45.7 percent below 1999 levels.

BONDS
The shape of the yield curve dominated the bond market in 2005 - and certainly became an even larger focus at the end of the year as the curve inverted. The much ballyhooed inversion that is so widely discussed is the spread between the 2-year Treasury and the 10-year Treasury. Basically, we are talking about a very slight "inversion". But then, short rates are supposed to be lower than long rates, so even a flat yield curve is not necessarily desirable. The issue today is that an inverted yield curve often signals recession. But even earlier this year, Federal Reserve chairman Alan Greenspan called it a conundrum when long term yields didn't rise in pace with increases in the federal funds rate target. A Fed study suggests that foreign buyers of U.S. long-term Treasury securities are a major factor behind the low long term yields and that the long end could be 75 basis points higher without this large scale buying by foreign investors and foreign central banks.
Some analysts have also considered the possibility that the lack of inflationary expectations could be behind the relatively low long bond yields. And while every recession was indeed preceded by a yield curve inversion in the past 40 years, not all yield curve inversions have led to a recession, most recently in 1998. While it is certainly possible that the yield curve could be signaling a recession in the next 12 - 18 months, it is also possible that it is simply signaling a growth recession, where economic growth may not decline outright, but simply expand at a slower rate which is less than its potential.

Markets at a Glance

Weekly percent change column reflects percent changes for all components except interest rates. Interest rate changes are reflected in simple differences.
The Economy
CONSUMER CONFIDENCE RISES AT YEAREND
The Conference Board's consumer confidence index jumped several points in December to reach a level of 103.6, its highest since August. Consumer confidence peaked in June this year, and the second half of the year saw a less optimistic consumer than the first half. But then again, remember that gasoline prices were generally rising through the year - and peaked after Hurricane Katrina. On the whole, gasoline prices were higher in 2005 than in 2004, yet, on the whole, consumers were more optimistic in 2005 than in 2004 - suggesting that their job situations were improved even though high gas prices were taking a chunk out of the budget.

The labor market outlook was improved in December as the number of respondents who thought jobs were plentiful increased from November, while the number who thought jobs were hard to get declined from the previous month. Looking at the expectations of business conditions in six months, more respondents felt that conditions would be better or the same, and fewer felt that conditions would be worse. Generally, fewer respondents expect to buy homes, but more expect to buy cars and major appliances. On the whole, the year ended on a good note with respect to consumer confidence. Keep in mind that this could easily change on a moment's notice, but at least consumers were feeling better about economic conditions than worse.
NAPM- CHICAGO
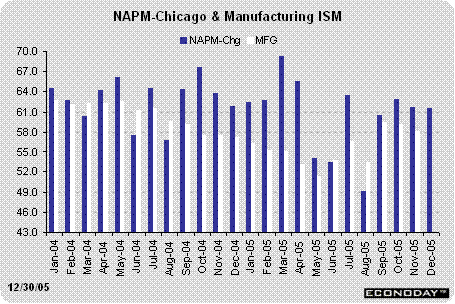
The business barometer from the NAPM-Chicago remained virtually unchanged in December, dipping to 61.5 from November's level of 61.7. This is not very different from last December's level when the business barometer stood at 61.9. Business activity (in the manufacturing and non-manufacturing sectors) appears to be expanding at a healthy pace in the Chicago area. While production decreased modestly to 63.1 from 63.8 in November, new orders jumped five points to 66.7 during the month. Employment picked up as well. The prices paid index decreased to 83.8 from 94.1, but clearly remains at a high level. Market players will be looking at the NAPM-Chicago as a predictor of the ISM manufacturing index, but notice that the ISM often doesn't move by the same magnitude.

EXISTING HOME SALES
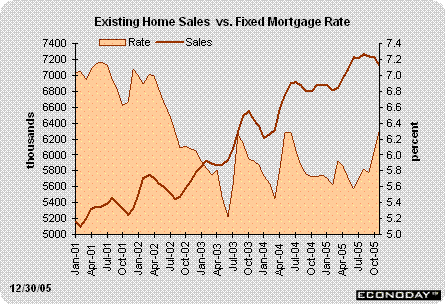
Existing home sales fell 1.7 percent in November after declining 2.7 percent in October. At a 6,970,000 million unit rate, overall sales remain strong, but it does appear that the housing market has peaked. While single family homes are now 0.5 percent below year ago levels, condo sales are up 2 percent from a year ago. Sales fell in all regions of the country, with the largest decline in the West (-3.7 percent) and the smallest drop in the South (-0.7 percent). Given the rise in mortgage rates, it is not surprising to see the moderate drop in sales.

The Bottom Line
Economic news this week was moderately good with consumer confidence posting a healthy rise in December. Home sales fell, but everyone has been expecting the decline for many months. The NAPM-Chicago was healthy and it is viewed as a predictor of the ISM manufacturing survey even though the two don't always move by the same magnitude (or sometimes even in the same direction).
Once again, we begin the new year with a slew of key indicators - including both the manufacturing and non-manufacturing ISM surveys, along with motor vehicle sales and everyone's favorite: the employment situation. The markets could be bustling with activity as vacationing investors return to work.
Looking Ahead: Week of January 2 to 6
Monday
Have a Happy, Healthy and Prosperous New Year!
Tuesday
The ISM manufacturing index declined one point in November to 58.1 from October's level of 59.1. The New York Fed's business outlook survey showed improvement in December, as did the Philadelphia Fed survey.
ISM manufacturing index Consensus Forecast for Dec 05: 57.5
Range: 56.3 to 61.5
Construction spending increased 0.7 percent in October after a downward revised gain of 0.2 percent in September. As housing construction moderates, we could see some smaller gains in the next few months - unless nonresidential construction spending posts robust gains.
Construction spending Consensus Forecast for Nov 05: 0.7 percent
Range: 0.5 to 1.2 percent
Market players will pounce on the minutes of the December FOMC meeting to search for clues about future Fed policy. The majority of market participants expect that the Fed will raise rates at the January 31 meeting, Greenspan's last meeting in his nearly 19 year tenure as chairman. However, market players are less certain about future rate hikes.
Domestic motor vehicle sales jumped 8.8 percent in November to a 12.4 million-unit rate after posting a sharp drop in October. Domestic cars were sold at a 5.3 million-unit rate and light trucks were sold at a 7.1 million-unit rate in November.
Domestic vehicle sales Consensus Forecast for Dec 05: 13.2 million-unit rate
Range: 12.7 to 13.8 million-unit rate
Wednesday
Factory orders increased 2.2 percent in October, boosted by a 3 percent hike in durable goods orders. In November, durable goods orders jumped 4.4 percent and this will certainly help boost totally factory orders for the month as well.
Factory orders Consensus Forecast for Nov 05: 2.4 percent
Range: 0.5 to 2.1 percent
Thursday
New jobless claims inched up 3,000 in the week ended December 24 to 322,000, bringing up the 4-week moving average level to 325,000. On the whole, the average level of claims is up slightly in December over November, although the differences are small.
Jobless Claims Consensus Forecast for 12/31/05: 325,000
Range: 317,000 to 325,000
The business activity index from the ISM non-manufacturing fell 1.5 percentage points in November to 58.5. The level of this index is not quite as high as it was during the summer months, but was a sharp improvement from the September level.
Business activity index Consensus Forecast for Dec 05: 59
Range: 57.2 to 60
Friday
Nonfarm payroll employment jumped 215,000 in November. This represents some rebound after hurricane-restrained employment growth in September, but still shows a sluggish picture over the September to November period. The civilian unemployment rate remained unchanged at 5.0 percent in November.
Nonfarm payrolls Consensus Forecast for Dec 05: 215,000
Range: 130,000 to 250,000
Unemployment rate Consensus Forecast for Dec 05: 5.0 percent
Range: 4.9 to 5.1 percent
Average workweek Consensus Forecast for Dec 05: 33.8 hours
Range: 33.7 to 33.8 hours
Average hourly earnings Consensus Forecast for Dec 05: 0.2 percent
Range: 0.0 to 0.3 percent


