There is no doubt that Monday and Wednesday were good days in the equity market. But the bulk of the week was not so good. Tuesday's sharp market drop was a result of bad earnings by Google and a sharp drop in its price. It is scary to think that one company can have such a large effect on the entire market. Tuesday was also the last trading day of February. The new month began on a positive note with friendly economic data on Wednesday, but this trend could not hold through the week.

Nonetheless, equity prices continue to show gains from year-end levels. The Dow is up 2.8 percent and the S&P 500 3.1 percent. Thus far, these two blue chip indicators are moving in tandem. The Nasdaq composite index is up 4.4 percent from year-end, showing a marginal out performance of the blue chip market. In contrast, the Russell 2000 is up a whopping 9.7 percent from year-end levels.
BONDS
According to bond market pundits, technical factors (hedging mortgage backed securities with Treasury securities) caused Treasury yields to rise on Friday. But yields were already picking up over the course of the week. Notice that yields rose between Tuesday, the last day of February, and Friday. While the yield curve remains decidedly inverted, it was flatter on Friday than a few days ago. This may not mean anything at this point.
Also, bond investors will be anxiously anticipating the 10-year note auction this upcoming week - which happens to take place before, rather than after, the February employment report. Auctions taking place before key events such as an FOMC meeting or the employment report sometimes don't do as well as other auctions.

Markets at a Glance

Weekly percent change column reflects percent changes for all components except interest rates. Interest rate changes are reflected in simple differences.
The Economy
FEBRUARY ISM SURVEYS IMPROVE
The ISM manufacturing index increased two points in February to 56.7, the first monthly rise after three declines. The business activity index from the ISM non-manufacturing survey rose more than three points in February to 60.1. In both surveys, most of the components posted gains from the previous month, which suggests that strength was broadly based. In both surveys, the price component moderated slightly, although it remains well above 60 - and that says price pressures are still with us.

And while the new orders, production and employment indexes were showing improvement, the supplier delivery index fell back. In the manufacturing and non-manufacturing sectors, suppliers delivered shipments more quickly, which tends to happen when business activity is slowing down. Typically, when economic activity is strengthening, supplier deliveries will slow because producers are extremely busy and it takes more time to meet orders and shipment demand. Incidentally, the manufacturing supplier delivery index is one of components of the index of leading indicators. Personally, I am not a big fan of the leading indicators index, but leading indicators are valuable. The slowdown in supplier deliveries should be monitored in coming months to see whether or not this new trend will continue or is a short-term phenomenon. The non-manufacturing figures are not adjusted for seasonal variation and thus must be interpreted more cautiously, but the seasonally adjusted supplier delivery index for the manufacturing ISM is depicted below.

FOURTH QUARTER GDP REVISED UP
The Commerce Department revised up its advance estimate for fourth quarter GDP from a 1.1 percent rate to a 1.6 percent rate, which was in line with economists' initial estimate for growth. Final sales were revised up to show no growth, rather than a slight drop. Personal consumption expenditures grew at a 1.2 percent rate, not significantly different from the initial estimate (data from the consumer sector are the most widely available and tend to show smaller revisions than other GDP components.) Consumer spending was hampered in the fourth quarter from a plunge in durable goods spending (mainly motor vehicles). Expenditures on nondurable goods (+5.1 percent rate) and services (+3.0 percent rate) posted healthy gains.
Business fixed investment grew at a 5.4 percent rate in the fourth quarter, with upward revisions in both structures and equipment & software. In contrast, residential investment spending was revised down slightly to a 2.6 percent rate. Inventory accumulation was slightly stronger in the fourth quarter than initially estimated. This is a key factor in helping economists predict first and second quarter GDP growth. If inventory investment expands too fast, then producers will want to curtail production to unload these undesired inventories. Though never be sure if inventory investment is desired or not, one can try to assess the situation by coupling inventory growth trends with final sales growth. As it turns out, final sales were flat in the fourth quarter, which would not necessarily bode well if one wanted to predict future growth. However, given that the bulk of the weakness stemmed from a sharp plunge in motor vehicle sales, the final sales figures appear less dire. Also, inventory growth was negative in the second and third quarters of 2005. The fourth quarter rebound doesn't necessarily point to a rapid accumulation of undesired inventories.

While real GDP grew somewhat faster than initially estimated, the GDP deflator also was revised higher, to show a 3.3 percent pace (up from a 3.0 percent rate). This stemmed from increased prices outside the consumer sector: the core PCE deflator rose at a 2.1 percent rate (down from a 2.2 percent initial estimate).
The upward revision to fourth quarter growth allows economists to revise up their forecasts for first quarter growth. Immediately following the advance release, some economists went as far as predicting 5 percent growth in the first quarter. Certainly, the sharp gain in personal consumption expenditures in January sets the stage for an improvement in this sector that accounts for the lion's share of GDP. It does appear that residential investment will be hampered as housing activity moderates, but there is room for growth in business fixed investment. The February 2006 survey of economists by the National Association of Business Economics showed a 4.5 percent growth rate for the first quarter.
JANUARY CONSUMPTION & INCOME ACCELERATE
Personal income advanced 0.7 percent in January, the fastest monthly growth rate since September when figures were affected by Katrina. Wages & salaries, which are the bulk of personal income, also posted a 0.7 percent hike, and this was the largest monthly gain since July. But the income growth was not sufficient to get the saving rate out of the red! Personal consumption expenditures grew 0.9 percent in January, faster than disposable income (+0.5 percent) and the personal saving rate stood at -0.7 percent, getting deeper in the red from previous months. It is not unusual to see deterioration in savings in months that have strong gains in durable goods spending (+1.3 percent). And indeed, January was one of those months. But spending on nondurable goods jumped even more (+2.3 percent).

For a while, in the period immediately following the stock market crash in 2000, monthly consumer spending rose a bit less than income. And while the personal saving rate didn't improve dramatically, at least it didn't worsen. But consumers learned to take wealth out of their appreciating homes and once again, consumer spending outgrew income. It is fair to say that the personal saving rate derived from the income and outlays figures does not adequately measure savings. However, other savings measures have also shown deterioration. And it is the sharp downward trend that matters most.
Everyone is counting on the consumer sector to keep the economy rolling. Should consumers decide to start spending within their means - and they won't be able to use their homes as cash machines if housing stops appreciating - it would mean a slowdown in economic activity.
FEBRUARY MOTOR VEHICLE SALES PLUNGE
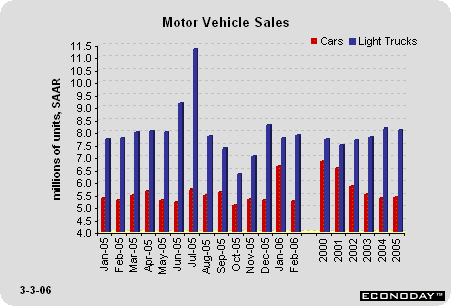
Domestic autos fell to a 5.4 million-unit rate in February from a 6.5 million-unit rate in January. At the same time, light truck sales inched up to a 7.8 million-unit rate in February from a 7.6 million-unit rate in January. This selling pace is nearly identical to a year ago when cars were sold at a 5.3 million-unit rate and light trucks were sold at a 7.7 million-unit rate. Last month's spurt in auto sales was due to lease sales and did not reflect consumers' desires to buy vehicles with better gas mileage. Light trucks accounted for 60 percent of the new vehicles purchased. When gasoline prices were at their highest, from August to November, light truck sales accounted for 56.9 percent of new purchases. In the first seven months of 2005, when gas prices were rising, but not yet at their peak, light trucks accounted for 61 percent of new purchases.

Among the larger manufacturers', GM and Toyota saw the largest monthly and yearly declines for cars. GM light truck sales were higher than last month and last year, but Ford and Chrysler saw a drop in their sales from a year earlier. Among the big three foreign makers (Nissan, Toyota and Honda), only Nissan saw a drop in year-over-year light truck sales in February.
FEBRUARY CONFIDENCE DATA AT ODDS'
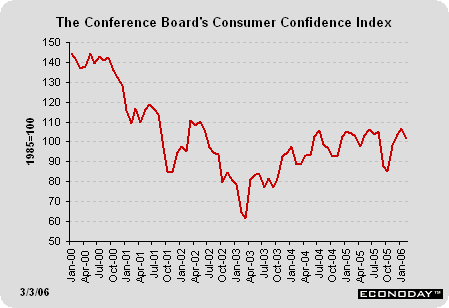
The Conference Board's consumer confidence index fell several points to 101.7 in February after peaking recently in January at 106.8. The present conditions index actually increased to 129.3 from 128.8. The detailed responses for business conditions and employment were pretty good. For today. But consumers are feeling less confident about the next six months, or so they said when asked about business conditions, employment and income. As a result, the expectations index dropped nearly 9 percentage points to 83.3.
Oddly enough, when consumers were asked to assess their buying plans for the next six months, a greater percentage than in January planned to purchase a vehicle and a home (the latter the highest in several months), although a smaller percentage planned to purchase major appliances. But even that question revealed that a larger percentage planned to purchase major appliances this year than a year ago. Yet, the expectations index was much higher a year ago (at 96.1) than today.
There seems to be a disconnect in the numbers. Consumers are still planning to buy stuff, but somehow they feel the economy is not going to be as performing as well as it is today. If consumers were truly worried about employment and income, wouldn't you think that they would be planning to spend less money on large ticket items such as homes, motor vehicles and appliances' Another conundrum.

HOME SALES PLUNGE IN JANUARY DESPITE WARM WEATHER
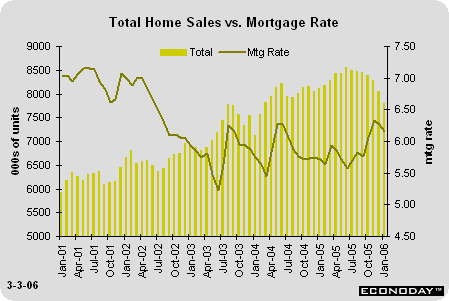
Existing home sales fell 2.8 percent in January to a 6,560,000-unit rate and new home sales dropped 5 percent to a 1,233,000-unit rate. While economists have generally been expecting home sales to decrease in coming months, the surge in housing starts, ascribed to unseasonably warm weather for the month of January, suggested that home sales should also spurt. Instead, sales fell. It is certainly possible that the seasonal component for housing starts is much stronger than it is for sales in the month of January. After all, one can still go shopping even if builders are sidelined with bad weather. The drop in January sales appears even more dramatic when looking at the trend of the past few months. Sales peaked in June and have been softening ever since.
New home sales only cover single-family units. In contrast, existing home sales include the frenzied co-op and condo market - and these posted a sharp 10.6 percent drop in January. If much of the speculation is taking place in this market, it is possible that the drop in home sales is due to less speculative buying. The market for real buyers, that is, homeowners who intend to live in a home rather than flip it within a short period, might not be deteriorating as rapidly.
Despite the drop in sales, the average price of a new home rose 3.5 percent in January with the average price of a resale unchanged. In both cases, average prices are still quite a bit higher than a year ago. House prices are not likely to depreciate rapidly, even in a less robust market.

The Bottom Line
Earlier in the month, strong retail sales and housing starts led investors to believe that all January data would be robust. In fact, activity proved mixed. Home sales fell in January even though many believed sales would get the same seasonal adjustment boost as housing starts. That was not the case, and the trend in home sales is decidedly lower. Personal consumption expenditures for January were healthy, but this mirrors the retail sales results. Some of the February figures are mixed as well. Motor vehicle sales plunged, but January data had included lease purchases, which are bulky from time to time. The ISM survey showed improvement in the non-manufacturing sector after three months of moderation. The Conference Board's consumer confidence index dipped on expectations that business activity would worsen in the next six months, although current conditions were favorable. None of this should be totally unexpected.
The Federal Reserve began to raise the federal funds rate target in June 2004. That is roughly 18 months ago. Conventional wisdom suggests that the impact of a Fed rate move (up or down) can take as long as 18 months to develop. Undoubtedly, the initial rate hikes by the Fed were not very meaningful: after all, we were starting from a 1 percent rate. But the cumulative effect of Fed rate hikes was bound to be felt on the economy at some point or other. The current target rate now stands at 4.50 percent and is 350 basis points higher than it was slightly more than 18 months ago. Long-term rates have not increased by 350 basis points - or mortgage rates would be much higher (and housing activity much lower) than they are today. But consumer borrowing is affected by the prime rate (home equity loans and credit card loans are tied to it) which now stands at 7.5 percent. It is more costly for consumers to borrow and spend.
Though only a few key indicators will be reported this upcoming week, there is no doubt that the February employment report will be anxiously awaited.
Looking Ahead: Week of March 6 to March 10
Monday
Factory orders increased 1.1 percent in December, but look for a sharp reversal in January. Durable goods orders plunged 10.2 percent during the month, primarily due to plummeting aircraft orders. Even if nondurable goods orders rise at the average 0.4 percent pace of the past three months, it won't due much to help total new orders.
Factory orders Consensus Forecast for Jan 06: -5.4 percent
Range: -7.5 to -4.5 percent
Tuesday
The Labor Department initially estimated that nonfarm productivity fell at a 0.6 percent rate in the fourth quarter, after growing at a 4.5 percent rate in the third quarter. This estimate could be revised up since the Commerce Department reported that real GDP grew at a 1.6 percent rate in the fourth quarter rather than at a 1.1 percent rate as first reported.
Nonfarm productivity Consensus Forecast for Q4 05: -0.1 percent rate
Range: -0.6 to 0.0 percent rate
Unit labor costs Consensus Forecast for Q4 05: 3.0 percent rate
Range: 2.8 to 3.5 percent rate
Consumer installment credit increased $3.3 billion in December spurred by a gain in motor vehicle sales. Vehicle sales remained rather healthy in January and this could help boost credit growth for the month.
Consumer credit Consensus Forecast for Jan 06: $5 billion
Range: $4 to $7.5 billion
Thursday
New jobless claims rose 15,000 in the week ended February 25 to 294,000, bringing the 4-week moving average up to 287,250. This week included a holiday - making the figures more difficult to adjust for seasonal variation. The upcoming week will neither include a holiday nor a blizzard, so we may be back on track on the seasonal mechanism.
Jobless Claims Consensus Forecast for 3/4/06: 295,000
Range: 275,000 to 310,000
The international trade deficit on goods and services widened in December showing a $65.7 billion shortfall after narrowing slightly in November. Exports increased 2.1 percent in December while imports increased 1.9 percent during the month.
International trade balance Consensus Forecast for Jan 06: $-66.5 billion
Range: $-64 to $-68 billion
Friday
Nonfarm payroll employment increased 193,000 in January. This was an improvement over the December gain. Since the East Coast blizzard hit after the employment week (which includes the 13th of the month), it is unlikely that employment figures were affected by the snowstorm. The civilian unemployment rate fell to 4.7 percent in January and could represent a tight labor market, but chances are that increased labor demand would be accompanied by faster labor force growth. Nonetheless, Fed officials may still be concerned over the jobless rate.
Nonfarm payrolls Consensus Forecast for Feb 06: 220,000
Range: 105,000 to 300,000
Unemployment rate Consensus Forecast for Feb 06: 4.7 percent
Range: 4.6 to 4.8 percent
Average workweek Consensus Forecast for Feb 06: 33.8 hours
Range: 33.7 to 33.8 hours
Average hourly earnings Consensus Forecast for Feb 06: 0.3 percent
Range: 0.2 to 0.4 percent
The U.S. Treasury will release the monthly budget report for February, which typically shows a deficit for the month. Over the past 10 years, the average deficit has amounted to $65 billion in February. In the past three years, however, deficits have been much larger - averaging $102 billion.
Treasury budget Consensus Forecast for Feb 06: $-115 billion
Range: $-120 to $-105 billion


