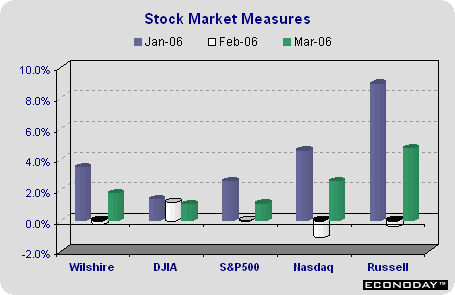
For the fifth straight time, equity prices mostly fell on the month's final trading day - even if most of the month prices were trending higher. For the most part, March gains were smaller than January gains, but certainly an improvement over February activity which was mostly weaker. Equity investors are generally happy to see friendly economic data because that tends to generate better profit margins. But strong economic news also can mean that the Fed is more concerned about the potential for inflationary pressures. So investors sometimes trade up on stronger economic growth, and sometimes trade down because it raises the chance of further rate hikes by the Fed.
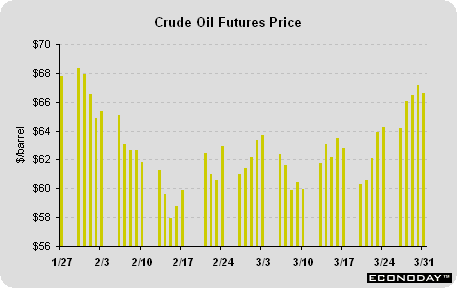
In addition to Fed rate hikes, equity investors are also worried about oil. Oil prices did indeed run up again in March after some moderation last month. Gold prices also skyrocketed over the course of the month as did silver prices. While some analysts believe that gold and silver prices are rising because of heavy demand, others believe that higher gold prices are due to inflation worries. Gold and silver ETFs (exchange traded funds) have been created and some believe these instruments will lead to increased demand and prices for these commodities. Perhaps it will lead to a speculative bubble in these commodities. It is certainly worth monitoring.
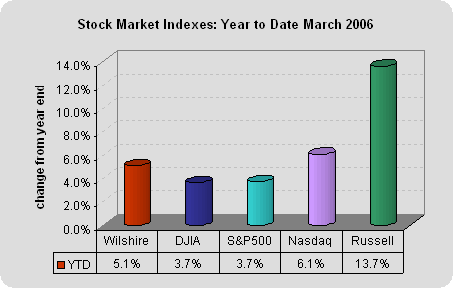
After all is said and done, equity prices posted healthy gains in the first three months of the year. The Dow is up 3.7 percent, matching the S&P 500. The Wilshire 5000, which encompasses the entire U.S. market, is up 5.1 percent. The Nasdaq composite is up 6.1 percent, gaining strength in the past couple of weeks after trailing the Dow for a while this year. The small cap sector is outperforming the rest of the market by a wide margin with the Russell 2000 up 13.7 percent from year-end levels.
BONDS
As widely anticipated, the Federal Reserve increased the fed funds rate target by 25 basis points on March 28 to 4.75 percent. The post-FOMC meeting statement disappointed bond investors, not because it was so different from the January 31 statement, but because it was so similar. In both cases, the statement ended with the following paragraph:
"The Committee judges that some further policy firming may be needed to keep the risks to the attainment of both sustainable economic growth and price stability roughly in balance. In any event, the Committee will respond to changes in economic prospects as needed to foster these objectives."
Since "some further policy firming may be needed" was kept in the statement, it suggests that the Fed has not ended its rate raising cycle. In reality, anything can happen between now and May 10 that could cause the Fed to change its mind - and stop raising rates. Most likely, the Fed will see that inflationary pressures are not moderating sufficiently and they will raise the fed funds rate target to 5 percent. But most economists and market players had already predicted a rate hike in May even before the March 28 announcement. So what has changed' It's a simple case of getting what you expected, but being disappointed anyway.
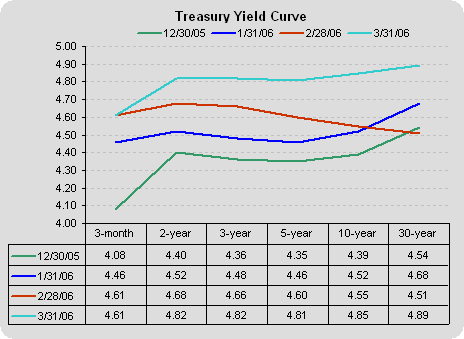
One can certainly still call the yield curve flat - notice the closing yields for the 2-year, 3-year and 5-year notes on Friday. But at least the long end has picked up a bit, and the shape of the curve is slightly sloping upwards. Indeed, the biggest change in yields between February and March were at the long end of the curve.
Markets at a Glance
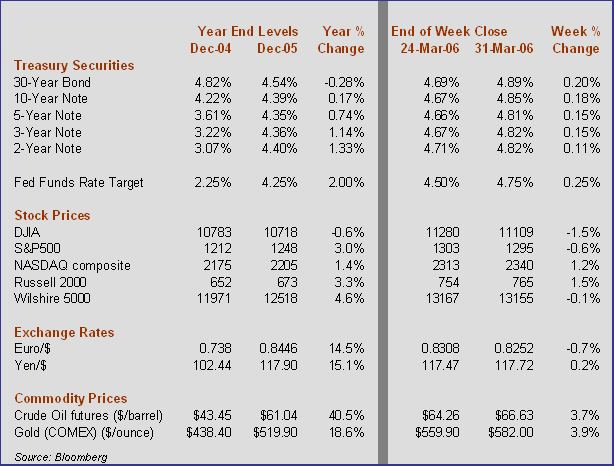
Weekly percent change column reflects percent changes for all components except interest rates. Interest rate changes are reflected in simple differences.
The Economy
INCOME, SPENDING, AND SAVING
Personal income increased 0.3 percent in February, less than January's 0.7 percent hike. The slowdown was across the board as wages and salary growth moderated, proprietors' income moderated and income receipts on assets such as dividend and interest income moderated. But the largest slowdown came in transfer payments. Cost-of-living adjustments are made in January, which tends to boost January income growth on the whole. February comes back to reality.
Personal consumption expenditures inched up 0.1 percent due entirely to a 0.9 percent gain on consumer services spending. Nondurable goods expenditures fell 0.6 percent and durable goods spending dropped 1.9 percent in February.
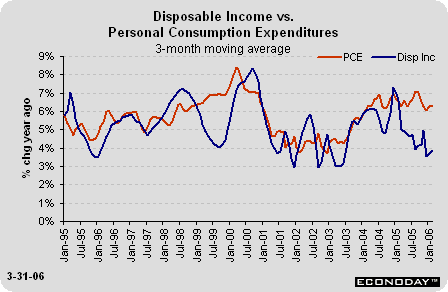
Since monthly changes are typically impacted by special factors - and there could be any number affecting data - it is often more useful to look at the path of year-over-year growth in spending and income. And this picture speaks volumes. We compare growth in disposable income (which is personal income less taxes) to growth in consumer spending; taking a 3-month moving average of the growth rates smooths both. The downward trend in the personal saving rate has been well documented. But given the problems with measurement in this variable, I would rather simply look at spending and income growth - and the gap between them. Notice the widening gap between consumption and income that developed in 2005 and continued in the first two months of 2006.
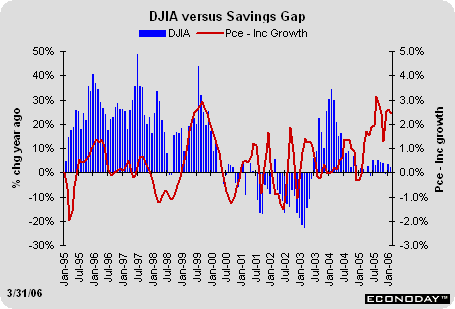
We have certainly seen that before. In 1999, when the stock market was percolating, consumers were willing to spend more than they earned based on their improved wealth position. The chart below compares the year-over-year growth in the Dow Jones Industrial Average to the savings gap (defined as spending growth less income growth). Notice that consumers were indeed more willing to increase their spending relative to their earnings when the stock market was accelerating. In 2005 though, the stock market did not accelerate rapidly. But consumers had another place to go to finance their spending.
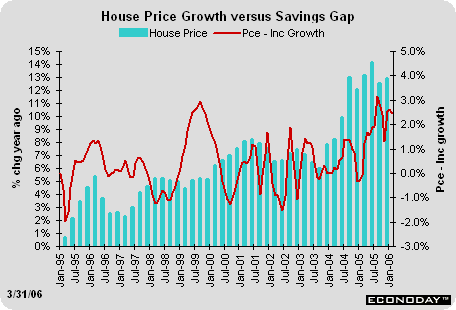
The home price appreciation of the last two years has played a major role in homeowner refinancing and has offered a spendable source of consumer wealth. Just like the 1999 stock market caused consumers to spend their wealth, so did the 2005 housing market boom. Notice that the (2000 stock market) crash did cause consumers to rethink their daily budgeting and created a reversal in spending patterns as consumers were once again more likely to spend within their income. It is not likely that housing prices will crash in the same way as the stock market because the liquidity simply isn't there. However, a moderation in housing appreciation in the upcoming year will give consumers time to rethink their wealth positions - and whether or not they wish to spend more than they earn. The trends over the past 10 years suggest that consumers do tend to revert back to spending within their means when the wealth stops growing.
PCE DEFLATOR MODERATES
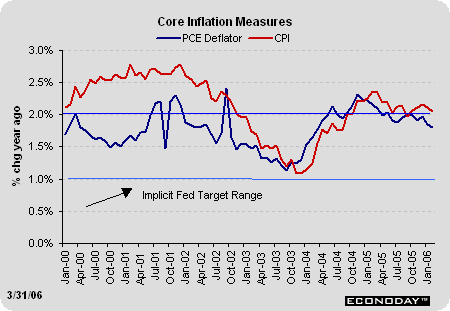
The PCE deflator was unchanged in February, while the PCE deflator excluding food and energy prices inched up 0.1 percent for the month. On a year-over-year basis, the total PCE deflator was 2.9 percent higher than a year ago, but the core PCE deflator was 1.8 percent higher than last February. In the past few months, year-over-year changes in the core PCE deflator have remained in a tight range near 2 percent, although they are down from the near term peak of 2.3 percent registered in November 2004. The Greenspan Fed preferred the PCE deflator to the CPI because the CPI is a fixed basket of goods and doesn't allow for substitution to lower priced goods. In contrast, the PCE deflator reflects current purchases. It remains to be seen whether or not the Bernanke Fed will stick to the PCE deflator as their primary inflation guide or revert back to the CPI, which is reported about two weeks earlier in the month. Notice that the gap between the CPI and the PCE deflator was much wider between 2000 and mid-2002 than it is today. Indeed, the two series are quite similar in their monthly movements as well as their levels. The core CPI was 2.1 percent higher than last February, a 0.3 percentage point difference from the PCE deflator. Since the Bureau of Economic Analysis uses prices from the CPI to incorporate in the PCE deflator, it is not surprising that the two are moving in tandem. However, the difference between these two measures reflects the composition of goods and services that consumers are currently purchasing relative to the fixed basket measured by the CPI.
Whichever is used by the Bernanke Fed, inflation by either measure is at the top end of the Fed's implicit target range. I'm calling the 1 - 2 percent range implicit because several Fed officials have cited it as their preferred range, though there is no formal range since the Fed is not following an inflation-target yet. Market players were quite disappointed that the FOMC statement did not offer an end date to the rate hikes. But we all know that Fed officials are monitoring these inflation measures - and we know what inflation is doing. How could the Fed have announced an end date to fed funds rate hikes when the inflation rate is still at the upper end of their preferred range'
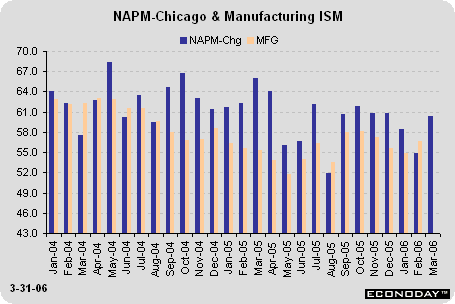
NAPM-CHICAGO IMPROVES, WILL THE ISM SURVEYS'
The business barometer from the NAPM-Chicago survey increased more than five percentage points in March to 60.4, the highest level in three months. Increases were healthy across the board with gains in production, new orders, order backlog, supplier deliveries and even employment. The Chicago index incorporates both manufacturing and non-manufacturing activity, but is still considered a leading indicator for the ISM manufacturing index. Keep in mind that the Chicago business barometer is more volatile than the ISM manufacturing index, but the two have moved in the same direction over the past few months (although not in February when the ISM index improved and the Chicago index declined).
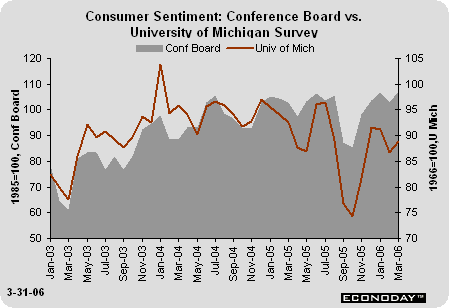
CONSUMER ATTITUDES IMPROVE-AT LEAST FOR NOW
Both the Conference Board's consumer confidence index and the University of Michigan's consumer sentiment index increased in March after dipping slightly in February. But even the Conference Board's spokesperson suggested that the rise in the consumer confidence index is not as good as it seems. The index measures the present situation and expectations. The present situation index is strong, but the expectations index is not. In fact, the expectations index is below year ago levels. Now, it is true that expectations can change if economic conditions improve. However, with rising interest rates, borrowing will become more costly - and this is a negative for consumers who are financing their expenditures with their home mortgages, equity lines of credit and credit cards. Also, oil prices - and gas pump prices - have been on the rise again. Should the increases continue into the heavier driving season, consumer attitudes may become less bright in coming months.
STRONG PROFITS DON'T MOVE STOCK PRICES
The Commerce Department's second revision to fourth quarter GDP revealed a 1.7 percent growth rate with a 0.2 percent drop in real final sales. Changes to the GDP components were minor relative to last month's estimate. The Commerce Department did report fourth quarter corporate profits for the first time. After tax profits increased 11.7 percent from the third quarter and are up a whopping 38.7 percent from year ago levels. Over the past year, profit gains have been healthy, particularly after a slower growth period in 2004. Interestingly enough, stock prices have not increased commensurately with profit growth. Profits have posted year-over-year gains for 15 straight quarters, but the same cannot be said for the equity market, although 2006 is beginning on a relatively healthy note since stock prices are up on the year - and the quarter.

The Bottom Line
Investors were unhappy with the post-FOMC meeting statement which left the door open for the Fed to raise rates, or not, in coming months depending on the strength of the economy and the inflation path. However, equity and bond investors felt that the statement was hawkish. Of course, current inflation news shows improvement, measured by either the CPI or the PCE deflator, but inflation is still on the high side for the Fed preferences. Fed watchers are now expecting a 25 basis points rate hike at the May meeting that would bring the funds rate target to 5 percent. Some are also looking ahead to a 25 basis point hike in June as well.
The week ahead is bar belled with respect to indicators - with key ones on Monday (ISM survey) and Friday (employment). Since inflation and tight labor markets are major worries, the employment report may generate even more anxiety than usual, if that's possible.
Looking Ahead: Week of April 3 to April 7
Monday
The ISM manufacturing index increased 1.9 points in February to 56.7 from January's level. The New York Fed's business outlook survey jumped in March, but the Philadelphia Fed survey fell moderately during the month. These two Fed surveys are considered leading indicators for the ISM survey.
ISM manufacturing index Consensus Forecast for Mar 06: 57.5
Range: 55 to 60
Construction spending inched up 0.2 percent in January after rising 1 percent in December. February construction could be down sharply based on the large drop in housing starts during the month.
Construction spending Consensus Forecast for Feb 06: 0.5 percent
Range: -0.3 to 1.0 percent
Domestic motor vehicle sales decreased 9 percent in February to a 13.1 million-unit rate after increasing nearly 6 percent in December. Domestic cars were sold at a 5.2 million-unit rate and light trucks were sold at a 7.9 million-unit rate in February.
Domestic vehicle sales Consensus Forecast for Mar 06: 13.4 million-unit rate
Range: 13.1 to 13.5 million-unit rate
Wednesday
The business activity index from the ISM non-manufacturing increased more than 3 percentage points in February to 60.1. While the index level is not exceptionally high, it still reflects expanding business activity.
Business activity index Consensus Forecast for Mar 06: 59
Range: 57.5 to 61
Thursday
New jobless claims fell 10,000 in the week ended March 25 to 302,000, bringing the 4-week moving average down to 310,750. This was the second straight weekly drop in claims. In contrast to the declines in December and January, claims have risen back over the 300,000 mark in February and March.
Jobless Claims Consensus Forecast for 4/1/06: 305,000
Range: 300,000 to 310,000
Friday
Nonfarm payroll employment increased 243,000 in February. This was an improvement over the December and January gains. The civilian unemployment rate inched up to 4.8 percent in February but remains at historically low levels. Fed officials are concerned that the jobless rate is reflecting tight labor markets, which could set the stage for rapidly accelerating wage gains.
Nonfarm payrolls Consensus Forecast for Mar 06: 185,000
Range: 150,000 to 250,000
Unemployment rate Consensus Forecast for Mar 06: 4.8 percent
Range: 4.7 to 4.8 percent
Average workweek Consensus Forecast for Mar 06: 33.8 hours
Range: 33.8 to 33.8 hours
Average hourly earnings Consensus Forecast for Mar 06: 0.3 percent
Range: 0.2 to 0.5 percent
Consumer installment credit increased $3.9 billion in January despite robust retail sales. Vehicle sales declined in February, as did non-auto retail sales, and this could hamper credit growth for the month.
Consumer credit Consensus Forecast for Feb 06: $4 billion
Range: $1.5 to $5.1 billion

