A strong economy is generally good for the stock market because it helps to generate healthy profits. Unfortunately, the flip side of a healthy economy bodes poorly for the bond market - where rising interest rates can quell improvement in equities. The healthy employment situation in March suggests that economic activity was healthy, but it also points to a tighter labor market and rising pressures on wages and inflation.
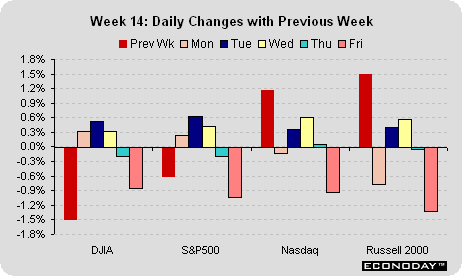
Even though stocks fell sharply on Friday, the rest of the week had been good for the market. Only the Russell 2000 posted any significant drop in the week. The Dow is up 3.8 percent on the year, matching the S&P 500. The Wilshire 5000, which encompasses the entire U.S. market, is up 5 percent. The Nasdaq composite is up 6.1 percent, gaining strength in the past few weeks after trailing the Dow earlier this year. The small cap sector is outperforming the rest of the market by a wide margin with the Russell 2000 up 12.8 percent from year-end levels despite the latest week's drop.
BONDS
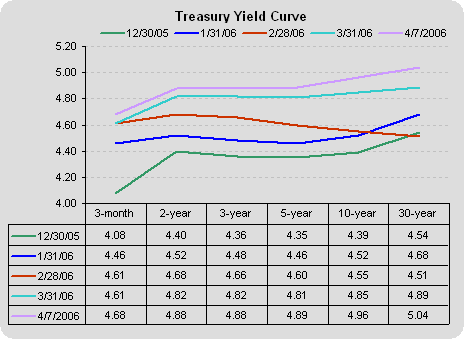
The employment report was good news for the economy - and that almost always translates into bad news for the bond market. The jobless rate is under 5 percent and based on a recent Fed study showing that labor force growth is not likely to accelerate in the near term, the labor market can be considered tight. Tight labor markets cause Fed officials to worry about wage and inflation pressures. This confirms the current view that the Fed will raise the fed funds rate target by 25 basis points in May to 5 percent. The jury is still out on another rate hike in June, but I wouldn't be surprised if market players are leaning that way.
The yield curve is still relatively flat - but the long end has picked up a bit, and the shape of the curve is slightly sloping upwards. We haven't seen a 5 percent handle on the 30-year bond since September 2004.
Markets at a Glance
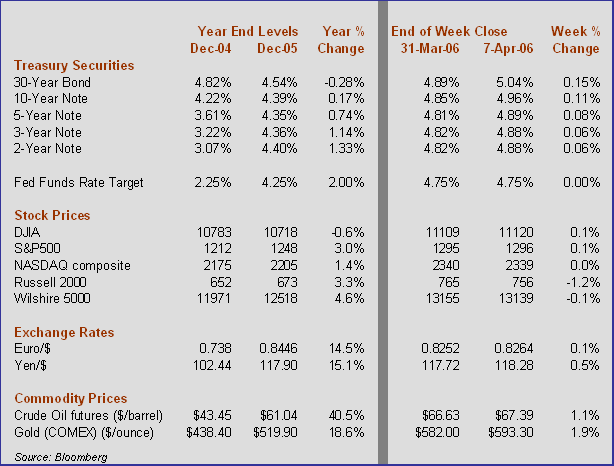
Weekly percent change column reflects percent changes for all components except interest rates. Interest rate changes are reflected in simple differences.
The Economy
PAYROLLS POST HEALTHY GAIN; JOBLESS RATE DIPS
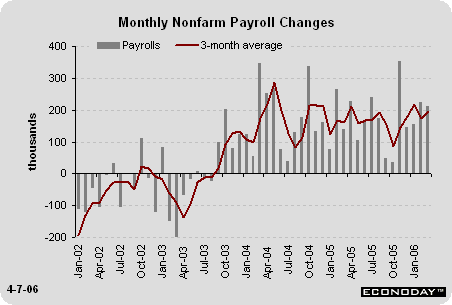
Nonfarm payrolls increased 211,000 in March after downward revised gains of 225,000 in February and 154,000 in January. Even with the downward revision to previous months' figures, the overall trend in payroll growth is decent these days running at roughly 200,000 over the past three months. Of course, the manufacturing sector continues to show less-than-stellar strength with a second straight monthly payroll decline. Construction employment moderated significantly in March, but considering the strong gains posted in January and February, one should consider the three-month growth rate. An average pace of 29,000 workers were added to construction payrolls in the first quarter of 2006, compared with an average increase of 30,000 in the fourth quarter. In 2005, construction payrolls averaged monthly gains of 25,000 per month. With a slowdown in housing projected for 2006, average growth in construction payrolls should moderate in coming months, but not necessarily to the March pace. The service sector posted healthy gains, rising 202,000 in March, on par with February's 194,000 gain. Increases were moderately healthy across the board with even retail trade payrolls posting some growth after a more anemic showing in December and January.
The civilian unemployment rate edged down to 4.7 percent in March from 4.8 percent in February. The jobless rate has hovered in a tight range under 5 percent over the past six months. To a large extent, the drop in the jobless rate is due to sluggish labor force growth. Indeed, the labor force actually declined in December and January. In February and March, however, labor force growth accelerated and a spurt in employment led the drop in the jobless rate. Notice that the employment-to-population ratio increased to 63 percent in March - rising to its highest level since September 2002. Keep in mind though, that the jobless rate was much higher in 2002 when the employment-to-population ratio stood at the same level. When the jobless rate was running between 4.5 and 5 percent in 2001, the employment-to-population ratio was running 63 to 64 percent. While labor market conditions have certainly improved over the past year, we have not recovered from the better employment levels seen in 2001 - when the economy was actually in recession.
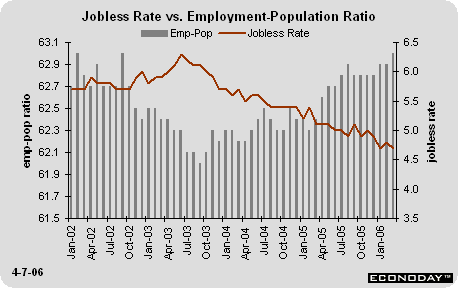
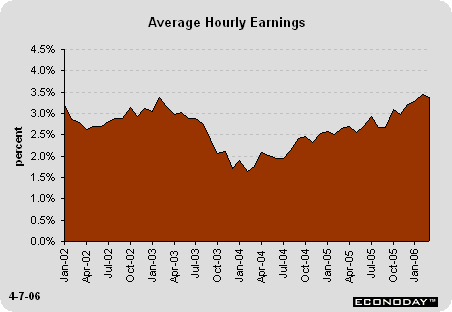
Although labor market conditions aren't as good as they were back then, they are considered tight for now. (See the Short Take entitled "Labor Force Participation and the Unemployment Rate" published on April 5, 2006) A recent Fed study suggests that labor force participation is on a steady long-term structural decline in the U.S. and we won't see the higher participation rates of 5 years ago. This means that even though the employment-to-population ratio is not as strong as it used to be, the jobless rate is still indicating tight labor markets, which could eventually lead to wage pressures. Average hourly earnings increased 0.2 percent in March and are 3.4 percent higher than a year ago. This is a slight dip from the February pace, but it is obvious that hourly earnings have accelerated from their lows in January 2004 when the unemployment rate was roughly one percentage point higher. Given that productivity growth has been healthy over the last year, one can't assume that the current pace will cause inflationary pressures to accelerate. However, a case can be made that hourly earnings could accelerate more rapidly as labor market conditions remain tight. This is indeed what the Fed is concerned about these days. In the past two FOMC statements, the Fed writes: "Nevertheless, possible increases in resource utilization as well as elevated energy prices have the potential to add to inflation pressures."
INCOME & PRODUCTION IMPLICATIONS FROM THE EMPLOYMENT REPORT
The employment report has implications for personal income and production. Wages and salaries could post a similar gain in March to February's 0.4 percent rise based on the rise in payrolls, the 0.2 percent gain in hourly earnings and the unchanged level of the average workweek at 33.8 hours. The outlook for the index of industrial production appears weaker given that factory payrolls declined as the factory workweek, as well as factory overtime, were unchanged. Manufacturing production accounts for roughly 80 percent of total production. Utilities output is a much smaller share, but creates a lot of the volatility and was mainly responsible for the sharp drop in January production followed by the spurt in February.
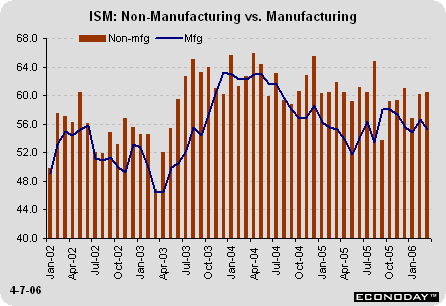
ISM SURVEYS SHOW LITTLE CHANGE IN MARCH
The ISM manufacturing index fell 1.5 percentage points to 55.2 in March from a level of 56.7 in February, but it remained above the January level. On the whole, the small changes over the past few months point to a flat picture, rather than one of significant movement in either direction. At 55 percent or above, there is no question that manufacturing activity is continuing to expand. However, it does not appear to be growing at a robust clip.
The business activity index from the ISM non-manufacturing survey inched up to 60.4 in March from 60.1 in February. The level was much higher than in January, but generally on track with the pace of the past several months. On average, the business activity index runs about 5 percentage points higher than the manufacturing ISM index. March saw no deviation from the trend. Overall, both surveys are pointing to moderate growth, at a pace slower than in 2004, but on par with 2005.
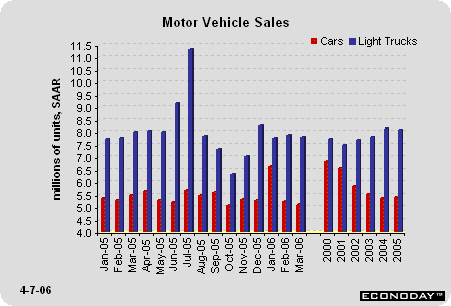
MOTOR VEHICLE SALES UNCHANGED IN MARCH
Domestic cars were sold at a 5.1 million-unit rate while domestic light trucks were sold at a 7.8 million-unit rate in March. This is not very different from the February pace. Indeed, light truck sales have been running at nearly an identical pace for three straight months. January car sales were boosted by fleet sales, but otherwise domestic autos have been selling in a tight range for the past six months as well. A couple of months ago, automakers declared they would not offer incentives but would sell cars at a competitive price. Well, I don't know about you, but I've seen TV ads with nothing but incentives on special models. The incentives are not particularly grandiose (hardly any zero interest offers anymore). Including the fleet sales in January, the first quarter sales pace for motor vehicle sales is exactly in line with the selling pace seen in the past four years - a 13.5 million-unit rate.
The Bottom Line
The employment situation for March should be considered good for the economy, but equity and bond investors are now worried about Fed tightening. While average hourly earnings didn't accelerate from the previous month, they are holding at roughly 3.5 percent on a year-over-year basis. The jobless rate is holding under 5 percent and this could be signaling that labor market conditions are tight. This is exactly what the Fed fears - that resource utilization is a problem. This employment report is certainly consistent with expectations that the Fed will raise the fed funds rate target by 25 basis points at the May meeting. It is perhaps too soon to declare a similar rate hike for the June meeting, but more and more Wall Street economists are coming around to that view.
Several key indicators will be closely monitored in the upcoming week - such as international trade and retail sales. The industrial production figures are coming out on Friday when markets are closed. It is not a federal holiday or a bank holiday, but markets are scheduled to be closed on Good Friday.
Looking Ahead: Week of April 10 to April 14
Wednesday
The international trade deficit on goods and services widened in January showing a $68.5 billion shortfall after widening in December as well. Exports jumped 2.5 percent in January but imports surged 3.6 percent during the month.
International trade balance Consensus Forecast for Feb 06: $-67 billion
Range: $-66 to $-69.5 billion
The U.S. Treasury will release the monthly budget report for March, which typically shows a deficit for the month. Over the past 10 years, the average deficit has amounted to $46 billion in March. In the past two years, however, deficits have been much larger - averaging $72 billion.
Treasury budget Consensus Forecast for Mar 06: $-85 billion
Range: $-70 to $-87 billion
Thursday
New jobless claims fell 5,000 in the week ended April 1 to 299,000, bringing the 4-week moving average down to 308,500. This was the third straight weekly drop in claims. In contrast to the declines in December and January, claims rose back over the 300,000 mark in February and March.
Jobless Claims Consensus Forecast for 4/8/06: 300,000
Range: 295,000 to 310,000
Retail sales fell 1.4 percent in February, the first drop after five straight monthly gains. Motor vehicle sales decreased 1.5 percent in March and could dampen overall sales. In contrast, gasoline prices in March have been on the rise - and this should help bolster nonauto retail sales for the month. Chain store sales were soft as Easter shifted into April this year, suggesting that retail sales for March might be lackluster.
Retail sales Consensus Forecast for Mar 06: 0.5 percent
Range: 0.1 to 0.7 percent
Retail sales ex autos Consensus Forecast for Mar 06: 0.5 percent
Range: 0.3 to 0.6 percent
Import prices fell 0.5 percent in February as oil import prices decreased 0.7 percent for the month. Crude oil prices were higher in March and this could boost the index.
Import prices Consensus Forecast for Mar 06: 0.1 percent
Range: 0.0 to 0.6 percent
In March, the University of Michigan's consumer sentiment index rose 2 points to 88.9. Labor market conditions have generally improved, but consumer attitudes may not be improving rapidly because gas prices remain high and interest rates are rising - increasing borrowing costs.
Consumer sentiment Consensus Forecast for mid-Apr 06: 89.5
Range: 87 to 91.5
Business inventories rose 0.6 percent in January with large gains across the board, particularly in manufacturing. Thus far, manufacturers' inventories fell 0.4 percent in February while wholesale trade inventories rose 0.8 percent. Only retail trade inventories are currently missing.
Business inventories Consensus Forecast for Feb 06: 0.4 percent
Range: 0.2 to 0.6 percent
Friday
The index of industrial production increased 0.7 percent in February as utilities production rebounded from a plunge in January. Look for some stability here in March. Factory payrolls were roughly unchanged in March and so was the workweek. This could mean only a modest gain in manufacturing production for the month.
Industrial production Consensus Forecast for Mar 06: 0.4 percent
Range: 0.3 to 0.6 percent
Capacity utilization rate Consensus Forecast for Mar 06: 81.5 percent
Range: 81.3 to 81.6 percent

