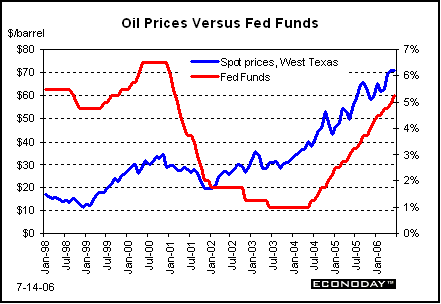
It was supposed to be a relatively boring week with key economic indicators being just monthly international trade and retail sales. That changed last Tuesday with a terrorist attack in Mumbai, India (formerly known as Bombay). Stocks actually rose on Tuesday but nervousness had begun to set in. On Wednesday, tensions between Palestinians and Israelis turned to outright fire fights and stocks fell sharply. Markets were also pummeled by other Middle East concerns regarding Iran's role in the Palestinian-Israeli fighting and with recommendations coming that Iran be sent back to the United Nations for sanctions for non-cooperation in regard to nuclear power plants that appear to be capable of producing material for nuclear weapons. And Iran responded with its own not so subtle threats that oil might be withheld from markets. All in all, oil prices surged during the week, setting new highs near $80 per barrel for West Texas intermediate - and provided further weight on equities.

Oil futures jumped sharply last week and indicate that traders expect oil to be near $80 per barrel well into 2007. Certainly, futures prices can change, but currently there is every indication that prices will remain near historic highs at least for the near future. Higher oil prices will cut into consumer discretionary spending while at the same time feeding further into overall and core inflation. The Fed's job has been made more difficult.
Recap of US Markets
STOCKS
Last week started off with a focus on second quarter earnings reports. Equities started the week mixed. Markets became nervous as Alcoa kicked off the earnings season with disappointing results. Tech companies also weighed in with poor performance, pulling the Nasdaq down. Realization that earnings were not looking so good led to defensive positions and movement into blue chips, boosting the Dow and S&P 500. Curiously, on Tuesday semiconductor company earnings came in strong for some companies just one day after a downgrade in the tech sector. Oil companies posted healthy earnings. Broad gains were seen in all major indices. The terrorist attack in India had modest impact in the U.S. on Tuesday but put the markets in an uneasy mood. On Wednesday, the flare up in the Middle East led to sharp declines in all major indices, with declines continuing through Friday. Higher oil prices also cut into equities with the realization that costs would be up for both consumers and businesses. Friday also saw selling pressure from weak retail sales and a dip in consumer confidence.
For the week, all four key indexes were down sharply: the Dow, 3.2 percent; S&P 500, 2.3 percent; Nasdaq, 4.4 percent; and the Russell 2000, 4.0 percent.
For the year-to-date, the Russell 2000 is up marginally at 1.2 percent; the Dow is essentially flat at +0.2 percent; the Wilshire 5000 has slipped 0.9 percent; and the Nasdag has dropped 7.6 percent.

BONDS
For the week interest rates generally eased slightly. Starting out, bond rates were listless on Monday, still in a quandary from the weak jobs report the prior Friday. With no economic news on Tuesday, focus was on the bombings in India, with Treasury prices getting a mild boost from safe haven effects, nudging rates down slightly. Safe haven effects continued through Friday, keeping interest rates down for the week except for the short end of the yield curve. Net for the week the yield curve was down 5 to 8 basis points except on the short end. The 3-month T-bill rate was up 5 basis points for the week.

Some market analysts argued last week that lower interest rates indicate that inflation is not a concern. This argument was made despite last week's sharp increases in gold prices and in oil prices. However, given that bond prices were bid up (rates down) by flight to safety, that argument does not hold a lot of weight.
Markets at a Glance

Weekly percent change column reflects percent changes for all components except interest rates. Interest rate changes are reflected in simple differences.
The Economy
Import prices continue to rise
With spot and futures oil prices jumping during the week, import prices are getting closer attention - at least by Fed watchers. Import prices overall rose only 0.1 percent in June after increases of 1.7 percent and 2.0 percent in May and April, respectively. But non-oil import prices jumped 0.4 percent in the latest month, following a 0.7 percent increase in May. Given that we know higher oil prices will feed into upcoming import price reports, the latest non-oil figures are disconcerting. The problem for the Fed is that import price inflation is running above overall CPI inflation. The last time CPI inflation decelerated over an extended period was during 2000 through 2001. At that time import price inflation was sharply below overall CPI inflation.

On a year-on-year basis, petroleum import prices have ranged between 20 percent and 40 percent. That is likely to continue in the near-term but with a higher base. Early in 2006, non-oil import prices had been softening but have been on an uptrend since May. Non-oil import prices have been strongest for industrial supplies and materials (excluding petroleum). Metals in particular have been under strong price pressure as both U.S. and overseas economies have had strong demand for these materials. Non-oil import prices for non-automotive consumer goods and for capital goods have been near flat. These trends are mildly helpful for the CPI and for business investment but not to the same extent as when these prices were declining during the late 1990s and into 2002.

It is difficult to bring core CPI inflation down without some help from weak import prices. The recent trend in non-oil import prices suggests that core inflation will not be edging down in the near-term.

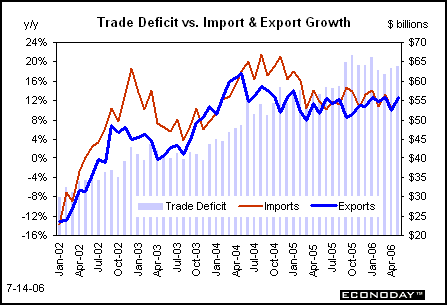
The monthly U.S. international trade gap widened marginally in May to $63.8 billion compared to a $63.3 billion gap in April. Imports rose 1.8 percent while exports jumped 2.4 percent. The near-term issue is that real GDP is likely to get a boost in the second quarter as the trade gap excluding petroleum fell to $43.2 billion from $47.3 billion in April. May's figure was the lowest since August of last year.
Over the next six months to a year, higher oil prices may cut into double-digit growth rates for imports as consumers have less discretionary income to spend - including on imports. Overall goods imports have come down to a 13 percent year-on-year rate while goods exports are at 14 percent.

Trade deficits in 2006 have worsened significantly with Mexico, Canada, and China, up 29 percent, 23 percent, and 13 percent, respectively, on a yearly cumulative comparison. The trade gap with Brazil has fallen 22 percent.
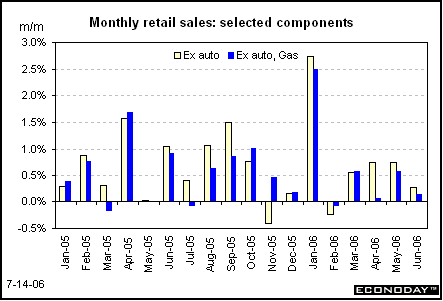
Retail sales slipped by 0.1 percent in June after an anemic 0.1 percent rise in May. While oil prices have had sizeable price effects on consumer spending, they also appear to be having income effects that have cut into real and discretionary income. Retail sales excluding gasoline fell 0.2 percent in June, following a 0.1 percent dip in May. Excluding both gas station and motor vehicles, retail sales edged up 0.1 percent in June but followed a 0.6 percent jump in May. Importantly, the consumer sector does seem to be slowing in response to both higher interest rates and higher gas prices. In recent months, slowing has been most evident in motor vehicles, building materials, and in department store sales.

Importantly, the slowing does not appear to be excessive. Looking ahead to second quarter GDP, the latest retail sales numbers suggest more moderate figures for durables and non-durables personal consumption expenditures. Excluding autos and gasoline, second quarter retail sales came in at a 3.3 percent annualized pace, following a 16.0 percent annualized jump in the first quarter. Services personal consumption expenditures within GDP have data sources that do not include retail sales.
The Bottom Line
Oil prices and geo-political concerns shook the markets last week. While most were distracted, the U.S. real economy appeared to be on track for moderate growth. However, inflation may not be on the same track as previously seen prior to last week. The Fed has been put between a rock and a hard place in terms of balancing whether another interest rate hike will achieve the desired reduction in core inflation. What has the Fed done in the recent past during periods of rising oil prices' During the late 1990s, the Fed chose to continue to raise rates to nip inflation expectations. This has been the Fed's position thus far into 2006 and will likely be the case in August's FOMC meeting. However, markets have lowered the odds of an August interest rate hike to only marginally above 50 percent. Regardless of the Fed's August decision, high oil prices are here to stay and investors need to factor that in.

Looking Ahead: Week of July 17 to July 21
Monday
The New York Fed's Empire State Manufacturing Survey index jumped in June to 29.0 from 12.9 in May. New orders, unfilled orders, and shipments were also strong. This index has been out of sync with other regional manufacturing indexes which have been at much more moderate levels and with overall manufacturing industrial production also moderate. The consensus expects a return to a moderately positive level for July.
Empire State Manufacturing Survey Consensus Forecast for July: 20.0
Range: 13.7 to 28.0
The index of industrial production slipped 0.1 percent in May, following strong gains of 0.5 percent in March and 0.8 percent in April. The manufacturing sector needs to keep its forward momentum to help the overall economy merely slow instead of turning negative. The employment report for June suggests a rebound in industrial production as manufacturing aggregate hours rose 0.4 percent in June. Overall capacity utilization in May declined to 81.7 percent from 81.9 percent in April.
Industrial production Consensus Forecast for June: +0.5 percent
Range: +0.3 to +0.6 percent
Capacity utilization Consensus Forecast for June 06: 82.0 percent
Range: 81.2 to 82.1 percent
Tuesday
The producer price index rose 0.2 percent in May, following a 0.9 percent boost in April. The core rate posted a stronger 0.3 percent in May, following a 0.1 percent rise in March. We should see higher oil prices continue to push up the overall PPI and probably keep the core under upward pressure.
PPI Consensus Forecast for June 06: +0.2 percent
Range: 0.0 to +0.5 percent
PPI ex food & energy Consensus Forecast for June 06: +0.2 percent
Range: 0.0 to +0.3 percent
Wednesday
The consumer price index rose 0.4 percent in May, following a 0.6 percent jump in April. Meanwhile, the core CPI increased 0.3 percent in May - the third consecutive increase of that magnitude. Two key concerns are that energy prices have not fully passed through and that import prices are no longer weak. We may see more energy pass through in June and we certainly have more energy-related boosts ahead for the marquee CPI number. Additionally, the market consensus is expecting a 0.2 percent rise in the core CPI, but to reach the Fed's desired inflation path, we need to start seeing some occasional 0.1 percent increases in core numbers. A 0.2 percent increase translates into a too high 2.7 percent annualized pace (compounded) - well above the 1-1/2 to 2 percent target zone.
CPI Consensus Forecast for June 06: +0.2 percent
Range: +0.1 to +0.2 percent
CPI ex food & energy Consensus Forecast for June 06: +0.2 percent
Range: +0.1 to +0.3 percent
Housing starts continue to defy gravity - the gravity of higher interest rates. Start rose 5.0 percent in May to 1.938 million units annualized, led mainly by the multifamily component but also with single-family starts posting a gain. We need to see moderate declines in starts to help the economy slow to the Fed's speed limit. The consensus expects only a modest decline in June.
Housing starts Consensus Forecast for June 06: 1.89 million-unit rate
Range: 1.85 million to 1.95 million-unit rate
Thursday
New jobless claims jumped 19,000 to 332,000 in the week ending July 8. However, the latest number was impacted by the Independence Day holiday (which is difficult to seasonally adjust), annual scheduled retooling in the auto industry, and a government shutdown in New Jersey that also affected a number of key private businesses including casinos. The markets are uncertain of the direction of labor market strength given divergent trends of weak payroll employment numbers and healthy household survey figures. Additionally, some analysts have been wondering out loud whether the ADP private survey of employment, which was very strong in June, that may be picking up something that the government statistics are missing. Given the special factors for the July 8 numbers, it is important that there be a sizeable improvement in new jobless claims. The consensus does expect a return of new jobless claims to a lower level as an offset to the prior special factors.
Jobless Claims Consensus Forecast for 7/15/06: 325,000
Range: 320,000 to 340,000
The index of leading indicators fell 0.6 percent in May, following a 0.1 percent dip in April. Generally, this indicator gets little market attention. However, a decline in June could raise a few eyebrows. Assuming neither April nor May are revised out of negative territory, a June decline would be a third straight dip. In years past, three consecutive declines were seen by many as a warning of pending recession. More sophisticated analysts, however, look at the size of the declines and how pervasive among the components the declines occur. Even though this index has lost its past glamour, another drop would likely get some market attention - especially given how jittery the markets are currently. The consensus expects the downturn in the leading index to end at two months with June posting a small increase.
Leading indicators Consensus Forecast for June 06: +0.2 percent
Range: +0.1 to +0.3 percent
The general business conditions component of the Philadelphia Fed's business outlook survey index was little changed at 13.1 in June compared to 14.4 in May. This is still in positive territory. Given the big jump in new orders in June, we may see some carry over to the overall index for July. However, prices paid remained high and this index may get more market attention than the composite.
Philadelphia Fed survey Consensus Forecast for July 06: 12.5
Range: 7.6 to 15.0


