Last week, most economic data pleasantly surprised the markets by coming in with weaker inflation numbers along with slower housing and industrial production numbers. The data largely validated the Fed's decision to pause in its consecutive interest rate increases - at least based on the net numbers for the week. A number of hot spots in the economy remain, leaving some room for the remaining Fed doubters to still call for further tightening ahead.
Recap of US Markets
STOCKS
Equities rose significantly for the week. The markets soaked in the economic data, alternating between focusing on the belief that the generally weaker numbers suggest an end to interest rate increases and focusing on a view that economic growth may be too weak. Markets were modestly positive on Monday as investors began to view the prior week's losses as overstated. Tuesday's weak core PPI sent stocks up sharply on Tuesday as did soft housing and industrial production data on Wednesday. Thursday's dip in the leading indicators helped moderate equity gains on Thursday. On Friday, prices weakened slightly after the University of Michigan's consumer sentiment index fell sharply, but they recovered to end the day mostly positive as a result of gains by energy companies as oil prices rebounded. Friday negatives included declines in Dell and in Ford share prices.
For the week, all major equities were up significantly. The Dow was up 2.6 percent; the S&P 500, 2.8 percent; the Nasdaq, 5.2 percent; and the Russell 2000, 4.8 percent. Key indexes were up for five consecutive days - the longest consecutive gain since mid-March.
Despite last week's notable gains, the technology heavy Nasdaq composite remains negative for the year, albeit less so. The Nasdaq is down 1.9 percent, year-to-date. Other major indexes have posted notable gains: the Dow, 6.2 percent; the S&P 500, 4.3 percent; and the Russell 2000, 5.7 percent.

BONDS
Interest rates fell noticeably over the week except for the 3-month bill. On Monday, rates were actually up a little as traders nervously feared that strong PPI and CPI figures were going to be seen on Tuesday and Wednesday. Tuesday's soft core figure led rates down as did the easing in the core CPI on Wednesday. Weak numbers for industrial production and housing starts also helped to pull longer rates down sharply on Wednesday. Rates edged up on Thursday in reaction to a drop in initial jobless claims. But on Friday, the markets actually paid attention to the University of Michigan's consumer sentiment index - which they rarely do. Confidence fell sharply and rates followed. Late in the week, purchases of Treasury notes by Asian central banks also supported prices and maintained downward pressure on rates.
Net for the week the yield curve was down sharply except on the 3-month bill. For the 2-year note through the 30-year bond, rates fell from 10 to 13 basis points. The 3-month Treasury bill rose 4 basis points for the week net.
The yield curve clearly has inverted on the short-to-medium term segments, indicating that the market believes the tightening cycle is over. Additionally, the decline in rates on the long end also suggests that the markets believe that either inflation will be coming down or that demand will be weak in coming quarters or both.

Markets at a Glance

Weekly percent change column reflects percent changes for all components except interest rates. Interest rate changes are reflected in simple differences.
The Economy
Producer prices surprise on the downside
The Tuesday release of the producer price index is what really set the week for significant gains in equities and sharp declines in Treasury yields. The overall producer price index surprisingly edged up only 0.1 percent in July, following a 0.5 percent jump in June. But what really shocked the markets was that the core rate actually fell 0.3 percent, following a 0.2 percent increase in June.
Declines in the latest month were led by passenger cars, pharmaceuticals, and food within the consumer components. Weakness in the core clearly was led by motor vehicles as passenger car prices fell 0.8 percent in July, following a 0.9 percent rise in June. Year-on-year, passenger car prices are down 3.7 percent. Additionally, the core weakness probably also reflected a technical decline in food prices which had spiked in June. Within the core figure, a number of capital goods components also posted declines, notably light trucks and computers. The auto sector is also weak from soft business demand as the light trucks component of capital equipment fell 3.1 percent in July, following a 0.4 percent rise in June, and is down 4.3 percent on a year-on-year basis.
As expected, energy rose 1.3 percent in July. Excluding energy prices, the PPI fell 0.3 percent in July, following a 0.5 percent increase in June.

The year-on-year core rate fell to 1.3 percent in July from 1.9 percent the prior month. The year-on-year rate for the overall PPI also declined in July to 4.2 percent from 4.9 percent in June.

The big concern about producer prices which the markets have largely ignored was at the lower levels of production. Overall prices at the crude level of production rebounded 3.1 percent in July after a 1.7 percent decline in June. Prices at the intermediate level rose 0.5 percent following a 0.7 percent gain in June. On a year-on-year basis, crude PPI inflation is 6.6 percent compared to 8.6 percent in June while intermediate PPI is at 8.9 percent vs. 9.3 percent in June. There still is potential for resource costs to lead to increases in some consumer prices.
Consumer prices slow a little but remain above target
The consumer price index report was not as favorable as the PPI report but did show some areas improvement - notably in a slightly slower core rate. Overall consumer price inflation rose 0.4 percent in July, following a 0.2 percent rise in June. The CPI slowed slightly at the core level, rising 0.2 percent in July following four consecutive 0.3 percent gains.
Clearly the market's favorable reaction to the CPI report had three key factors: 1) the core rate slowed marginally and came in below the consensus of 0.3 percent, 2) the core slowing followed a very favorable PPI report which shifted market views toward believing that inflation is slowing, and 3) economic indicators released in tandem with the CPI also showed significant slowing - housing starts and industrial production. In reality, the core CPI slowing was very modest and you had to look carefully to see where the slowing occurred. Within the core, housing was up 0.3 percent as was recreation and education. Medical care and "other" did slow to 0.2 percent.
Not unexpectedly, energy costs jumped 2.9 percent following a 0.9 percent decline in June. Energy costs are up 19.1 percent on a year-on-year basis from 23.3 percent in June. Gasoline rose 5.3 percent following a 1.9 percent dip in June and is up 29.6 percent on a year-on-year basis.

Year-on-year core inflation growth is unchanged at 2.7 percent from June's figure. The overall CPI's year-on-year growth rate edged down to 4.1 percent from 4.3 percent in June.

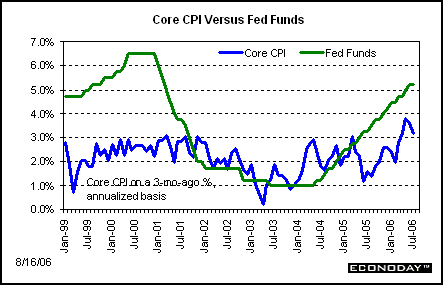
Despite the slowing to 0.2 percent in July, the core CPI still has a long way to go to reach the Fed's target range. On a marginal basis (3-month ago percent change annualized instead of the slower reacting year-on-year rate), the core CPI is still above 3 percent annualized. A 0.2 percent monthly change translates into a 2.7 percent annualized percent change (compounded).
Housing continues to slow
Housing continues to descend as many have been forecasting as housing starts slipped 2.5 percent in July, following a 5.7 percent drop in June. July's starts stood at an annualized pace of 1.795 million units from June's revised 1.841 million unit pace. Starts are 13.3 percent below July 2005 levels. Permits declined 6.5 percent in July following a 4.0 percent decrease in June.
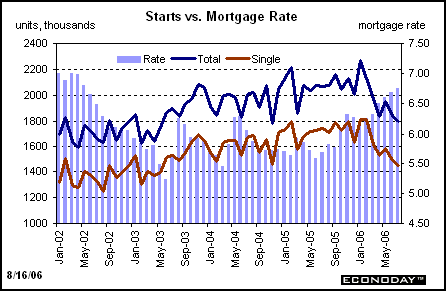
July's weakness was led somewhat by multifamily units. Single-family starts slipped 2.5 percent while multifamily units dropped 3.4 percent in July. Regionally, a gain of 0.7 percent was seen in the Midwest. Other regions declined, led by a 7.0 percent drop in the Northeast. Starts in the South and West fell 2.5 percent and 2.9 percent, respectively.
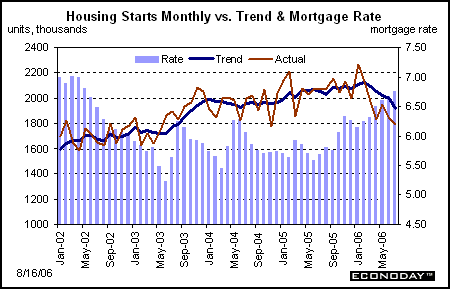
July housing numbers are in line with a number of factors - the continuing rise in mortgage rates (until recently), the slowing in employment growth, and decline in consumer confidence. Mortgage rates have only recently begun to edge down. Thirty-year fixed mortgage rates currently are running at 6 to 6-1/2 percent versus around 5-1/4 to 5-1/2 percent one year ago.
Corroborating the slowing in housing is the National Association of Home Builders housing market index which continues to decline, falling to 32 in August from 39 in July. The index is at a 15-year low.
Industrial production slows - or does it'
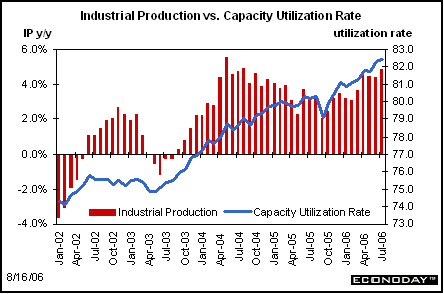
Industrial production posted a healthy overall gain in July but manufacturing slowed significantly. Overall industrial production rose 0.4 percent in July, following a revised increase of 0.8 percent in June. But what stood out is that manufacturing edged up only 0.1 percent in July, following a 0.8 percent surge in June. July's overall strength was in mining and utilities which rose 0.8 percent and 2.0 percent, respectively. Overall industrial output is up 4.9 percent year-on-year while manufacturing output is up 5.6 percent.
Most analysts noted that manufacturing weakness was primarily in motor vehicles which fell 5.4 percent in July after a 3.0 percent boost in June. Oddly, few noted the flip side to that statistic -excluding motor vehicles & parts, manufacturing output was up a robust 0.7 percent after a 0.6 percent gain in June. Year-on-year, manufacturing excluding motor vehicles is up 6.2 percent. The importance of this is that July's manufacturing weakness was very narrowly focused. Some components were quite strong - including machinery, computer & electronics, electrical equipment, aircraft, food & tobacco products, apparel products, and rubber & plastic products. Negatives were in motor vehicles, furniture, paper, and printing. Clearly, the positives were more widespread than the negatives.
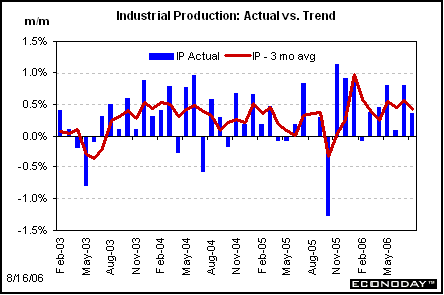
Overall capacity utilization in July increased to 82.4 percent from 82.3 percent in June. For manufacturing, capacity utilization actually slipped to 81.0 percent in July from 81.1 percent the prior month. This compares to year-ago level of 78.6 percent for manufacturing. Manufacturing capacity utilization is still in the moderate range except for mining which remains high, coming in at 92.1 percent for July from 91.2 percent in June.
Manufacturing surveys give mixed signals for upcoming production
The New York Fed and Philadelphia Fed surveys on manufacturing came out with data for August. The New York Fed overall index slipped in August while the Philadelphia Fed's main index jumped sharply from July. The New York index fell to 10.3 from 16.6 in July but still remained in positive territory. The Philadelphia Fed's manufacturing index jumped to 18.5 in August from 6.0 in July.
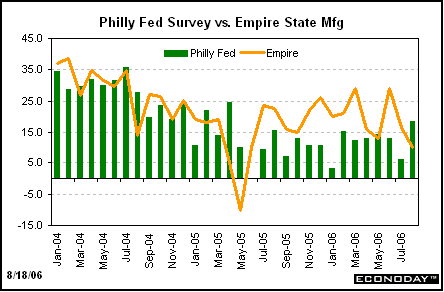
However, both surveys showed significant increases in new orders, pointing to continued, moderately healthy growth in manufacturing. The New York Fed's orders index advanced to 19.1 from 11.3 in July while the Philadelphia Fed's new orders index jumped to 15.7 in August from 10.1 the prior month. Overall, manufacturing is still positive in these two regions but growth rates are down from earlier in this year and late 2005.
Manufacturing prices paid still hot while prices received remain moderate
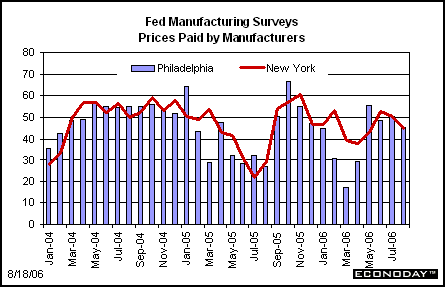
Both the New York Fed and Philadelphia Fed manufacturing surveys show prices paid remaining elevated. Both surveys indicate that prices paid remain well above lows earlier this spring and last summer.
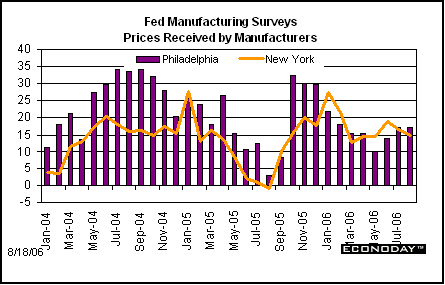
The good news for the economy overall is that continued upward price pressure from input prices has not translated into gains in prices received. The New York prices received index actually slipped to 14.9 from 16.5 in July while the Philadelphia prices received index was unchanged at 17.1. Both series are sharply below highs seen in late 2005.
As an almost completely unnoticed news item in the New York Fed's August survey, the New York Fed included special questions for manufacturers that were posed also in August 2005. The questions related to key concerns of manufacturers. While much attention is being given to higher input prices, those listing the "cost of resources" as a problem was 61.5 percent for this August - only a little higher than the 59.0 percent for August 2005. In contrast, those listing "workers' compensation costs" as a problem jumped to 66.1 percent from 55.9 percent in August 2005. Labor costs clearly are an inflation issue that should be at the forefront of discussion.
Leading indicators and consumer sentiment weaken
Rounding out the week with two of the generally non-market moving indicators, both the Conference Board's index of leading indicators and the University of Michigan consumer sentiment index fell. The Conference Board's leading economic index edged down 0.1 percent in July following a 0.1 percent rise in June. The leading index has decreased in four of the last six months and has been essentially flat on average in 2006. The index points to moderating growth in real GDP. The University of Michigan's consumer sentiment index fell sharply to 78.7 in August from 84.7 in July. The decline came mostly from the expectations components instead of from the current conditions component.
The Bottom Line
The economy gave us a few surprises last week with numbers generally below expectations for the PPI, CPI, and industrial production. Housing continued to decline as expected. The Fed's projections for a soft landing with an easing in inflation appear to be much on track. There are some caveats, however. The weakness in some of the indicators was narrowly focused (notably in the auto industry) with some hot spots remaining. Additionally, the moderation in July's CPI was more wishful thinking that actual slowing. In coming weeks, for the Fed's pause to officially become an end to the tightening cycle, we need to see more hot spots disappear while retaining moderate growth. In retrospect to last week's indicators, we need to see much more notable slowing in the core CPI, broader moderation in manufacturing than just primarily in the auto industry, and input prices for manufacturers to moderate. Nonetheless, the economy and inflation appear to be either on the Fed's projected path or not far from it.
Looking Ahead: Week of August 21 to August 25
Economic indicators are scarce this week, focusing on housing and manufacturing.
Wednesday
Existing home sales
Existing home sales fell 1.3 percent in June to a 6.620 million unit annual rate from May's 6.710 million units. This slowing in sales has been expected but what is drawing attention is the rise in unsold houses. Supply rose sharply in June to 6.8 months, a 9-year high, from 6.4 months in May. June's supply was up significantly from a year ago level of 4.4 months.
Existing home sales Consensus Forecast for July 06: 6.55 million-unit rate
Range: 6.40 to 6.75 million-unit rate
Thursday
Durable goods orders jumped 2.9 percent in June, following a 0.3 percent rise in May and 4.7 percent drop in April. Despite the usual volatility, orders have modestly positive on average and have provided key momentum for manufacturing. Unfilled durables orders are up 19.3 percent on a year-on-year basis - only a little below the recent high of 22.7 percent in April. However, we may see some slowing in housing-related durables but strength is still expected in capital equipment in coming months. Regional manufacturing surveys have posted gains in new orders but the tie with national data is loose. More recently, Ford also has announced cut-backs in production of motor vehicles. We may see weakness in motor vehicles orders which led to the production cuts.
New orders for durable goods Consensus Forecast for July 06: -0.2 percent
Range: -2.5 percent to +1.0 percent
>Jobless claims
fell by 10,000 for the August 12 week to 312,000. These data come from the same week as the week used for the monthly employment report. Despite the weekly improvement, the four-week average is still running on the high side, indicating labor market softness.
Jobless Claims Consensus Forecast for 8/19/06: 315,000
Range: 310,000 to 320,000
New home sales declined in June by 3.0 percent to an annual rate of 1.131 million, Sales had risen 3.5 percent and 0.5 percent in April and May, respectively. New home sales are down 11.1 percent on a year-on-year basis. Rising supply also is beginning to be an issue for new homes but not to the same degree as existing home supply. Supply for new homes increased to 6.1 months, up from 5.9 months in May. We may see a rebound in sales in the Northeast as that region experienced severe flooding in June - but the Northeast generally has only modest impact on the overall numbers due to that region's small share of the total.
New home sales Consensus Forecast for July 06: 1.100 million-unit rate
Range: 1.075 million to 1.155 million-unit rate


