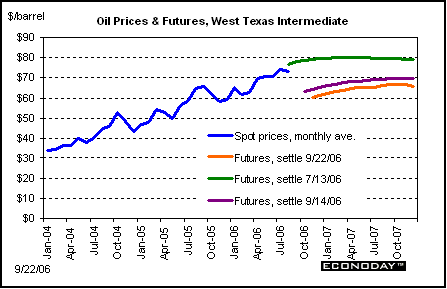
Oil prices fell further last week. West Texas intermediate stood at $60.28 per barrel just before closing last Friday. Crude was down $3.05 per barrel for the week. Declines were attributed to high petroleum stocks and downgraded forecasts for demand. Oil is at its lowest since closing at $60.27 on March 20 of this year.

Futures for oil prices are down significantly with prices ranging from $60 to $67 per barrel through the end of next year.
STOCKS
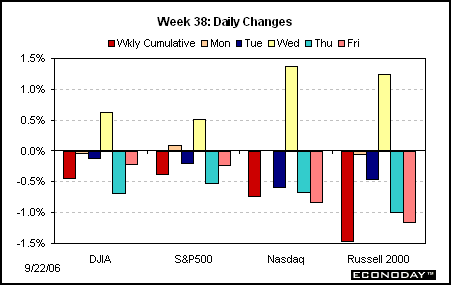
Stocks ended the week down moderately. Stocks were soft early in the week based on concerns over a weak economy with homebuilder data showing declines. Ford and GM pulled down the indexes with media focus on problems in the auto sector. Weaker-than-expected housing starts pulled equities down on Tuesday as did Daimler-Chrysler's announcement of production cuts. Wednesday's FOMC statement was a non-event for equities, but Oracle's strong earnings boosted the technical sector with spillover into other sectors. Investment houses also reported strong earnings. However, on Thursday the Philly Fed manufacturing numbers were down sharply and markets were reminded that the economy is slowing and that earnings will follow. Stocks fell further on Friday on continued concerns over a slowing economy.
For the week, all major equity indexes were down. The Dow was down 0.5 percent; the S&P 500, 0.4 percent; the Nasdaq, 0.7 percent; and the Russell 2000, 1.5 percent.
But year-to-date, all major indexes remain in positive territory - although just barely for the Nasdaq. The Dow is up 7.4 percent; the S&P 500 up 5.3 percent; the Nasdaq up 0.6 percent; and the Russell 2000 up 6.7 percent.
BONDS
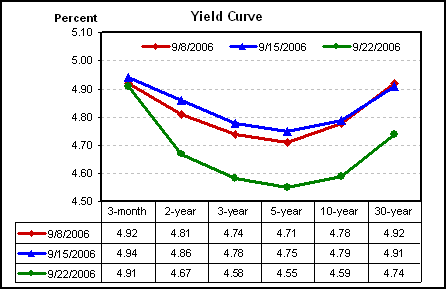
Interest rates dropped sharply last week - except for the short end which fell slightly. Longer-term Treasuries had their biggest price gains in 17 months. The 30-year bond is at its lowest rate since the close at 4.73 percent on March 27 of this year. Rates were led down by continued declines in oil prices as well as declines in housing starts and in the Philly Fed manufacturing index. The 3-month bill has changed little since it has to compete with other near-term rates such as fed funds which has not changed.
Net for the week the Treasury yield curve was down sharply except for the 3-month bill. The 3-month bill was down a mere 3 basis points. Other maturities were down very sharply as follows: 2-year Treasury note down 19 basis points; 3-year down 20 basis points; 5-year down 20 basis points; 10-year bond down 20 basis points; and 30-year bond down 17 basis points.
Markets at a Glance
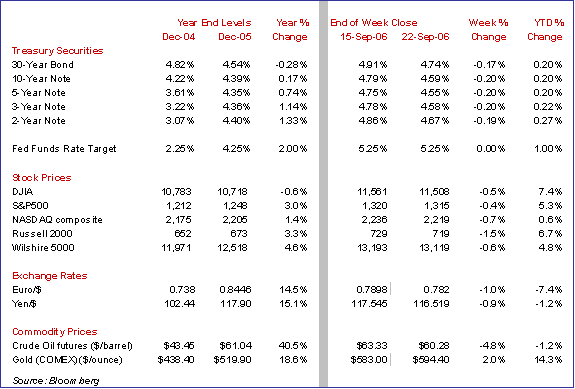
Weekly percent change column reflects percent changes for all components except interest rates. Interest rate changes are reflected in simple differences.
The Economy
This past week the economy showed further signs of moderation - including surprising softness in some inflation numbers.
Producer prices surprise on the low side
Last week's producer prices report continued recent downside surprises on the inflation front. Producer prices edged up only 0.1 percent in August, following an equally weak 0.1 percent increase in July. Even more surprising was a decline in the core rate of 0.4 percent, following a 0.3 percent decline in July.
Two facts stand out in this report. First, the auto industry is in trouble as indicated by declines in prices for passenger cars and light trucks. Second, recently weak oil prices have only just started to show up in the PPI data. Weakness in August's PPI was led by declines in prices for passenger cars, light trucks, computers, and pharmaceuticals. Passenger vehicle prices fell 2.6 percent while light motor truck prices dropped 3.4 percent.
Energy cost inflation has slowed, rising only 0.3 percent in August, following a 1.3 percent boost in July. Recent gasoline declines have only just started to show up in the PPI data with a 2.2 percent dip in August after a 0.7 percent gain in July. The August rise in overall energy costs was due to gains in electricity, natural gas, and heating oil. These should be declining in coming months as both natural gas and crude oil spot prices have been dropping recently. Excluding energy prices, the PPI rebounded a mild 0.1 percent in August, following a 0.3 percent decline in July.
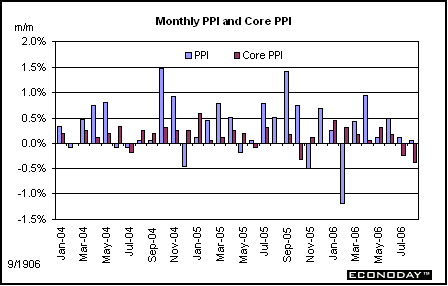
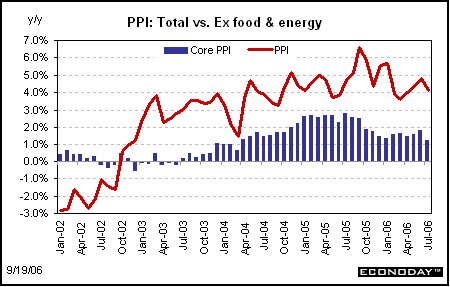
The year-on-year rate for the overall PPI fell to 3.7 percent from 4.2 percent in July. The year-on-year core rate slipped to 0.9 percent in July from 1.3 percent in July.
We are still seeing significant price pressures further back in the production chain but most of it is energy related for crude goods. Overall prices at the crude level of production increased 2.2 percent in August after a 3.1 percent rebound in July. Crude materials excluding energy fell 1.2 percent in August following a 1.6 percent increase the month before. Weakness was in aluminum and numerous construction materials. At the intermediate level, prices are still strong - even excluding energy. Prices at the intermediate level rose 0.4 percent following a 0.5 percent increase in July. Excluding energy, intermediate prices rose 0.3 percent in August following a 0.7 percent boost in July.
On a year-on-year basis, crude PPI inflation is at 5.3 percent compared to 6.6 percent in July while the intermediate PPI is at 8.8 percent from 8.9 percent in July.
Housing starts continue downward
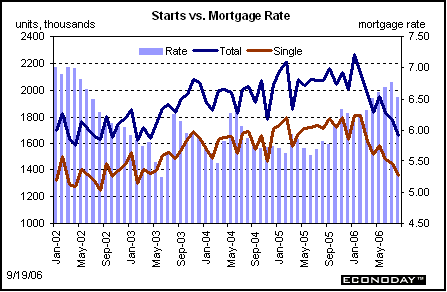
One area of concern for the economy is the continued decline in housing - is it still moderate' Housing starts fell 6.0 percent in August, following a revised 3.3 percent drop in July. Starts are now 19.8 percent below August 2005 levels. Housing starts are at their lowest level since the 1.643 million unit pace in April of 2003.
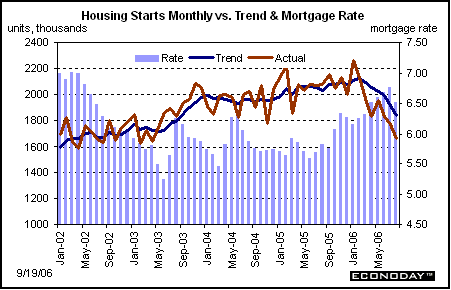
August's weakness in starts was evenly balanced between single-family and multifamily units. Single-family starts declined 5.9 percent while multifamily units dropped 6.7 percent in August. Regionally, only the Northeast showed an increase, up 5.4 percent in August but following two very weak months. The Midwest showed the largest decline 12.2 percent in August. The South and West fell 6.1 percent and 5.5 percent respectively.
What some perceive as too much weakness in housing should be viewed from a longer-term perspective. Housing has been much stronger this cycle because mortgage rates have been so low. Overall starts have fallen 26 percent since the recent peak of 2.265 million units this past January. However, this peak was 30 percent higher than the previous peak in 1999. Current levels are only slightly below the previous peak and are relatively strong. (Note: the lower and higher percentages have different bases and therefore are not comparable in terms of levels.) The bottom line is that while homebuilders' and realtors' revenues are not going gangbusters as they had the last three years, levels of activity are quite respectable. As an aside, this cycle's peak occurred in January and was artificially boosted by strong seasonal factors, and the magnitude of the current decline is not so dramatic if the January aberration is discounted.
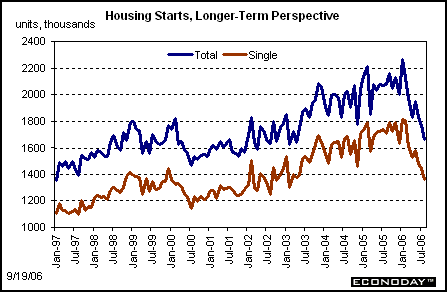
Mortgage rates have come down significantly in recent weeks. Rates for 30-year fixed rate mortgages are running in the 5.85 percent vicinity compared to 6.30 percent three months ago. However, until the recent surge in the inventory of unsold homes is brought down, starts will be soft.
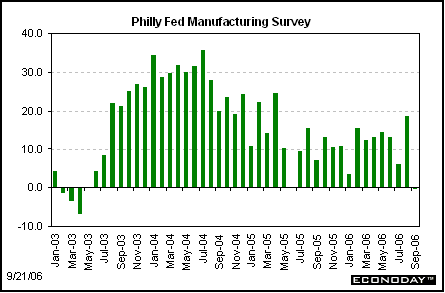
Philadelphia Fed manufacturing survey raises fears of economic weakness
The biggest impact on the equities and bond markets this week was not the announcement from the Federal Reserve's FOMC policy meeting on Wednesday. Instead, it was the Philadelphia Fed's manufacturing index on Thursday that rattled the markets. In the shadows of the FOMC statement calling for slower economic growth in coming quarters, the Philadelphia Fed's September numbers brought the reality of this view to the markets. The overall current activity index fell to minus 0.4 from a positive 18.5 in August. This is the lowest this index has been since minus 6.8 for April 2003.
Additionally, both the new orders and shipment indexes dropped sharply. Shipments plunged to minus 6.8 from a positive 22.3 in August while new orders fell to minus 1.3 from a positive 15.7. These are the weakest numbers for these series in 3-1/2 years.
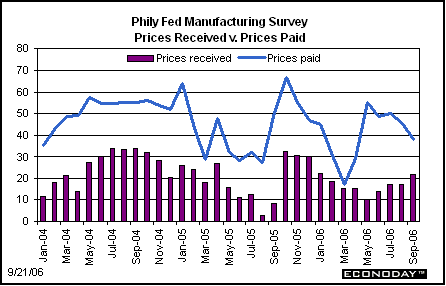
Prices paid eased somewhat to 38.1 from 45.3 in August. But prices received continued its recent uptrend, rising to 21.6 from 17.1 the prior month. Recent declines in oil prices have not yet fully shown up in the data.
While the markets clearly took the view that the sharp drop in the current activity index is a sign that the economy is slowing, there are details in the report than indicate the markets may have overreacted. First, the data can be erratic. The September drop in current activity, new orders, and shipments could just be a temporary drop - or, indeed, activity could continue weak as some in the markets are concerned. Second, the employment numbers actually improved! Why would manufacturers hire if they expect weak growth' Additionally, prices received have been on an uptrend since April. Firming prices are typical of strong demand, not weak demand. Essentially, we will have to wait on another month or two of data to get a clearer view of manufacturing in the mid-Atlantic region.
Fed pause may be prelude to rate cuts next year
At the September 20 FOMC meeting, as expected the Fed left the federal funds target rate unchanged at to 5-1/4 percent. As for the August 8 meeting, Jeffrey Lacker, president of the Federal Reserve Bank of Richmond, again voted for an immediate increase of 25 basis points in the federal funds rate target, leaving the vote at 10 to 1 for no change.
The statement differed only marginally from the August 8 statement when the Fed paused for the first time after raising fed funds for 17 consecutive FOMC meetings. The FOMC statement still focused on the fact that inflation remained elevated and could remain too high. As before, the Fed is counting on moderation in real growth, which it is forecasting, to bring inflation down.
Keeping up with recent developments, the Fed altered the FOMC statement to reflect the recent decline in oil prices. Oil prices are now seen as a help in the inflation fight and are no longer cited as a factor behind expected slowing in economic growth.
The Fed cited "a cooling of the housing market" as the key reason for a slowing in overall economic growth - but it is no longer characterized as a controlled cooling. In coming weeks it will be interesting to see what is behind Fed thinking on why only housing is cited for the reason the economy is slowing, and whether housing is too weak for the Fed's taste or not. We still have not heard the Fed indicate the slowing is broad based and this may be a continuing concern.
The statement still left open the door for additional firming at a later time, depending on incoming data on economic growth and inflation. There still is a bias toward further tightening. Retaining this inflation bias suggests that any Fed easing may not be as soon as some currently anticipate.

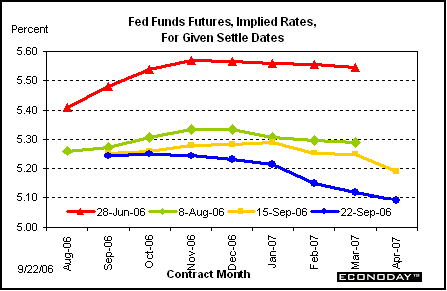
But the markets clearly are expecting an easing in interest rates by the Fed early next year. Based on trading in the fed funds futures markets, two interest rate cuts are expected by mid-year.
The bottom line
Last week's limited data show the economy continuing to slow. Housing is down significantly from cyclical highs but still at respectable levels. Manufacturing is weak but one month's data from the Philadelphia Fed is too little to extrapolate. Inflation numbers are headed in the direction the Fed has wished. We certainly can expect moderation in the economy to continue but it is far too premature to expect anything near a recession - especially with the boost to the consumer sector that is still underway from lower gasoline prices. The risks to the economy remain balanced with some notable probability for too-weak economic growth and for too-high inflation. Overall, the economy most likely is on target for a soft landing. Even so, slower revenues need to be factored in - especially for housing related equities.
Looking Ahead: Week of September 25 to September 29
Monday
Existing home sales fell 4.1 percent in July with the 7.270 million unit annualized pace down 11.2 percent year-on-year. Supply is an increasing concern with unsold homes to sales at 7.3 months - a 13-year high. There are two recent cross currents related to where housing sales are headed: employment growth has been soft but mortgage rates have been coming down in recent weeks. Will the drop in mortgage rates be enough to offset employment sluggishness and help stabilize sales'
Existing home sales Consensus Forecast for Aug. 06: 6.20 million-unit rate
Range: 6.00 million to 6.30 million-unit rate
Tuesday
The Conference Board's consumer confidence index dropped to 99.6 in August from 107.0 in July. Weakness was largely related to consumer assessment of the jobs market which slipped. In prior months, higher oil prices were keeping confidence down. We should see some improvement related to the recent drop in oil prices. If not, that would be a big concern.
Consumer confidence Consensus Forecast for Sep. 06: 101.0
Range: 98.0 to 104.0
Wednesday
Durable goods orders fell 2.5 percent in July following a 3.3 percent boost in June. Manufacturing output weakened in August and the durables orders will be key for giving us a view whether the latest softness in manufacturing is a trend or just temporary. Recent orders weakness has been heavy in the auto sector, and auto manufacturers have announced production cuts. It is important that new orders outside of autos remain healthy.
New orders for durable goods Consensus Forecast for Aug. 06: +0.5 percent
Range: -1.9 percent to +1.5 percent
New home sales fell 4.3 percent in July to a yearly 1.072 million pace. Sales have been on a downtrend since the peak of 1.324 million units in March 2005. Sales are down 19 percent from the peak. And supply is at a 13-year high.
New home sales Consensus Forecast for Aug. 06: 1.040 million-unit rate
Range: .990 million to 1.075 million-unit rate
Thursday
In the August release, second quarter real GDP was revised up to an annualized growth rate of 2.9 percent from the initial 2.5 percent estimate for the second quarter. This number clearly put GDP growth at that time above potential. For the third quarter, data are coming in softer and few expect another above potential gain in GDP so the final revisions to the second quarter will only have importance in terms of composition - not overall growth. Will any changes in composition point to any imbalances or suggest that second half growth - although likely slower - is likely to be balanced'
Real GDP Consensus Forecast for final Q2 06: 2.9 percent annual rate
Range: 2.7 to 3.0 percent annual rate
GDP deflator Consensus Forecast for final Q2 06: 3.3 percent annual rate
Range: 3.3 to 3.4 percent annual rate
Initial jobless claims rose 7,000 in the September 16 week to a level of 318,000 but followed modest declines in the prior two weeks. Given the August weakness in the jobs outlook portion of the Conference Board's consumer confidence index, the markets will be paying close attention to any early indication that employment growth is slowing too much. Currently, job growth is about where the Fed wants it but any further weakening could hasten when the Fed chooses to end their pause and actually cut rates.
Jobless Claims Consensus Forecast for 9/23/06: +315,000
Range: +300,000 to +320,000
Friday
Personal income rose 0.5 percent in July following a 0.6 percent increase in June. But more recently, average hourly earnings and employment growth have been soft and the average workweek slipped in August. We will likely see only a small positive in the wages and salaries component of personal income - the largest component. The consumer sector has held up well and we still need to see at least moderate gains in consumer spending to keep overall economic growth in the second half modestly positive. Markets will probably focus on two key items in the report - the already mentioned wages and salaries but also the core PCE deflator. While economic growth has been moderating, there have been only recent data indicating a slowing in inflation. We have had a favorable CPI this month and the markets will be watching to see how much of it ends up in the core PCE deflator - the Fed's favorite inflation indicator.
Personal income Consensus Forecast for Aug. 06: +0.2 percent
Range: 0.0 to +0.5 percent
Personal consumption expenditures Consensus Forecast for Aug. 06: +0.2 percent
Range: 0.0 to +0.5 percent
The University of Michigan's consumer sentiment index rose to 84.4 in September from 82.0 in August, partly benefiting from lower gasoline prices. The report also posted a significant decline in inflation expectations. The Fed has repeatedly emphasized the importance of keeping inflation expectations low so the markets will be watching not just the overall index but also the inflation expectations numbers.
Consumer sentiment Consensus Forecast for final, Sep. 06: 85.0
Range: 82.0 to 87.0
The NAPM-Chicago purchasing managers index slipped to 57.1 in August from 57.9 in July. The index remains relatively healthy with new orders holding onto very respectable levels. The prices paid index remains very high.
NAPM-Chicago survey Consensus Forecast for Sep. 06: 55.0
Range: 52.0 to 58.1

