Economic data were mixed last week but clearly net on the soft side with some analysts noting higher risks of recession. Investors in the equity markets took the data to mean that the Fed is done with any additional interest rate increases.
Recap of US Markets
OIL PRICES
Oil prices edged up last week but remained relatively low. West Texas intermediate stood at $62.91 per barrel just before closing last Friday. Crude was up only $2.60 per barrel for the week, after falling $3.05 per barrel the prior week. Stocks were higher than expected last week but talk of production cuts by OPEC members kept prices from falling below $60, which is a barrier markets are not willing to break at this point.

Futures for oil prices are up a little from the prior week with prices still moderate, ranging from $63 to $69 per barrel through the end of next year. Oil prices are significantly below highs seen over the summer and are positives for both consumer spending and helping to ease inflation.
STOCKS
Stocks ended the week up significantly with the Dow flirting with setting a record close but falling short. End-of-quarter window dressing appeared to provide significant support as numerous companies purchased their own stock. Continued soft oil prices were generally favorable also. Stocks got a huge boost on Monday as bad news was good news with drops in both existing home sales and prices. Investors saw the data as insurance the Fed will not raise rates again this cycle and might even be lowering rates this coming spring. Strong-than-expected consumer confidence pushed equities higher on Tuesday. For the remainder of the week, equities drifted higher, largely on momentum from the belief that the Fed will not raise interest rates, end-of-quarter window dressing, and based on additional numbers of improving consumer sentiment. Also, testimony by Hewlett-Packard Chief Executive Officer Mark Hurd before the U.S. House Energy and Commerce Committee on the HP scandal was viewed as highly favorable and created positive momentum not just for HP but for overall market psychology.
For the week, all major equity indexes were up significantly. The Dow ended the week at a six- and-a-half-year high and just short of a record high, while the S&P 500 stood at a five-and-a-half-year high. The Dow was up 1.5 percent; the S&P 500, 1.6 percent; the Nasdaq, 1.8 percent; and the Russell 2000, 1.0 percent.
But year-to-date, all major indexes moved further into positive territory. The Dow is up 9.0 percent; the S&P 500 up 7.0 percent; the Nasdaq up 2.4 percent; and the Russell 2000 up 7.8 percent.

BONDS
Interest rates whipsawed last week, dropping significantly early in the week but ending the week slightly higher except on the short end. Monday, rates fell significantly in response to the drop in sales and prices for existing homes. Much of Monday's decline in rates reversed on Tuesday as stronger-than-expected consumer confidence raised concerns about the economy being too strong. Also, profit taking pushed rates up as many believed that bonds had been over bought. On Wednesday, the durable goods orders report was weak but essentially offset by a stronger report on new home sales even though housing prices slipped. Friday's economic reports provided most of the final boost to rates as the Chicago Purchasing Managers index came in stronger than expected. This corroborated strength in the Richmond Fed survey earlier in the week. Although the income side of the personal income report was weak, the inflation part was not with the core PCE deflator rising to a 2.5 percent year-on-year rate. Remarks by St. Louis Fed President Poole that future Fed moves are still data dependent and could still rise also helped firm rates on Friday.
Net for the week the Treasury yield curve was up slightly except for the 3-month bill. The 3-month bill was down 3 basis points. Other maturities were up as follows: 2-year Treasury note, up 1 basis point; 3-year, up 3 basis points; 5-year, up 3 basis points; 10-year bond, up 4 basis points; and 30-year bond, up 2 basis points.

Markets at a Glance

Weekly percent change column reflects percent changes for all components except interest rates. Interest rate changes are reflected in simple differences.
The Economy
Last week, economic data were mixed but the downside numbers were raising more chatter about recession while inflation numbers suggested that the Fed may not be cutting rates soon. As usual, opinions were mixed.
Existing housing sales weaker than headline
Housing has been the focal point for why the economy is expected to slow - including the consumer sector. Not only is housing to slow construction and income growth but it will also allegedly limit consumer spending since home equity lines of credit have been heavily tapped and now housing prices are not appreciating as fast. In some areas, housing prices are declining. Bringing these issues to the forefront last week was the report on existing home sales. Existing home sales fell 0.5 percent in August to a 6.30 million rate from 6.33 million in July. August's sales pace is down 12.6 percent on a year-on-year basis. Most of the weakness in August sales was in condos, which fell 3.5 percent on the month while single-family existing home sales were flat.
The overall number for existing home sales actually exceeded expectations - so why the negative reaction' Housing supply and sales prices were the central points of the report. The number of unsold homes continues to be a problem while sales prices are under downward pressure. The supply of unsold homes rose another 2 tenths in the month to 7.5 months -- the highest in 13 years. This compares with 4.7 months a year ago. Prices are under pressure both from higher supply and softening demand. The median sales price fell 2.2 percent in the month to $225,000. The year-on-year rate posted its first drop in 11 years, down 1.7 percent.
There are two concerns regarding the latest housing data. First, the housing industry itself may slow too much and weaken the economy more than expected. Second, weak home prices may cause the consumer to retrench too much since there will be less growth in home equity for the consumer to tap. Nonetheless, the Fed is betting on both slowing housing and slower home equity growth to moderate economic growth and inflation - the issue is one of degree whether the economy is on the path for a soft landing or a hard landing.

The new home sales report came out later in the week and helped offset some of the market pessimism from the first. New home sales advanced up 4.1 percent to a slightly stronger-than-expected annual rate of 1.050 million. However the August gain was offset by a sharp downward revision to July from 1.072 million to 1.009 million making the month the slowest in 3-1/2 years. Nonetheless, markets were glad to see improvement on the margin which was seen as partially stemming the downtrend in housing.
In contrast to prices for existing homes, the median price for new home sold rose 0.3 percent to $237,000. Also, supply slipped to 6.6 months from 7.0 months in July.
The numbers from the new home sales report were modest positives. Still, the markets seem to be very sensitive to any signs of excessive weakness in housing.

Further signs of consumer slowing - but not inflation
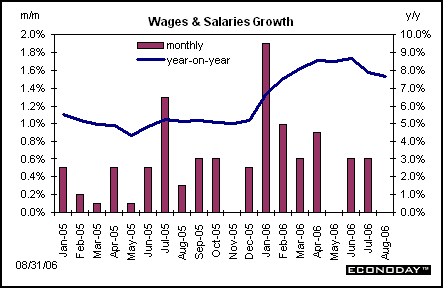
Last week's personal income report added to the hard landing view. Personal income slowed to a 0.3 percent increase in August, following a 0.5 percent jump in July. More importantly, the key wages and salaries component slowed sharply to a 0.1 percent increase in August following a 0.6 percent advance in July. Consumers tend to spend more out of wages and salaries than any other component other than transfer payments. The August weakness is just one month's data but markets have been fixated on signs of slowing that would preclude any further Fed tightening or would encourage sooner easing. The payroll income weakness was across all major private industries but with manufacturing payroll income actually falling.
Also raising the red flag for a potential hard landing was the sharp slowing in personal consumption in August to a 0.1 percent increase, following a 0.8 gain in July. Weakness was in durables personal consumption which fell 1.3 percent in August after a 1.8 percent hike in July. For the latest month, the decline was entirely due to a 3.6 percent drop in motor vehicle sales. Within durables, furniture and "other" durables posted moderate gains. Even though furniture sales have been up and down, we have yet to see an outright downtrend in furniture sales and this could be a source of weakness in coming months.

Personal income is up 9.4 percent on a year-on-year basis, compared to 7.0 percent in July. But these numbers belie the weakness on the margin - especially in wage and salary growth. The weakness in wages and salaries has not yet become a trend but softness in employment indicates that it may be headed there.
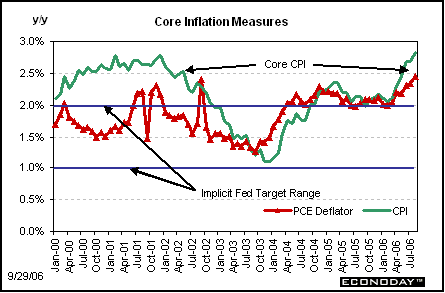
The increased turbulence includes upside risks also - at least for inflation. The overall PCE deflator rose 0.2 percent, following a 0.3 percent increase in July. But the Fed's favorite inflation index - the core PCE deflator - firmed with a 0.2 percent increase in August, compared to 0.1 percent in July. On a year-on-year basis, the core deflator accelerated 0.2 percentage points to 2.5 percent from 2.3 percent in July. This higher number reminded the markets that it may take a while for inflation to fall within the Fed's target range even though overall economic activity has already begun to slow. The Fed's target range for the core PCE deflator is believed to be 1 to 2 percent annual growth.
Bumpy ride in manufacturing
Reports from the manufacturing sector added to that bumpy-ride feeling last weak. First, new factory orders for durable goods posted a broad-based decline in August, falling 0.5 percent after a 2.7 percent drop in July. This was the first back-to-back decline since April-May 2004. Excluding transportation, new orders fell 2.0 percent in August, after no change in July. Industry categories posting declines in August were primary metals, machinery, computers & electronics, electrical equipment, and "other." Industry categories posting gains in August were fabricated metal products and transportation
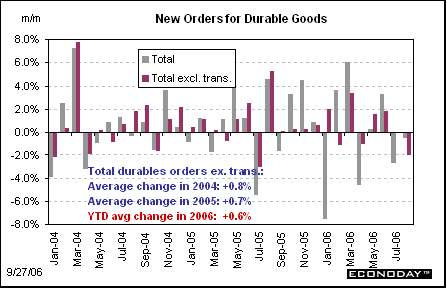
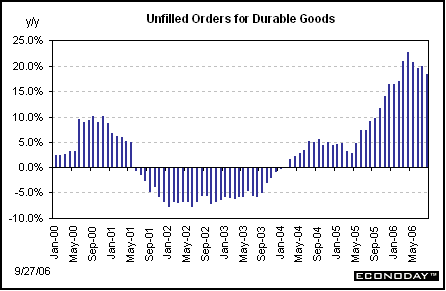
Year-on-year, new orders for durable goods fell to 3.8 percent from 9.1 percent in July. Unfilled durables orders slipped to an 18.4 percent year-on-year increase in August from 19.9 percent in July.
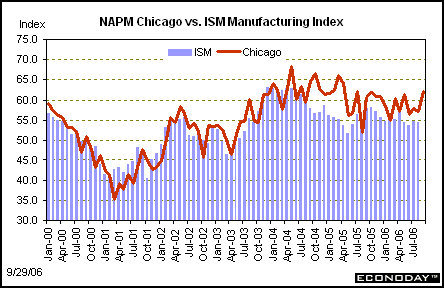
Later in the week, the manufacturing sector felt an updraft. The Chicago purchasing managers reported a sharp increase in activity during September with the overall index rising to 62.1 from 57.1. This corroborated strength in the Richmond Fed's report which came out earlier in the week but attracted no attention and contrasted sharply with the sudden slowing in the previous week's Philadelphia Federal Reserve report on manufacturing. However, the Chicago report includes some non-manufacturing firms in its report and it is unknown how much of the strength was in manufacturing.
Overall, incoming data on manufacturing have been mixed. Recent industrial production numbers were nearly flat while regional manufacturing indexes since have been all over the map. The Philadelphia and New York Fed indexes have decelerated while the Richmond Fed and the Chicago purchasing managers indexes have shown improvement. These conflicting numbers raise the issue - is the economy at a turning point in the business (the level of activity peaks) or an inflection point in the cycle (the growth rate peaks). For both, it is common to have numbers scattered on both sides of the fence. This probably is what the Fed's pause is all about - deciphering the incoming data that probably have more uncertainty than during other phases of the business cycle.
GDP revised down but markets look ahead
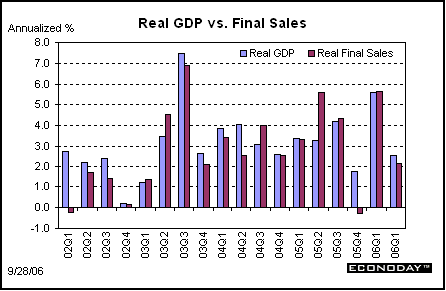
Second quarter real GDP was revised down to an annualized growth rate of 2.6 percent from the preliminary 2.9 percent estimate for the second quarter. The main story here is that the markets were reminded that economic weakness is concentrated in housing and in autos - no news there. Final sales are still moderate at a revised 2.1 percent - previously 2.3 percent - from 5.6 percent in the first quarter. Other than declines in housing and in durables personal consumption, spending was moderately health with no notable inventory overhang.
Inflation through the second quarter remained too high with the overall GDP deflator unrevised at 3.3 percent annualized - same as the prior three quarters. The core deflator for PCEs - the preferred inflation measure of the Fed - was revised down marginally to 2.7 percent annualized from the prior second quarter estimate of 2.8 percent annualized and remains notably higher than the first quarter's 2.1 percent.

The second quarter GDP numbers were quickly dated by Friday's personal income report which indicated modest growth in consumer spending during the third quarter but with inflation still too high.
The bottom line
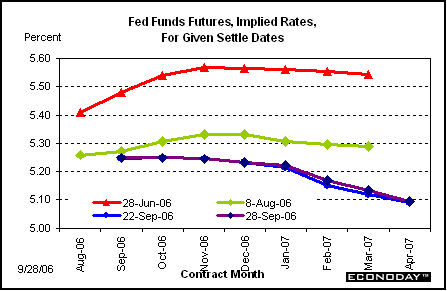
Last week's numbers on the economy showed the soft landing getting bumpier. We may still get the soft landing but right now, the turbulence has picked up a little. We still have a long way to go to get inflation within the Fed's target range. Markets apparently believe that the Fed's forecast for continued modest economic growth will pull inflation down within the next six to nine months. Such would be the required belief to be consistent with the federal funds market, which right now continues to price in at least one 25 basis point cut in interest rates by this spring. And this is one of the factors behind last week's boost in stock prices - along with end-of-quarter window dressing. But the latest inflation numbers indicate it may take a bit longer for the Fed to get around to a rate cut.
Looking Ahead: Week of October 2 to October 6
Monday
Construction spending fell 1.2 percent in July following a 0.4 percent gain in June. We have been seeing a divergent trend with residential outlays declining while nonresidential outlays relatively strong. We can expect residential construction outlays to continue downward as housing starts have been declining. A key issue will be whether strength continues in nonresidential construction outlays to offset some of the weakness in housing. The consensus thinks not, however, for August.
Construction spending Consensus Forecast for August 06: -0.4 percent
Range: -1.0 to +0.7 percent
The Institute for Supply Management's manufacturing index slipped to 54.5 from 54.7 in July. We have since seen weakness in government data on durables orders and on industrial production. And the regional manufacturing indexes have been mixed. To keep the hoped for soft landing from becoming a hard landing, manufacturing needs to hold up to at least moderate growth. Additionally, non-oil commodity prices have remained strong. Prices paid by manufacturers need to soften to help on the inflation front. The ISM report will be the first national report on how manufacturing held up in September.
ISM manufacturing index Consensus Forecast for September 06: 53.5
Range: 52.0 to 53.5
Tuesday
Motor vehicle sales fell 4.6 percent in August to a 12.4 million rate from 13.0 million in July. We may be seeing a return of auto and light truck sales back to a soft pace. Even though lower gasoline prices may give consumers some incentive to return to the auto market, weak income growth is likely to be more than offsetting.
Motor vehicle sales Consensus Forecast for September 06: 12.7 million-unit rate
Range: 12.4 to 12.8 million-unit rate
Wednesday
Factory orders edged down 0.6 percent in July following a 1.5 percent boost in June. Excluding transportation, orders rose 1.1 percent in July. But we have since had a weak durables orders report which will be weighing on overall factory orders for August.
Factory orders Consensus Forecast for August 06: -0.2 percent
Range: -0.5 to +0.5 percent
ISM non-manufacturing survey
The Institute for Supply Management's non-manufacturing report was mixed in August as the overall index advanced to 57.0 in August from July's 54.8 while sub-indexes were generally declining. The overall index is not based on the sub-indexes. Markets will be watching to see if sub-index weakness continues and also whether prices paid continues high.
Business activity index Consensus Forecast for September 06: 56.0
Range: 52.0 to 57.0
Thursday
Initial jobless claims have been on a soft trend as weekly initial jobless claims edged down 6,000 to 316,000 in the September 23 week while continuing claims for the September 16 week rose 8,000 to 2.444 million (continuing claims data lag initial claims). Employment and income gains may be a little too sluggish and some improvement in initial claims might be welcome to keep a hoped for soft landing from becoming a hard landing.
Jobless Claims Consensus Forecast for 9/30/06: +315,000
Range: +310,000 to +322,000
Friday
The employment situation report for August really began to paint the view that the economy really is in a slowing phase as non-farm payrolls rose a very moderate 128,000. But earnings were even more sluggish, posting only a 0.1 percent gain in August. Employment has been on the soft side for a few months but August was the first notable weakness in hourly earnings. Continued soft gains in both payrolls and wages would be welcome news as long as they do not get any weaker. What the markets would not like would be slow employment gains but a resumption of strong wage increases. Continued strength in labor costs has been a remaining concern for bringing overall inflation down. Even with sluggish employment gains, labor markets still show some signs of tightness as the unemployment rate edged down to 4.7 percent in August from 4.8 percent in July. A slight reversal likely would be welcomed by the markets.
Nonfarm payrolls Consensus Forecast for September 06: +125,000
Range: +100,000 to +145,000
Unemployment rate Consensus Forecast for September 06: 4.7 percent
Range: 4.6 to 4.8 percent
Average workweek Consensus Forecast for September 06: 33.8 hours
Range: 33.8 to 33.9 hours
Average hourly earnings Consensus Forecast for September 06: +0.3 percent
Range: +0.2 to +0.4 percent
Consumer credit rose $5.6 billion in July, boosted primarily by a boost in auto sales.
Consumer credit Consensus Forecast for August 06: +$4.5 billion
Range: no change to +$8.5 billion


