Oil prices fell significantly in the week, breaking not only the $60 barrier but also the $59 level. West Texas intermediate stood at $59.91 per barrel just before closing last Friday. Crude was down a sharp $3.00 per barrel for the week, after rising $2.63 per barrel in the prior week. U.S. oil stocks are heavy and OPEC members were not able to come to an agreement for cutting production. BP also restarted portions of its Alaskan oil field. The decline in oil prices was favorable for equities in general (except for oil companies) and bond prices. A number of Fed officials continued to cite declining oil prices as helping to achieve lower inflation.

Futures for oil prices are down $1 to $2 per barrel from the prior week. For contracts from December 2006 through spring 2008, prices range from $61 to $67 per barrel.
STOCKS
Stocks ended the week up sharply with the Dow setting three consecutive record high closes before edging down on Friday. Declining oil prices were favorable as was the view through Wednesday that the Fed might be cutting rates early in 2007. The week got off to a slow start as technology stocks and a bad September sales report from Wal-Mart pulled equities down on Monday. The Dow set the first record close of the week on Tuesday with lift from blue chips - especially Boeing - and bank stocks. Wednesday provided the sharpest gains as Fed Chairman Bernanke's comments were interpreted as indicating no further interest rate increases. Philly Fed President Plosser's hawkish inflation comments took the edge off of the momentum in equities which still finished up for the third consecutive record close. A number of retailers came out with healthy sales, providing significant lift for the markets. On Friday, employment numbers on healthy wages and lower unemployment stopped the equities' advance with most major indexes down slightly for the day.
For the week, all major equity indexes were up significantly. The Dow was up 1.5 percent; the S&P 500, 1.0 percent; the Nasdaq, 1.8 percent; and the Russell 2000, 2.0 percent.
Year-to-date, the Dow is up 10.6 percent; the S&P 500 up 8.1 percent; the Nasdaq up 4.3 percent; and the Russell 2000 up 9.9 percent.

BONDS
Interest rates dropped early last week but then made a sharp u-turn on Thursday and Friday, ending the week significantly higher. On Monday, a weaker-than-expected ISM manufacturing report and declines in oil prices more than offset a robust construction report. Through Wednesday, comments by Fed officials - including by Bernanke - were interpreted by the markets to mean that the Fed, which is on pause, was headed toward rate cuts soon. Thursday's drop in initial jobless claims along with hawkish comments by new Philly Fed President Plosser sent bond prices down. The unwinding of overbought bond positions also came into play. Friday's jobs report with its seen-as-too-strong wage gains and tight household employment pushed rates even higher.
Net for the week the Treasury yield curve was up from 5 to 8 basis points. The 3-month bill was up 8 basis points; 2-year Treasury note, up 6 basis points; 3-year, up 6 basis points; 5-year, up 6 basis points; 10-year bond, up 7 basis points; and 30-year bond, up 8 basis points.

Markets at a Glance

Weekly percent change column reflects percent changes for all components except interest rates. Interest rate changes are reflected in simple differences.
The Economy
Last week, economic data were mostly soft with some signs of lessening inflation pressures - such as oil prices and prices paid by manufacturers. But strong wage data and a low unemployment rate trumped all of the other numbers for the week.
Employment softens but not as much as headlines
The employment report created a lot of activity for the markets on Friday. Various facets of the report led to a surge in the dollar, a drop in bond prices (rates up), and uncertainty and a roller coaster ride in the equity markets. To fully understand the interaction of the data and the markets, it is useful to start with the question, "What did the markets want from the employment report'" Prior to opening on Friday, the markets had interpreted recent data and Fed speak to mean that the Fed saw enough moderation in its forecast that inflation would be coming down and that the Fed would be cutting fed funds in March and again in June - by 25 basis points each time. All of the markets had priced in assumptions of moderate economic growth and interest rates declining during the first half of 2007. Even the value of the dollar was priced on U.S. rates being cut relative to foreign interest rates. All of this changed with the jobs report.
The headline number looked very weak at first glance but other factors more than offset the first impression of a too weak labor sector. Non-farm payrolls rose a modest 51,000 in September but payroll job gains in August and July were revised up by 60,000 and 2,000, respectively - that is, revised up 62,000 net. Net, the last three months of job growth was about as expected and still moderate.

After realizing that payrolls were not terribly weak, attention turned to wage costs. Monthly gains were a little on the soft side, rising 0.2 percent in both September and in August. But the markets focused on the continuing high year-on-year rate of 4.0 percent in September - the same as in August (after rounding). But September's figure was the highest year-on-year rate since 4.1 percent seen for March 2001. However, the markets likely overreacted to the continued high level for the year-on-year rate. Wages are a lagging indicator and will gradually ease if job growth truly remains soft - but as noted below, this is not certain. But if we continue to get 0.2 percent monthly gains in average hourly earnings, this pace translates into 2.7 percent annualized growth - considerably lower than 4.0 percent.

The labor markets remain tight
What also rattled the bond markets was the fact that the household survey of the jobs market continued to be quite strong. The civilian unemployment rate slipped to 4.6 percent in September from 4.7 percent the prior month. This is the lowest unemployment rate since 4.5 percent in June 2001. Household employment rose a robust 271,000 in September after August's sizeable 250,000 boost.

Household survey still stronger than payroll survey
There continues to be a divergence in growth between household employment and payroll employment. Household employment has grown 93,000 per month more than payroll jobs on average for the first nine months of 2006. Household gains have averaged 230,000 per month this year, compared to 137,000 for payroll jobs. These two series come from two different surveys and that may be behind the differences. But the differences in growth can have different implications for how strong the economy is. Household employment data include the self-employed and this may be where a lot of job growth can be found. This would imply that income growth is stronger than just based on wages and salaries.
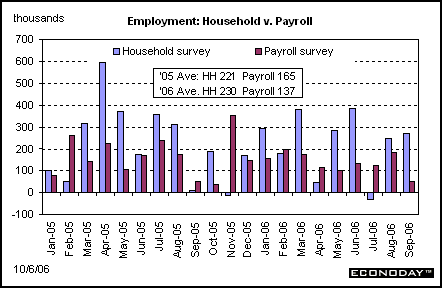
The payroll data also include an assumption by the Bureau of Labor Statistics during the first year of estimation for company "births" and "deaths" - the start up and closing of companies that eventually end up in the BLS's final job counts but are not part of initial estimates. The assumed net growth of establishments could be too low which could be part of the difference between household and payroll job-growth rates. If so, we may find out in a year that the economy was stronger than currently believed.
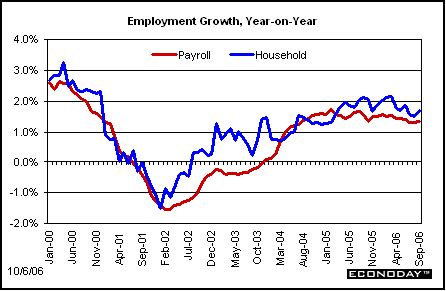
Except for a brief period during 2004, household employment growth has consistently outpaced payroll employment growth during the current expansion. Household employment is up 1.8 percent on a year-on-year basis in September, compared to 1.5 percent in August. Payroll employment is up 1.3 percent on a year-on-year basis in September, unchanged from August.
On a final note regarding the employment picture, initial jobless claims fell a sharp 17,000 for the week ended September 30. This points to a possible rebound in job growth in October - with the caveat that one week's data does not make a trend.
Nonresidential construction quietly offsets residential
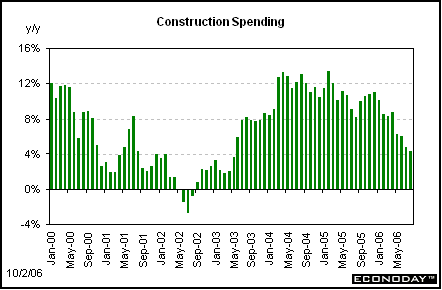
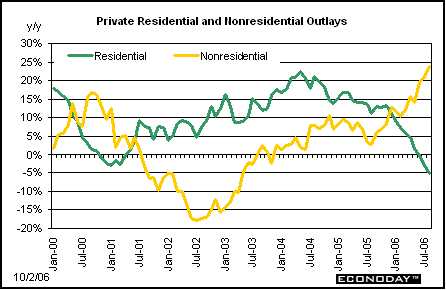
Much has been made of the current decline in the housing sector. But Fed officials increasingly are pointing out that non-residential construction strength is offsetting the weakness in residential construction. And now a number of Fed officials are stating their belief that housing will strengthen in 2007. The latest construction outlays data corroborate these views in terms of showing a strong non-residential sector and a not-too-low point from which a rebound could occur in the residential component. Construction spending rebounded 0.3 percent in August, following a 1.0 percent drop in July. On a year-on-year basis, overall construction outlays are up 4.4 percent in August compared to 4.9 percent the prior month.
In August, private construction spending continued to reflect the trends of declining residential activity and strong growth in the non-residential component. Private residential construction fell 1.5 percent with single-family homes dropping 2.7 percent. Nonresidential construction spending posted a 3.4 percent surge in August, following a 1.3 percent increase in July. Monthly nonresidential gains in August were broad-based with increases seen in lodging, office, commercial, health care, religious, amusement, communication, power, and manufacturing. The educational component was flat while the transportation component declined.
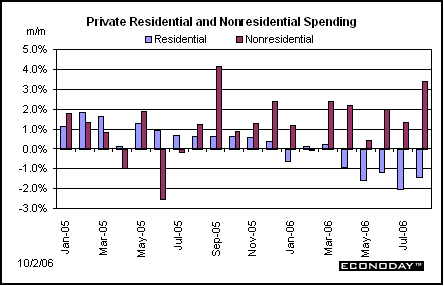
Residential outlays are down 5.2 percent on a year-on-year basis compared to 3.2 percent seen in July. In contrast, nonresidential outlays are up 23.8 percent in August compared to 21.3 percent in July.
ISM shows moderate slowing in manufacturing and other sectors
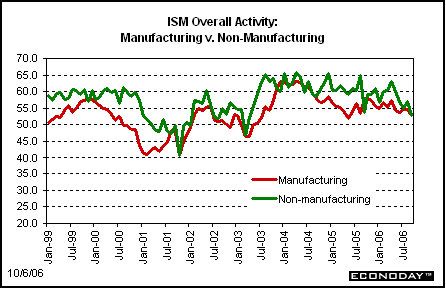
To get the proverbial "soft landing," more than housing has to moderate. Thus far manufacturing has been strong outside of the auto sector and has not contributed to moderation in the economy. However, the most recent report from the Institute for Supply Management (ISM) indicates that there may be a broader slowing in manufacturing than just in the auto industry. The ISM's manufacturing index dipped 1.6 percentage points to 52.9 in September. But the overall number must be tempered by relative strength still seen in new orders - especially export orders. Foreign demand for U.S. capital goods has been quite healthy.
The ISM's non-manufacturing survey showed a sharp deceleration in business activity - which covers construction, mining, and services. The business activity index fell sharply from 57.0 in August to 52.9 in September. However, new orders were strong.
ISM reports point to lessening of inflation pressures
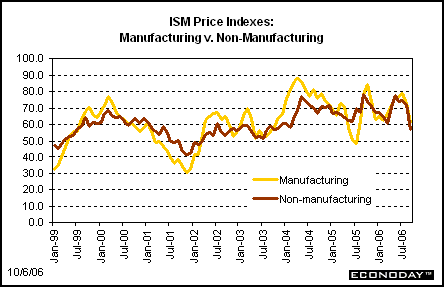
What may be more important from the ISM surveys are the inflation-related data. Both reports have shown sharp declines in their respective indexes for prices paid. For manufacturing, the prices paid index dropped to 61.0 from 73.0 in August. Lower prices were seen in caustic soda, crude oil, gasoline, lumber, natural gas, and natural rubber. The non-manufacturing prices paid index fell 15.7 points to 56.7 from 72.4 in August. Industries reporting a decrease in prices were public administration; management of companies & support services; real estate, rental & leasing; and construction. While these are positive developments in the inflation outlook, they have only a modest impact on their own compared to effects from labor costs and services inflation in general.
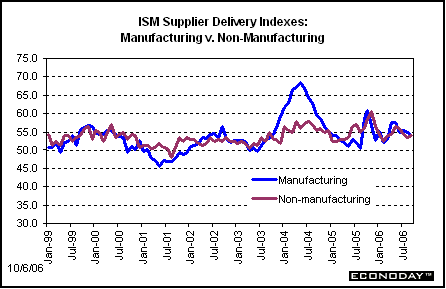
Also, positives in the inflation picture were data from the ISM reports on delivery times. Both the manufacturing and non-manufacturing indexes for supplier deliveries - or vendor performance - remained relatively low, especially for manufacturing. For manufacturing, the supplier deliveries index edged further down to 54.1 in September from 55.0 in August. For non-manufacturing, the supplier deliveries index actually edged up to 54.0 from 53.5 in August but remained notably below recent highs. These numbers for vendor performance indicate that there are few bottlenecks in manufacturing and other industries to boost inflation.
The bottom line
Last week's numbers basically show the economy still on the path for a soft landing. However, the bond market may have been a little too aggressive in assuming that the economy was weakening and that inflation is coming down quickly. Friday's wage numbers and unemployment rate dashed those hopes. Basically, economic growth appears to be on a moderately healthy trend but it likely is going to be the middle to latter part of 2007 before interest rates might come down. And incoming data still have a role to play in helping the Fed to decide that there will be no further interest rate increases.
Looking Ahead: Week of October 9 to October 13
Monday
Columbus Day observed. Stocks and futures markets open.
Wednesday
FOMC minutes are due out Wednesday for the September 20 monetary policy meeting. The Fed left unchanged the federal funds target rate at 5-1/4 percent as expected but left the door open for future interest rate increases. The Fed retained its policy "bias" for seeing the risk of higher inflation outweighing the risk of weak economic growth. Markets will be looking at details of the Fed's internal debate on what economic trends are playing key roles and what incoming economic data might trigger the Fed to move from an anti-inflation bias to a neutral policy stance with somewhat lower short-term interest rates. Traders in the Fed funds futures markets are starting to price in an interest rate cut in spring and another in late summer.
Thursday
Initial jobless claims for the week ended September 30 fell a sharp 17,000 to 302,000 - the lowest level in more than two months. These numbers are a stark contrast to recently soft payroll employment numbers from the Challenger Job Cut report, the ADP employment report, and even Friday's employment situation report. September's employment situation report was based on data prior to the latest claims report. However, the claims numbers do raise the issue of whether labor markets are strengthening, and it certainly is appropriate to paraphrase the economists' expression, "One week does not a trend make." We need to see if last week's improvement continues. The consensus, however, expects initial claims to rebound by 8,000 - but this is still consistent with moderate employment growth.
Jobless Claims Consensus Forecast for 10/7/06: +310,000
Range: +300,000 to +322,000
The U.S. international trade gap jumped to a record $68.0 billion in July from $64.8 billion in June - largely due to an increase in oil imports due to higher oil prices. Also, overall exports edged down after earlier gains. We should expect the recent decline in oil prices to help on the import side of the trade gap equation, but will exports resume healthy growth' The dollar has been favorable and it is too soon for higher interest rates abroad to have reduced foreign demand. The consensus expects the gap to shrink by $1.5 billion in August.
International trade balance Consensus Forecast for August 06: -$66.5 billion
Range: -$68.0 billion to -$65.2 billion
The U.S. Treasury monthly budget report showed a budget deficit for August of $64.6 billion, significantly higher than the budget gap of $51.3 billion in August last year. Nonetheless, on average in recent months the deficit has been shrinking compared to the prior fiscal year due to higher revenues - not just individual income taxes but especially corporate tax receipts. These gains have reflected taxes from capital gains and also higher corporate profits. With the economy slowing, the deficit improvement may be coming to an end in coming months but probably not until late in the year or early 2007. The month of September typically shows a moderate surplus. Over the past 10 years, the average surplus for September is $40.9 billion.
Consensus forecast for U.S. Treasury monthly deficit not available due to small sample size.
The Beige Book prepared just prior to the September 20 FOMC meeting portrayed a mixed economy with declining housing activity but with other sectors generally healthy. Oil price cuts had only just begun to be felt. In light of recent commentary by Fed officials that imply a steady Fed funds rate for now, markets will be looking for any signs that economic moderation is spreading to sectors outside of housing and whether core inflation and inflation expectations are coming down. We will need to see these before the Fed moves from a pause-but-no-change stance to actually cutting interest rates.
Friday
Retail Sales rose 0.2 percent in August, following a 1.4 percent increase in July. Sales numbers have been more volatile than usual in recent months due to swings in gasoline prices in addition to the usual auto sales volatility. Still, underlying sales have been healthy as retail sales excluding both gas stations and motor vehicles rose 0.4 percent in August, following a 0.5 percent boost in July. Recently chain store sales have been decidedly mixed but they tell only a small part of the story for the consumer sector. Is consumer spending beginning to pick up due to more discretionary income after gasoline price declines, or is it weakening from slower overall economic growth' The consensus sees flat sales once autos have been excluded.
Retail sales Consensus Forecast for September 06: +0.2 percent
Range: -0.4 to +0.6 percent
Retail sales excluding motor vehicles Consensus Forecast for September 06: 0.0 percent (flat)
Range: -0.7 to +0.6 percent
Import prices jumped 0.8 percent in August following a 1.0 percent surge in July. Excluding petroleum, import prices were up 0.5 percent in August following no change the prior month. We know oil prices have been declining but will we start to get more help on the inflation front from non-oil import prices' The year-on-year rate for overall imports excluding petroleum is 2.7 percent. For consumer goods excluding autos, the year-on-year rate is 0.7 percent but is actually up from minus 0.3 percent in March and April of this year. Import prices have recently been headed in the wrong direction for the Fed to get help in pulling down core PCE inflation.
Import prices Consensus Forecast for September 06: -0.9 percent
Range: -2.5 to +0.3 percent
The University of Michigan's Consumer sentiment index rose to 85.4 in its final September reading, up from a mid-month posting of 84.4 and from 82.0 in August. Recent oil price declines have had a positive effect as inflation expectations have eased. But the expectations index remains weak. With recent stock market gains and further declines in oil prices, we may see improvement in both current conditions and expectations. The consensus sees continued improvement in consumer sentiment for October.
Consumer sentiment Consensus Forecast for October 06: 86.5
Range: 84.5 to 88.5
Business inventories rose 0.6 percent in July and 7.4 percent year-on-year. More recently, manufacturers' inventories slowed to a 0.4 percent rise in August from a 0.8 percent boost in July and this will help to slow August's overall business inventory growth.
Business inventories Consensus Forecast for July 06: +0.5 percent
Range: +0.4 to +0.6 percent


