Housing remains soft while manufacturing is mixed. Inflation, net, appears to be easing, albeit slowly outside of energy. The markets took in stride the Dow closing over 12,000 on Thursday as the Dow managed to hold above that level after a rocky day Friday.
Recap of US Markets
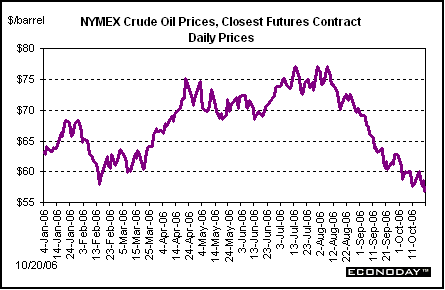
OIL PRICES
Oil prices remain relatively low. Markets remain under downward pressure from excess supply as demand has softened in response to more moderate economic growth in the U.S. The big news is that OPEC is trying to stem the downward pressure by cutting production. The weekend prior to last week, OPEC announced a meeting to determine production cuts with the meeting to be held last Thursday. Markets initially were skeptical that OPEC would reach agreement and this skepticism led prices down early in the week. Talk was that cuts would be 1 million barrels per day. On Thursday, OPEC announced a 1.2 million barrel per day cut. Saudi Arabia - by far the largest member of OPEC in terms of production - announced its support for this cut in production which led to a firming in oil prices last Thursday. Friday, traders reconsidered OPEC's ability to cut production by this amount and decided that members would cheat and actual production reduction would be less and prices fell sharply on Friday. Prices for West Texas intermediate ended the week at $56.82 per barrel - a new low for 2006 and the lowest in 11 months.
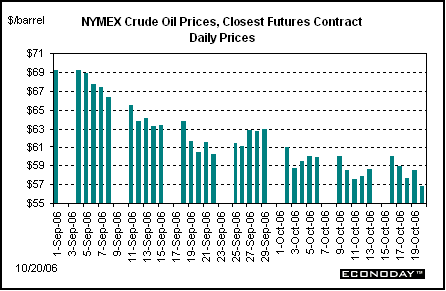
Oil prices remain sharply below highs seen this past August and are helping pull down overall inflation.
STOCKS
Stocks were mixed over the week with the large caps generally healthy and led by the Dow topping the 12,000 level. Techs were down sharply while small caps were flat overall. All major indexes rose on Monday. Earnings reports were generally positive and moderate numbers in the Empire State manufacturing index relieved concerns over a hard landing. Higher oil prices were partly offsetting. Tuesday's strong core PPI number and weak industrial production figure led stocks down across the board. Intel and Goldman Sachs earnings weighed on stocks while Johnson & Johnson and Merrill Lynch provided some positive impetus. The Dow set an intraday high on Wednesday, crossing the 12,000 level. Other than for techs, it was a positive day. The core CPI met expectations for a moderate figure while the overall CPI was much lower than expected due to lower gasoline prices. Oil fell below $58 per barrel, boosting stocks outside of energy. Techs were mixed but down overall as Yahoo and Motorola underperformed while Intel and IBM beat expectations. On Thursday, the Dow closed over 12,000 for the first time. Earnings were the main impetus although economic reports played a minor role. Apple earnings came out very strong while Hewlett-Packard and eBay were quite healthy. AMD and Dell came in below expectations. For economic data, the Philadelphia Fed manufacturing report was mixed with a negative overall index number but with orders rebounding. The initial jobless claims data were notably positive, keeping the markets focused on the more likely soft landing scenario. Friday, the large caps fought off the negative effects from a huge negative surprise from Caterpillar. Caterpillar pulled the Dow down initially as this major component fell in the low double digits. Caterpillar indicated that a slow housing market and higher expenses cut into profits significantly and it reduced guidance. Caterpillar's decline alone cut about 70 points off the Dow on Friday. However, partially offsetting were Merck, 3M, and Google. Merck's earnings were down but less than expected while 3M and Google were healthy. The Dow fought back and ended the week just barely back over the 12,000 mark.
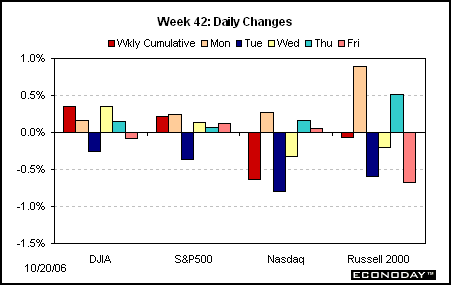
For the week, the Dow and S&P 500 were up 0.3 percent and 0.2 percent, respectively. The Nasdaq and Russell 2000 were down 0.6 percent and 0.1 percent, respectively. Year-to-date, the Dow is up 12.0 percent; the S&P 500 up 9.6 percent; the Nasdaq up 6.2 percent; and the Russell 2000 up 13.2 percent.
BONDS
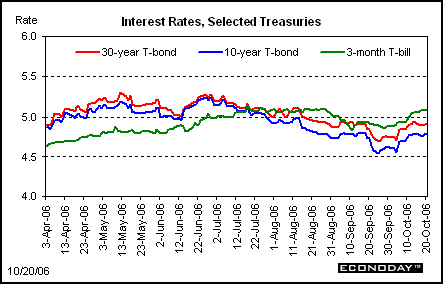
Interest rates ended the week little changed overall. The biggest movement occurred on Wednesday when rates eased marginally in reaction to the favorable CPI report. Also, despite statements by OPEC members that they intended to cut production, markets discounted their ability to do so and oil prices softened and also supported bond prices. Rates reversed on Thursday when Saudi oil officials stated that they supported a 1 million barrel per day cut in OPEC production. The positive initial claims report also helped to firm interest rates.
Net for the week the Treasury yield curve was up marginally on the short end and down incrementally on the long end. The 3-month bill was up 3 basis points; 2-year Treasury note, up 1 basis point; 3-year, up 1 basis point; 5-year, unchanged; 10-year bond, down 1 basis point; and 30-year bond, down 3 basis points.
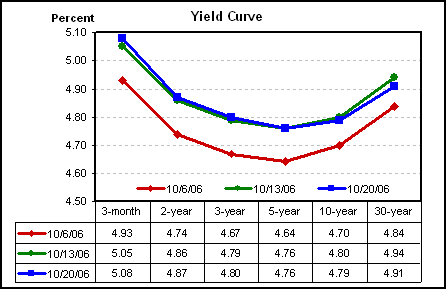
The yield curve remains inverted with long rates having fallen while the Fed pushed short rates up. Clearly, some of the drop in long-term rates reflects a decline in inflation expectations - not merely a decline in demand.
Markets at a Glance
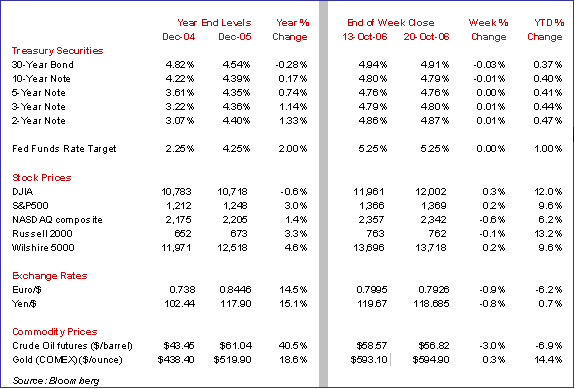
Weekly percent change column reflects percent changes for all components except interest rates. Interest rate changes are reflected in simple differences.
The Economy
Last week the economic data were a little bumpy but as a whole they pointed to a continuation of a soft landing.
Producer prices mixed, pressure shifting to business equipment
The first inflation report for the week - the PPI - gave the markets pause over what is the true trend in inflation. The headline number was very weak due to falling oil prices while the core number surprised on the upside. The markets were quite happy with the 1.3 percent drop in overall producer prices but were quite concerned over the 0.6 percent rise in the core rate after a 0.1 percent rise in August. However, closer examination of core details indicated that the September spike was mostly isolated to motor vehicles.

Indeed, falling oil prices are now heavily affecting headline inflation numbers. Energy costs fell 8.4 percent in September, with the gasoline component dropping a whopping 22.2 percent. Excluding energy prices, the PPI jumped 0.6 percent in September, following a 0.1 percent rise in August.
But the ex-energy price increases were primarily in passenger cars which rebounded 2.8 percent, following a 2.6 percent drop in August. Given the weakness in sales in the auto industry, no one expects these prices to hold. Food prices also posted a sharp increase, rising 0.7 percent, following a 1.4 percent boost the prior month. Food gains were led by pork, fish, dairy, fresh & dried vegetables, and processed fruits & vegetables. These gains are believed to be temporary.
But the overlooked story from last week's PPI report was the strength seen in the capital equipment component of the finished goods PPI, which rose 0.6 percent following a 0.3 percent decline in August. This component also has a motor vehicles subcomponent for light and also for heavy trucks. Light trucks jumped 3.5 percent, following a 3.4 percent drop in August. But the capital equipment component showed strength in other components - including pumps & compressors, printing machinery, transformers, and railroad equipment. Outside of computers and motor vehicles, most capital equipment components are running healthy year-on-year growth rates, indicating robust demand.
On the other hand, the consumer sector really is showing some softer numbers once the aberrant motor vehicle numbers are discounted along with temporarily strong food. So, we may be seeing a shift in inflation in the economy from the consumer sector to the business sector.
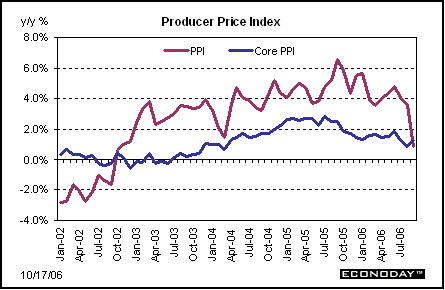
The year-on-year core rate jumped to 1.2 percent in September from 0.9 percent in August. The year-on-year rate for the overall PPI dropped to a 0.9 increase, compared to a 3.7 percent rate in August.
Prices at lower levels of production indicate reduced prices pressures overall. Overall prices at the crude level of production dropped 3.4 percent, following a 2.2 percent boost in August. Prices at the intermediate level slipped 1.4 percent following a 0.4 percent gain in August. On a year-on-year basis, crude PPI inflation stood at minus 7.8 percent, down sharply from a positive 5.3 percent in August. Meanwhile, the intermediate PPI on a year-on-year basis is at 4.7 percent, down from 8.8 percent in August.
Consumer prices please markets, Fed probably pulls out microscope
While the PPI caused the markets to pause over the meaning of the core numbers, the CPI report was a crowd pleaser. The headline number came in much lower than expected while the core figure met expectations for a moderate number. Equities loved it and the bond markets were content to have met expectations - especially after the strong core PPI the day before. Overall consumer price inflation dropped 0.5 percent in September, following a 0.2 percent rise in August. The September CPI was the sharpest decline since the 0.7 percent drop in November 2005. The core CPI rose a moderate 0.2 percent gain in September - same as in August.
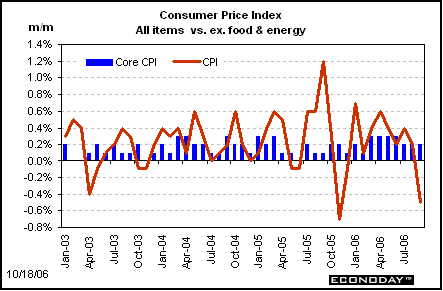
By expenditure components, transportation fell 4.1 percent, reflecting primarily lower gasoline prices but also a slight decline in prices for new motor vehicles. Gasoline prices were down 13.5 while new vehicles slipped 0.1 percent and use cars & trucks fell 1.0 percent. Airline fares declined 2.3 percent. However, most major expenditure categories actually rose. If energy and other transportation components are discounted, there are still notable signs of inflation pressures. Apparel showed the strong gain, up 0.6 percent in September. Other gains were food & beverage, up 0.4 percent; housing, up 0.3 percent; medical, up 0.3 percent; education & communication, up 0.1; and "other," up 0.5 percent. Recreation was flat.
While the markets were celebrating the moderate core number, the Fed probably was looking at the detail and noting the strength still in the numbers outside of energy and motor vehicles. Today's report will not change the views of Fed officials who have been making recent hawkish comments.
Year-on-year core inflation growth edged up to 2.9 percent from August's 2.8 percent figure. The overall CPI's year-on-year growth rate fell to 2.1 percent from 3.8 percent in August.
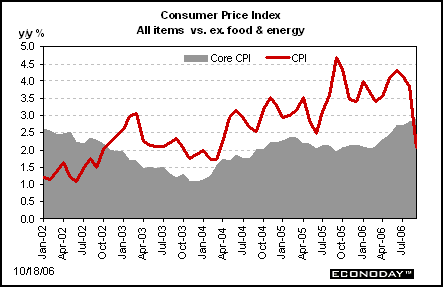
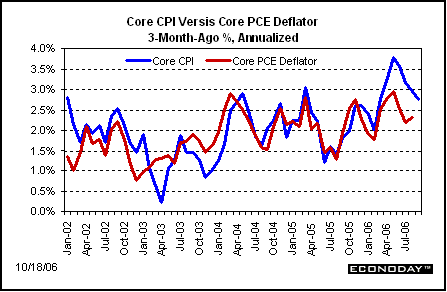
The core CPI has made notable progress on the margin in recent months with the trend rate now down to about 2-3/4 percent annualized. This still is above the Fed's implicit target range of 1 to 2 percent for the core PCE deflator. The equivalent for the CPI is about 1/4 percentage point higher.
Manufacturing softens
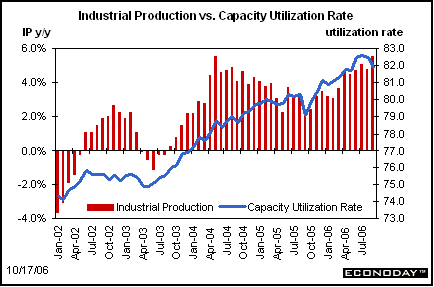
The manufacturing sector has helped to keep economic growth healthy while housing has been pulling growth down. But in September manufacturing also joined the negative column, sending jitters to equity markets. Overall industrial production fell 0.6 percent in September, following no change in August. By components, manufacturing fell 0.3 in September, following a 0.2 percent boost in August (non-NAICS basis). Mining output rebounded 0.7 percent while utilities output dropped 4.4 percent in September. Overall industrial output is up 5.6 percent year-on-year while manufacturing output is up 5.9 percent.
Weakness in manufacturing was broad-based but led by in durables, which fell 0.4 percent in September. Durables' weakness was led by motor vehicles, furniture, and electrical equipment. Nondurables also declined, by 0.2 percent in both September and August. Weakness was not quite as broad-based as for durables. Some strength was seen in petroleum products, food & tobacco, and in printing.
The biggest bright spot - if it can be called that - was the decline in capacity utilization which is seen as reducing inflation pressures. Overall capacity utilization in September dropped to 81.9 percent from 82.5 percent in August. For manufacturing, capacity utilization fell to 80.8 percent in September from 81.2 percent in August. This rate is still well above the latest recession trough of 72.0 percent in November 2001.
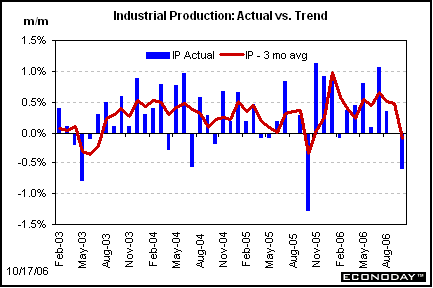
Overall industrial output is up 5.6 percent year-on-year while manufacturing output is up 5.9 percent.
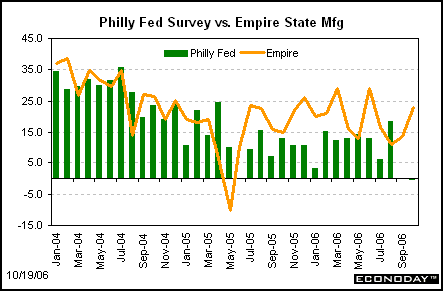
New York and Philadelphia Fed manufacturing surveys point to mild rebound
In contrast to the September industrial production report, the Empire State index showed firming in manufacturing in October with a surge to 22.9 from 13.8 in September. Looking forward, however, new orders moderated slightly at 11.8 compared to 14.0 in September and 19.8 in August. The October new orders figure is still moderately positive. However, unfilled orders turned slightly negative in October, slipping to -1.5 from. 2.3. The dip in unfilled orders, however, may have just been a timing issue. Shipments were strong in October at 22.5 in October compared to 20.6 in September.
The Philly Fed survey, however, showed weak current production but improved orders. The business activity index came in at -0.7 percent in October - the second consecutive negative number with September's reading of -0.4 percent. However, sub-indexes were notably stronger and suggest a mild pick up in momentum. The new orders index rebounded sharply to 13.4 from -1.3 while shipments jumped to 5.3 from -6.8 in August.
Both Fed surveys were mixed but on a net basis suggest some mild improvement in industrial production from September's decline.
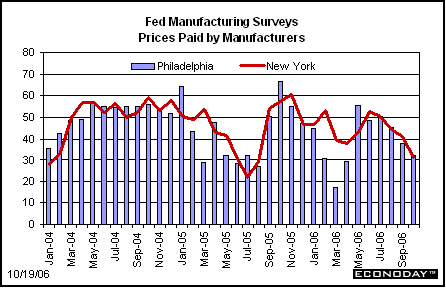
Fed manufacturing surveys show lower prices paid but not much change in prices received
Both the Empire and Philly Fed surveys showed declines in prices paid indexes. The Empire prices paid dropped to 30.8 in October from 41.0 in September. October's number was the lowest since 29.0 in August 2005. The Philly prices paid index declined to 32.0 in October from 38.1 in September. Both indexes appear to reflect lower prices for oil and other commodities.
Prices received were mixed as the Empire State index rose to 17.5 from 16.0 in September. The Philly prices received index slipped to 17.8 from 21.6 in September. Both surveys have had a relatively steady range for the prices received index at moderately positive levels.
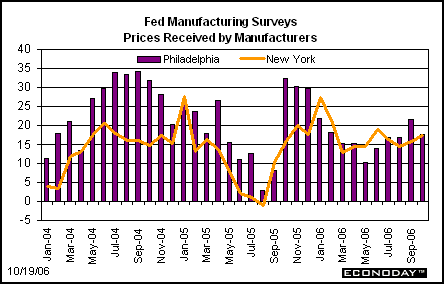
The prices received numbers are consistent with the PPI numbers for capital equipment that are showing upward price pressure.
Housing starts jump but permits are pulling housing down - at least for now
Last week's housing report was mixed with starts rebounding in September with a 5.9 percent jump, following a 4.9 percent drop in August. September's starts rose to an annualized pace of 1.772 million units from August's revised 1.674 million unit pace. Markets actually chose to focus on permits - which they rarely do. Housing permits fell 6.3 percent in September following a 2.0 percent dip in August. Analysts pointed to the "fact" that permits lead starts. However, this is only marginally true - most starts take place the same month a permit is issued. Only a small portion of permits issued are started in a later month due to the cost of waiting by builders.
The illusion of strength in the starts figure is exposed in the detail. September's strength was primarily in multifamily units although single-family starts also rose. Single-family starts rose 4.3 percent while multifamily units jumped 12.7 percent in September. Most likely favorable weather led to an increase in multifamily starts, a rise that does not reflect a true rebound in overall housing.
Regionally for starts, the South was strongest with a 14.0 percent boost in starts, followed by the Midwest with a 3.4 percent increase. Starts fell in the Northeast and West with declines of 14.1 percent and 2.2 percent, respectively.
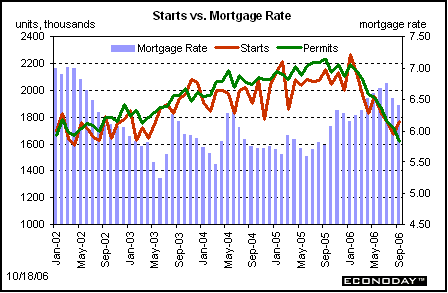
Despite the apparent underlying weakness in the latest housing report, the housing sector is likely near its trough. The mortgage bankers' purchase index edged up from the prior week's drop, up 0.4 percent to 384.7 in the Oct. 13 week. The gain was not due to refinancing as the refinancing index fell. Levels are not making major gains but seem to be more leveling off on average. Interest rates have firmed in recent weeks but only marginally. Conventional mortgage rates are running in the 6.35 percent vicinity. This compares to 6-3/4 percent this past summer and 8-1/2 percent during 2000. If employment firms moderately as suggested by recent initial claims data, then we could be seeing a leveling off in housing soon.

Starts are down 17.9 percent on a year-on-year basis with single-family starts down 32.1 percent. Overall permits are down 27.7 percent from September 2005 levels.
The bottom line
The economy still appears to be on a soft landing. Lower oil prices clearly are helping but the economy seems stronger than what either the markets or the Fed had been projecting just a few weeks ago. For now, the Fed seems cautiously content to see if current interest rates will achieve the soft landing. Certainly, the Fed is not leaning to cut rates immediately but the current strength in the economy leaves room for further gains in equities even without immediately pending rate cuts.
The markets continue to hold their recent position that the Fed will not be cutting interest rates before June of next year. The implied fed fund rates in the futures market has come down only incrementally after jumping earlier this month. There still is a notable minority that believes the Fed will still have to raise interest rates further to bring inflation down to its target range.
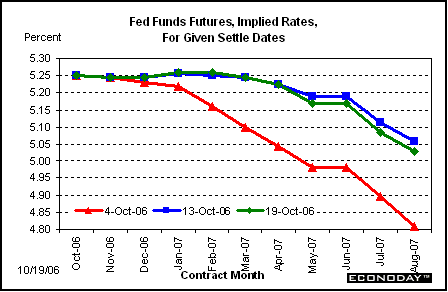
The implied fed funds futures rate is essentially a weighted average of the rates that the participants believe will exist for a given settle date. Simplistically, an implied rate that is halfway between two possible Fed targets (such as between 5 and 5-1/4 percent) implies equal odds for no change or a cut to 5 percent.
Looking Ahead: Week of October 23 to October 27
Wednesday
Existing home sales fell 0.5 percent in August to an annualized 6.30 million rate from 6.33 million in July. Sales have been declining from a record high of 7.27 million in June 2005. Sales are now down 12.6 percent from a year ago. Last week's rise in housing starts but decline in permits have muddied the water somewhat in terms of whether housing has bottomed out or not. While the sales figure is important, the inventory numbers are going to be just as important since housing is not going to bottom until inventories are lean. In August, supplies of existing homes rose to 7.5 months -- the highest in 13 years. There are other signs that housing may be soon firming or at least leveling off. Mortgage rates have been easing in recent weeks and the NAHB housing market index ended eight straight declines, rising to 31 in October from 30 in September. But markets will be closely watching the home sales and inventories numbers to see what they add to the housing picture.
Existing home sales Consensus Forecast for September 06: 6.20 million-unit rate
Range: 6.0 to 6.35 million-unit rate
FOMC statement
The FOMC meets again on October 25. During the last two monetary policy meetings, the Fed left the fed funds interest rate target unchanged at 5-1/4 percent, following 17 consecutive increases. The Fed continues to emphasize that risks are balanced between both inflation that does not decline enough and economic growth that may slow too much. Recently, more FOMC members have emphasized the importance of bringing inflation down and the upside risks on inflation even though markets have discounted any interest rate increases. Markets instead assume that fed funds will remain steady through June 2007. While few expect any interest rate change out of this meeting, markets will be looking to see if there is any change in the policy "bias" in the post-meeting statement. It is almost certain that the Fed will not lower interest rates until the FOMC first removes the inflation concern bias. That is, the Fed will likely announce seeing balanced risks in its statement one meeting before cutting the fed funds rate. Essentially, the first concrete sign for pending lower interest rates from the Fed is an FOMC meeting announcement with the elimination of the inflation bias in the statement. Given recent comments from Fed members, that is not likely to happen this meeting.
Fed funds target rate for October 25, 06: no change at 5-1/4 percent
Range: 5 to 5-1/2 percent
Thursday
Initial jobless claims fell 10,000 in the Oct. 14 week to 299,000, the first sub-300,000 reading in nearly three months. Based on initial claims, the labor market has been firming in recent weeks - a positive for economic growth and good for income growth and support for equities. If initial claims remain moderately low, that will should lead to a rebound in employment growth and take away much of the ammunition for those claiming the soft landing has turned into a hard landing.
Jobless Claims Consensus Forecast for 10/21/06: +305,000
Range: +298,000 to +315,000
Durable goods orders were flat in August after falling 2.8 percent in July. Weakness has been led by aircraft orders. More recently, regional manufacturing surveys and the ISM survey were mixed as the Philadelphia Fed manufacturing survey showed a rebound in October in both current new orders and new orders six months out while the New York Fed's survey reported mild slowing (still positive) in new orders.
New orders for durable goods Consensus Forecast for September 06: +2.2 percent
Range: +0.5 percent to +5.5 percent
New home sales rose 4.1 percent in August to an annualized rate of 1.050 million. Inventory overhang is still a concern even though supply slipped to 6.6 months from 7.0 months in July. As with existing home sales, the markets will be watching both the sales pace and the inventory numbers.
New home sales Consensus Forecast for September 06: 1.050 million-unit rate
Range: 0.900 million to 1.070 million-unit rate
Friday
Second quarter real GDP posted a 2.6 percent increase, following a sharp 5.6 percent jump in the first quarter. The Fed has been indicating that the economy needs to slow somewhat below potential growth before inflation will ease to below 2 percent for the core PCE deflator. Since the Fed has noted that it has lowered its estimates for potential GDP growth, potential GDP now is likely seen to be in the 2-1/2 to 3 percent range. This means the Fed hopes to see GDP growth a little below 2-1/2 percent. The markets do expect below potential growth - at least for the third quarter.
Real GDP Consensus Forecast for advance Q3 06: 2.0 percent annual rate
Range: 1.2 to 2.6 percent annual rate
GDP deflator Consensus Forecast for advance Q3 06: 2.9 percent annual rate
Range: 2.0 to 3.9 percent annual rate
The University of Michigan's Consumer sentiment index jumped to 92.3 in mid-October from 85.4 in September, likely reflecting lower gasoline prices and the continued up trend in the stock market. The markets and the Fed will be watching confidence numbers since that is a factor in the strength of consumer spending and whether we get a soft landing or hard landing. Also, the inflation expectations numbers will get some attention since the Fed is concerned that higher inflation expectations not become embedded. One-year inflation expectations edged down to 2.9 percent in mid-October from 3.1 percent last month and as high as 4.2 percent in August.
Consumer sentiment Consensus Forecast for October 06: 92.4
Range: 89.0 to 93.0

