The highlight of the week was the largely unexpected take over of both the U.S. House and Senate by the Democratic Party. Markets had already built in a party switch in the House but not in the Senate. While there were some moderate shifts in equity prices for individual companies, the primary reaction was that market-moving legislation will not occur over the next two years due to gridlock between the Democratic leadership in Congress and the Republican White House. Overall, markets focused on the current trends in the economy and mostly liked what they saw. Equities continued upward as did bond prices. The negative was a continuation in a downtrend for the dollar.
Recap of US Markets
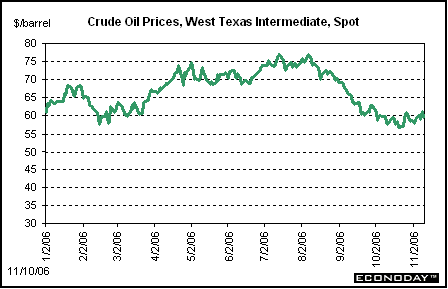
OIL PRICES
Oil prices were choppy during the week but ended slightly higher. Hawkish talk by the Saudis bumped prices up Monday only to see them fall on Tuesday due to contradictory comments by the Kuwaiti oil minister to push them down. Low inventory data lifted prices near $60 per barrel on Wednesday and prices rose further on Thursday due to promises by OPEC to cut production. Friday, however, the International Energy Agency lowered its forecast for world energy demand due to slowing economic growth in China. The revision to the growth rate for this year was small - from 1.2 percent growth to 1.1 percent - but was enough to force markets to reevaluate and bring prices down. Spot prices fell a sharp $1.57 per barrel to close at $59.59. Net, spot prices for West Texas Intermediate ended the week up a modest 45 cents per barrel.
STOCKS
Equities continued upward through Wednesday as markets believed that gridlock between Congress and the White House would be good for the economy - in the apparent belief that legislation is usually harmful to the business community overall. Early in the week, merger & acquisition talk boosted a number of stocks - notably Four Seasons Hotels with talk that Bill Gates is an interested buyer. The Dow got a big boost Tuesday when FedEx cancelled its order for 10 Airbus aircraft and announced it would buy 15 Boeing aircraft instead. Wednesday's gains were led by the energy sector, boosted by a rise in oil prices. The resignation of Defense Secretary Rumsfeld also provided a modest lift to stocks overall late Wednesday. The technical sector was strong most of the week as Cisco jumped early in the week before earnings were reported. Apple, Intel, Oracle, and Yahoo! helped boost the technical sector. Financials were also healthy during the week.
The Dow set record highs through Wednesday before retracing on Thursday. All major indexes followed a similar pattern. Stocks fell back Thursday partly on profit taking. However, industries that were seen to be negatively affected by the Democratic congressional win included defense, health care, pharmaceuticals, and telecoms. These sectors fell Wednesday and Thursday but only on Thursday did their weakness outweigh gains. Key stocks that were down included Merck, Johnson & Johnson, Pfizer, Verizon, AT&T, Northrop Grumman, Lockheed Martin, and Raytheon.
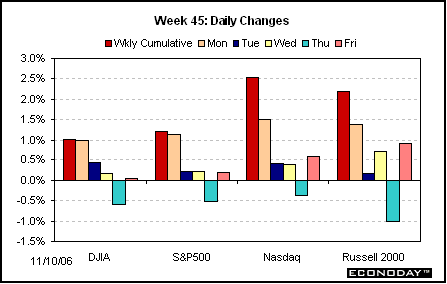
For the week, all major indexes were up significantly: the Dow, up 1.0 percent; the S&P 500, up 1.2 percent; the Nasdaq, up 2.5 percent; and the Russell 2000, up 2.2 percent. Year-to-date, the Dow is up 13.0 percent; the S&P 500 up 10.6 percent; the Nasdaq up 8.4 percent; and the Russell 2000 up 14.2 percent.
BONDS
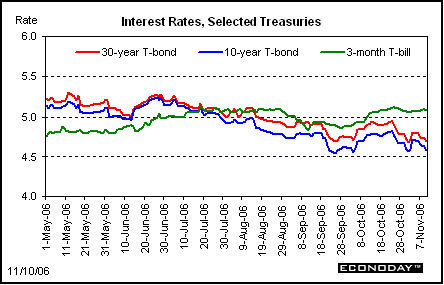
Interest rates declined through all of last week except for the short end which was steady. Rates eased as the market concluded that the split in control of government at the federal level would lead to more disciplined fiscal policy. Defense Secretary Rumsfeld resignation not only provided lift to equities but also to bond prices late Wednesday. Other than commodity prices, the only notable economic news during the weak was for monthly international trade and import prices. While both were favorable, they had little impact on the bond market. Longer rates fell moderately on Friday on concerns of a weak economy. These concerns were merely a change in sentiment without any real catalyst from economic data. Rates fell, in fact, in the face of a declining dollar. The dollar weakened notably at week's end after it was reported that China's central bank would be diversifying its holdings of foreign currencies.
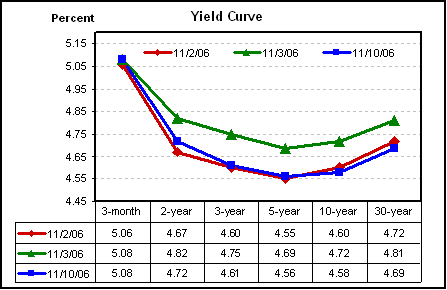
Net for the week the Treasury yield curve is down except on the short end. Longer yields are down notably. Notes and bond yields declined as follows; 2-year Treasury note, down 10 basis points; 3-year, down 14 basis points; 5-year, down 13 basis points; the 10-year bond, down 14 basis points; and the 30-year bond, down 12 basis points. The 3-month Treasury bill was unchanged.
Except on the short end, rates fell noticeably over last week.
Markets at a Glance
Weekly percent change column reflects percent changes for all components except interest rates. Interest rate changes are reflected in simple differences.
The Economy
Last week had a very light schedule for economic releases. The only major indicators were for international trade and for import prices. Both reports were favorable net.
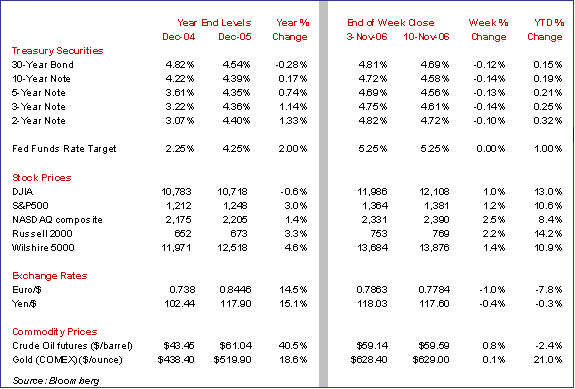
Oil price cuts, export gains narrow trade deficit
The U.S. economy got a boost from the trade sector in September as lower oil prices pulled imports down while exports resumed their upward trend. The U.S. trade gap narrowed to $64.3 billion in September from the record high revised $69.0 billion set in August. The decrease in the trade gap was primarily due to a drop in imports, but exports also posted a moderately strong gain. Importantly, the trade sector appears to be less of a drag on the economy, and if the trend continues it will help boost economic growth in the fourth quarter.
For September 2006, overall exports rose 0.5 percent, following a 2.4 percent jump in August. Overall imports fell 2.1 percent in September, following a 2.0 percent increase the previous month. The merchandise trade gap (Census basis) narrowed to $68.5 billion from a revised record $73.2 billion shortfall in August. Lower oil imports helped narrow the trade gap as the oil trade deficit fell sharply in September to $22.7 billion from $26.8 billion in August.
On a year-on-year basis, exports are up 15.8 percent in September from 13.5 percent in August while imports are up 9.4 percent, down from 14.9 percent in August.
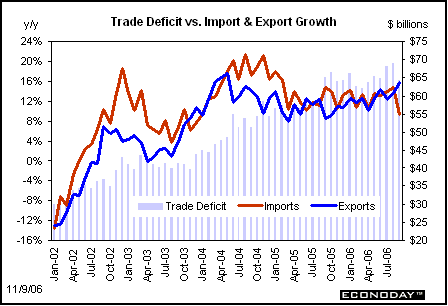
Exports continue on an uptrend with major components healthy for the year. Continued weakness in the dollar should help sustain further export growth. On a percentage basis, the "other goods" category is leading the way with a 19 percent cumulative gain from 2005. This includes many items brought into the country by individuals. This is a small component by dollar value. Importantly, capital goods have been strong with a 15 percent yearly gain, led by subcomponents such as aircraft, semiconductors, industrial machines, electric apparatus, and telecommunications equipment among others. Capital equipment exports have been very robust.
In the latest month, merchandise exports were led by industrial supplies and capital goods. On the import side, merchandise imports declines were led by industrial supplies including oil, capital goods, and autos. Consumer goods excluding autos posted a gain.
Turning to bilateral data, the U.S. largest bilateral deficit is with China which continued to rise, from $22.0 billion in August to $23.0 billion in September. September's gap with China is a record high. Much of the deficit with China is seasonal as imports spike in the fall as retailers prepare for the holiday season. As such, the wider gap can be seen as a sign of optimism by U.S. businesses that consumers will be spending this holiday season. Finally, as a result of lower oil prices, the trade shortfall with OPEC dropped to $9.2 billion from $11.2 billion in August. Bilateral trade data are not seasonally adjusted.
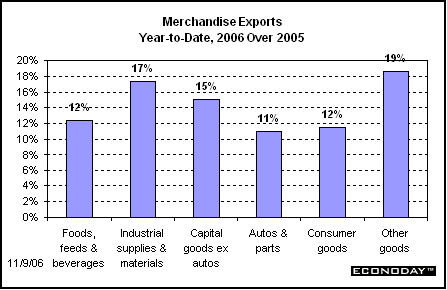
Import prices are finally helping to ease overall inflation
Lower oil prices pulled import prices down 2.0 percent in October. Meanwhile, non-petroleum import prices also declined, by 0.6 percent. The volatile petroleum component dropped a sharp 8.3 percent following a 9.7 percent drop in September. By end-use categories, October weakness was primarily in industrial supplies & materials, down 5.6 percent and that includes petroleum. Even excluding petroleum, industrial supplies & materials were weak with a 2.7 percent drop in October. Capital goods prices edged down 0.1 percent while consumer goods excluding autos rose 0.1 percent. Auto import prices rose 0.3 percent. Export prices were also declined 0.4 percent. The latest import prices report is a clear positive for the inflation outlook.
Year-on-year rates have been coming down. Overall import prices are down 0.2 percent, compared to up 1.9 percent in September. Petroleum imports prices are now down 2.9 percent on a year-on-year basis in October from plus 2.6 percent the prior month while non-petroleum import prices fell to a 0.5 percent gain from 2.0 percent in September.
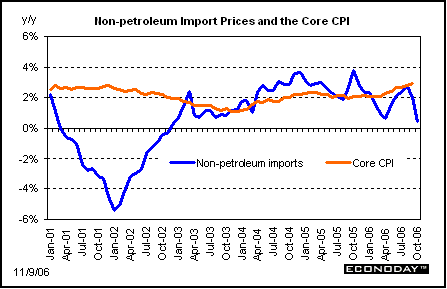
There are beginning to be signs that import prices could help ease core CPI growth. However, the recent declines in the dollar could reverse some of the recent weakness in import prices.
The bottom line
The markets have taken the sweeping changes in the U.S. political landscape mostly in stride. Moderate price shifts have been and will likely continue in defense, pharmaceuticals, telecommunications, and health care as the administration and Congress argue for likely small changes in policy at worst. Otherwise, the economy remains moderately healthy. Next week provides a slew of economic indicators for the markets and the Fed to digest - especially the PPI and CPI data that will update our view of inflation trends. Two key areas do remain for inflation improvement - wage costs and the housing component in the CPI. We will get another look at that CPI component this week.
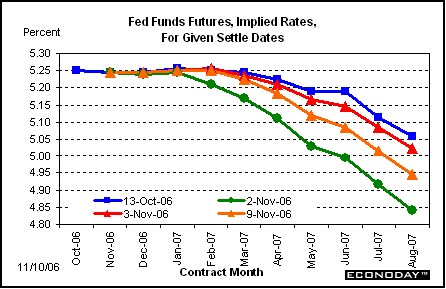
Last week's mood swing by the markets on interest rates also pulled fed funds futures rates down somewhat. Markets are now expecting a 25 basis point rate cut by the Fed by June next year and there are about 50/50 odds for a cut as soon as May of 2007.
Looking Ahead: Week of November 13 to November 17
Monday
The U.S. Treasury monthly budget report showed a surplus of $56.0 billion in September. The surplus was partly due to gains in individual and corporate taxes, up 11.8 percent from a year ago. October typically shows a moderate deficit for the month. Over the last 10 years, October's deficit has averaged $38.3 billion.
Treasury Statement Consensus Forecast for October 06: -$49.0 billion
Range: -$50.0 billion to -$48 billion.
Tuesday
Retail Sales in September were much stronger than the headline number. Nominal sales fell 0.4 percent in September, following a 0.1 percent increase in August with the September decline caused by a drop in gasoline sales due to lower prices. Excluding motor vehicles, retail sales dropped 0.5 percent in September, but excluding both gas station and motor vehicle components, sales increased a robust 0.8 percent in September. We will have to look for similar gasoline price effects in October sales numbers to see what the underlying trend is and immediately look beyond the headline for these core numbers.
Retail sales Consensus Forecast for October 06: -0.4 percent
Range: -0.9 to +0.1 percent
Retail sales excluding motor vehicles Consensus Forecast for October: -0.3 percent
Range: -0.9 to +0.1 percent
The producer price index in September came in with a very favorable headline number but there were significant hot spots. Overall producer prices fell 1.3 percent in September, while the core rate rebounded sharply with a 0.6 percent boost in September. Overall weakness was led by declining energy costs, including a monthly 22.2 percent drop in gasoline prices. Two of the stronger components were for passenger vehicles and for light trucks in the capital equipment component. We may see a reversal or at least softening of those numbers. Still, capital equipment prices have been firm and bear watching.
PPI Consensus Forecast for October 06: -0.6 percent
Range: -0.8 to -0.3 percent
PPI ex food & energy Consensus Forecast for October 06: +0.2 percent
Range: +0.1 to +0.2 percent
Business inventories rose 0.6 percent in August - a moderately healthy pace, slightly down from a 0.7 percent rise in July. With the economy slowing, we will need to see if any notable inventory overhang is developing. Any significant overhand could turn the soft landing into a hard landing if producers have to cut back sharply on production. That currently does not appear to be the case.
Business inventories Consensus Forecast for September 06: +0.6 percent
Range: +0.3 to +0.8 percent
Wednesday
The Empire State manufacturing index came in with a strong headline number in October with a jump to 22.9 in from 13.8 in September. Underlying numbers were mixed as new orders decelerated and unfilled orders actually turned negative while the number of employees and shipments indexes rose. The survey's price indexes will get market attention, given the issue of whether inflation is coming down enough to suit the Fed. Last month, prices received were steady while prices paid moderated significantly.
Empire State Manufacturing Survey Consensus Forecast for November 06: 15.0
Range: 13.0 to 17.5
Thursday
The consumer price index received a favorable bump down from lower oil prices in September as the overall index fell 0.5 percent, following a 0.2 percent rise in August. September's overall figure came below the consensus expectation for a 0.3 percent decline. The core CPI rose 0.2 percent in September - the same as in August. While the report had some favorable numbers, the core rate is still sticking too high as the year-on-year core inflation growth actually edged up to 2.9 percent from August's 2.8 percent figure. With recently the strong employment cost index, unit labor costs, and average hourly earnings, Fed official continue to say that further interest rate increases have not been ruled out. A core CPI figure below 0.2 or at least an upwardly rounded 0.2 percent figure would help allay concerns of delays in the Fed cutting interest rates next year.
CPI Consensus Forecast for October 06: -0.3 percent
Range: -0.5 to -0.1 percent
CPI ex food & energy Consensus Forecast for October 06: +0.2 percent
Range: +0.2 to +0.3 percent
Initial jobless claims fell a sharp 20,000 to 308,000 in the November 4 week, indicating that labor markets remain firm even though absolute job gains have been moderate. The tight labor market numbers are another reason the Fed does not appear to be in a hurry to cut interest rates.
Jobless Claims Consensus Forecast for 9/9/06: 310,000
Range: 300,000 to 325,000
Industrial production fell 0.6 percent in September, following no change in August. Most of the weakness was in utilities (down 4.4 percent) but the important manufacturing component declined 0.3 in September and was led downward by the durables component. More recently from the employment situation report, aggregate production hours in manufacturing were flat in October, suggesting further softness in manufacturing.
Industrial production Consensus Forecast for October: +0.2 percent
Range: -0.2 to +0.4 percent
Capacity utilization Consensus Forecast for October 06: 82.0 percent
Range: 81.8 to 82.2 percent
The general business conditions component of the Philadelphia Fed's business outlook survey index posted two weak months in a row with its headline number coming in at -0.7 in October after a September reading of -0.4. Individual activity indexes were not as weak as new orders rebounded to 13.4 from -1.3 and shipments rose to 5.3 vs. -6.8.
Philadelphia Fed survey Consensus Forecast for November 06: 5.0
Range: -1.0 to 10.0
Friday
Housing starts got a boost in September from the multifamily component as overall starts rebounded with a 5.9 percent jump, following a 4.9 percent drop in August. Single-family starts rose 4.3 percent while multifamily units jumped 12.7 percent in September. However, September's 1.772 million unit pace was down 17.9 percent on a year-on-year basis. However, even though starts rose in September, permits fell 6.3 percent in September. Most likely, the permit series is more reflective of the true trend in housing, and starts will likely dip in October - especially if we get a reversal of September's boost in the multifamily component.
Housing starts Consensus Forecast for October 06: 1.675 million-unit rate
Range: 1.600 million to 1.760 million-unit rate

