Last week, the markets and the Fed received a boat load of incoming economic data. Inflation moderated as earlier oil price declines came into play. Additional oil price declines last week lifted equities. Housing came in very weak while manufacturing was mixed but mostly soft. Yet, the consumer is holding up reasonably well. While the Fed is still concerned about inflation not coming down sufficiently, the bond market appears to be easing on its own.
Recap of US Markets
OIL PRICES
Oil prices fell significantly last week. Market belief that OPEC would not be able to cut production sufficiently pushed spot prices below $59 per barrel on Monday and prices remained in a $58 to $59 range until Thursday when industry reports indicated U.S. storage facilities to be essentially full. Prices fell $2.50 per barrel to close at $56.26 per barrel. Market talk that National Weather Service in the U.S. expected a mild winter helped push prices down Thursday afternoon. Oil came under further downward pressure on Friday due to the expiration of the December futures contract. Long positions either had to sell or take delivery. Holders of December contracts generally sold and bought January contracts.
Nonetheless, oil is still under downward pressure even after getting past the expiration of the December contract due to several factors. Crude inventories have been growing since the summer driving season ended in the U.S., and oil facilities in the Gulf of Mexico and Caribbean had an almost non-existent hurricane season, leading to no damage to production. A slowing U.S. economy, lack of cohesion by OPEC members in maintaining production cuts, and now a possibly warm winter should keep oil prices moderate - barring any surprises.
Net, spot prices for West Texas Intermediate ended the week at $55.81 per barrel, down a sharp $3.78 per barrel for the week. Friday's close was the lowest since June 2005.

STOCKS
Equities continued to rise despite soft economic data. Lower oil prices played a key role as did generally favorable company reports. The Dow closed at a record high each day last week while the Nasdaq and S&P 500 set six year highs. On Monday, techs and the Nasdaq led equities, with help from a more than $1 per barrel drop in oil prices. Equities were helped on Tuesday as a number of homebuilders came in ahead of expectations - even as they reported lower earnings. A number of retailers beat expectations, including Wal-Mart, Target, Saks, and Dillard's. Airline stocks got a boost Wednesday as U.S. Air put in a bid to buy bankrupt Delta Airlines. Also, a favorable Empire State manufacturing index put equity traders into a positive mood. Thursday, lower oil prices and a dip in bond prices boosted equities. Markets mainly moved sideways on Friday as the drop in housing starts was shrugged off as largely expected and seen as possibly short-lived. A court ruling that Altria Group Inc. and other tobacco companies had won the right to stop a $200 billion lawsuit did help boost the Dow last Friday.

For the week, all major indexes were up significantly: the Dow, up 1.9 percent; the S&P 500, up 1.5 percent; the Nasdaq, up 2.3 percent; and the Russell 2000, up 2.5 percent. Year-to-date, the Dow is up 15.2 percent; the S&P 500 up 12.2 percent; the Nasdaq up 10.9 percent; and the Russell 2000 up 17.1 percent.
BONDS
Interest rates were choppy over last week with notes and bond rates nudging up but remaining relatively low. On Monday, rates nudged up due to investors staying on the sidelines until the week's price reports came out, starting with the PPI on Tuesday. Tuesday saw the weak PPI and soft (according to some) retail sales leading to some ease in rates until the latest FOMC minutes came out that afternoon, forcing rates back up somewhat but leaving rates down net for the day. The minutes had a more hawkish tone than many had expected. Wednesday, a stronger-than-expected Empire State manufacturing report bumped rates up. On Thursday, the drop in the CPI, a modest gain in the core CPI, and a drop in the manufacturing component of the IP index were favorable toward bonds but were more than offset by several factors. These were a somewhat strong initial claims report, data from the Treasury indicating a drop in the net inflow of foreign capital, positive reports from the National Association of Home Builders, and a general focus by the markets on strength in the economy. Rates were little changed on Friday despite the large drop in housing starts - markets had been well prepped for a bad number.
Net for the week the Treasury yield curve is up except on the ends. Notes and bond yields rose as follows; 2-year Treasury note, up 4 basis points; 3-year, up 4 basis points; 5-year, up 3 basis points; and the 10-year bond, up 1 basis point. The 30-year bond and the 3-month Treasury bill were both down 1 basis point.

Except on the ends, rates edged up last week net but remained below rates seen a few weeks ago.

Markets at a Glance

Weekly percent change column reflects percent changes for all components except interest rates. Interest rate changes are reflected in simple differences.
The Economy
Last week saw very favorable inflation reports. Weak numbers came in for housing and the manufacturing sector was mixed. The consumer sector is holding steady once distortions in sales from lower gasoline prices are taken into account. The Fed, however, remains on its inflation vigil.
Producer prices soften further
The markets and the Fed got another round of inflation data last week with the CPI and PPI. The PPI was out of the gate first. Producer prices surprisingly fell 1.6 percent in October, following a 1.3 percent drop in September. October's decline equaled a record fall set in October 2001. Perhaps more importantly, the core rate surprisingly dropped 0.9 percent, following a 0.6 percent jump in September. The drop in the core was the sharpest since a 1.2 percent decline in August 1993. Most of the weakness in the PPI was in energy with residential gas actually leading the way down but with falling gasoline prices also contributing. Lower energy prices also pushed prices down for crude and intermediate producer price indexes. Overall prices at the crude level of production fell 10.5 percent in October while prices at the intermediate level dropped 1.1 percent.

The year-on-year core rate slipped to up 0.6 percent in September from up 1.2 percent in September. The year-on-year rate for the overall PPI decreased to down 1.6 percent from up 0.9 percent in September.

Consumer prices ease
The big inflation story last week was the consumer price index report. Overall consumer price inflation dropped 0.5 percent for two months in a row, based on October's report. Of course, energy pulled the CPI down, but the big story was the core CPI. The core CPI slowed to a modest 0.1 percent in October, following a 0.2 percent increase in September. This was the first sub-0.2 percent reading since 0.1 percent for February of this year. This is important because monthly growth of just 0.2 percent still leaves the core rate above the Fed's target of between 1 and 2 percent growth annualized.
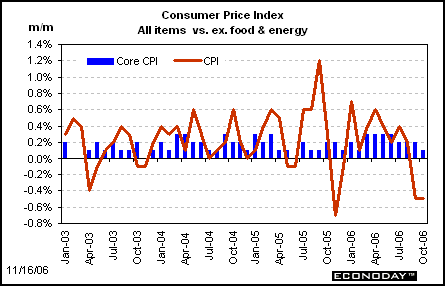
By expenditure components, transportation fell 3.1 percent, largely reflecting a drop in gasoline prices. Most major expenditure categories rose. Food & beverage were up 0.3 percent; medical care, up 0.3 percent; recreation, up 0.2 percent; education & communications, up 0.2 percent; and "other," up 0.3. The housing and recreation components were flat.
While the markets very much liked the low core number, not many took much time to look into what led to the modest gain. The flat housing component was one of key reasons that the core rate rose only 0.1 percent in October. All of the weakness in housing was in the lodging while the away-from-home subcomponent fell 0.5 percent after a 0.7 percent hike in September. Is this sustainable' One cannot expect the lodging component to decline 0.5 every month or even every other month to keep the core rate modest. The lodging weakness likely was due to discounts in resort areas and were temporary. In contrast, the rent of primary residence and the owners' equivalent rent indexes both posted 0.4 percent gains in October. Neither series has been lower than 0.3 percent for some time and are not showing progress.
Also bringing the core rate lower was a 1.2 percent drop in prices for used motor vehicles. New motor vehicle prices also helped, edging down 0.1 percent. The bottom line is that the weakness in the core rate was narrowly focused and markets likely overreacted to the favorable news. Progress was made but not as much as many believe.
In the non-expenditure category for energy, prices fell 7.0 percent, following a 7.2 percent drop in September. Gasoline prices declined a monthly 11.1 percent following a 13.5 percent decrease in September. Energy costs are down 11.3 percent on a year-on-year basis while gasoline is down 18.3 percent on a year-on-year basis.

The markets focused on the gradual improvement in the core year-on-year rate. Year-on-year core inflation growth decreased to 2.8 percent from September's 2.9 percent figure. The overall CPI's year-on-year growth rate fell to 1.3 percent from 2.1 percent in September.
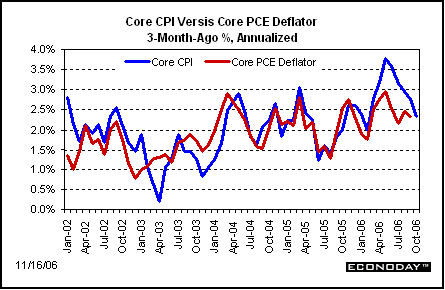
However, on a more marginal basis - a three-month-ago annualized figure - the core rate has actually improved noticeably in recent months. By this measure, the core rate is now trending below 2-1/2 percent annualized and represents progress for the Fed. However, if the core rate firms from October's 0.1 percent monthly rate, it may take longer to see further progress in the easing of the core rate.
Retail sales moderate after discounting gasoline
Once again, lower gasoline prices pulled down overall retail sales, masking underlying strength. Overall sales edged down 0.2 percent in October, following a 0.8 percent drop in September. Weakness in October was led as expected by a fall in gasoline sales which reflected lower gasoline prices. Excluding gas station sales, retail sales for October were quite healthy with a 0.4 percent gain - equaling September's boost. Excluding both gas station and motor vehicles components, sales posted a moderate 0.3 percent gain in October, following a 0.3 percent rise in September. Overall, sales were mixed by major component with gains being led by miscellaneous stores, health & personal care, food & beverages, and auto dealers. Component declines were led by gasoline stations, furniture, and department stores.
The bottom line is that the consumer sector is still doing its part to keep economic growth moderately healthy.
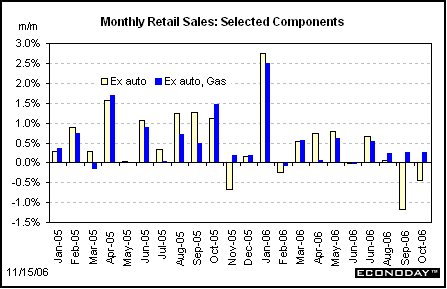
Year-on-year, overall sales are up 4.5 percent, down from up 5.2 percent in September. Excluding motor vehicles, year-on-year sales slipped to 3.1 percent in October from 4.7 percent the prior month. Excluding motor vehicles and gas station sales, year-on-year sales declined to up 5.4 percent from 6.7 percent in September.
Housing takes a hit
As many have been forecasting due to the overhang in houses for sale, housing starts dropped 14.6 percent in October, following a 4.9 percent rebound in September. Starts in October declined to an annualized pace of 1.486 million units from a revised 1.740 million units for September. October's weakness in starts was led by the single-family component while the multifamily component also fell. Single-family starts posted a 15.9 percent decrease after a 2.6 percent rise in September while multifamily units dropped 9.1 percent in October, following a 15.6 percent spike in September.
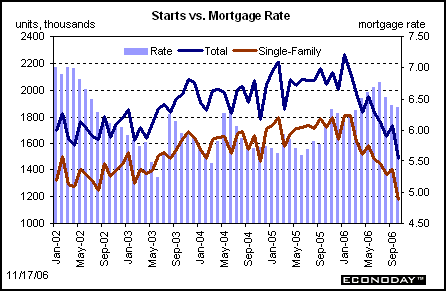
On a year-on-year basis, starts are down 27.4 percent, compared to down 19.4 percent in September.
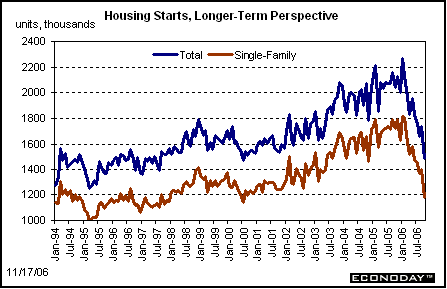
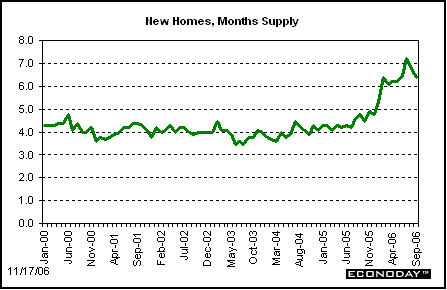
Starts are now down to the lows of the 2001 recession. But there are signs that improvement may be around the corner. Mortgage rates are still low, unemployment is low, and recent data suggest some pending improvement. The NAHB-Wells Fargo housing market index rose 2 points in November to 33 and has now posted back-to-back gains, ending a sharp plunge through the year. Nonetheless, some drawdown in unsold houses is needed before this translates into a rebound in housing starts. Months supply is still high and is weighing on new construction.
Industrial production comes in mixed
The manufacturing sector has been mixed but largely on the soft side. Regional manufacturing surveys point toward a sluggish manufacturing sector as do recent inventory numbers. Overall industrial production rose 0.2 percent in October, following a 0.6 percent drop in September. However, the important manufacturing category fell 0.2 percent in October, equaling the September decline (non-NAICS basis). Strength in the overall IP was in utilities and in mining, which posted gains of 4.1 percent and 0.6 percent, respectively.
Manufacturing weakness was primarily in nondurables, which declined 0.4 percent in October, following no change the month before. Durables also declined, by 0.2 percent, following a 0.4 percent drop in September. Overall capacity utilization in October rose to 82.2 percent from 82.1 percent in September while manufacturing capacity utilization fell to 80.7 percent in October from 81.0 percent in September.
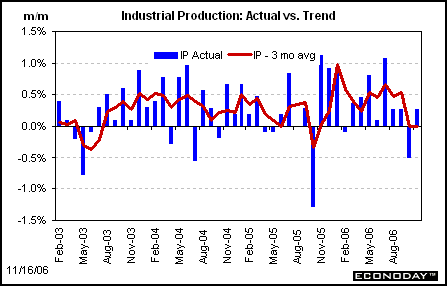
Overall industrial output is up 4.9 percent year-on-year in October while manufacturing output is up 4.1 percent.
Empire State and Philly Fed show improvement
There are mixed signs for improvement in manufacturing with regional surveys being mostly on the positive side. The New York Fed's Empire State index rose 3.8 percentage points in November to 26.7, the highest level since June. Also, the new orders and unfilled orders indexes rose sharply. The Philadelphia Fed's Business Outlook Survey's general activity index jumped to 5.1 in November from -0.7 in October. In contrast to the New York survey, new orders fell sharply.
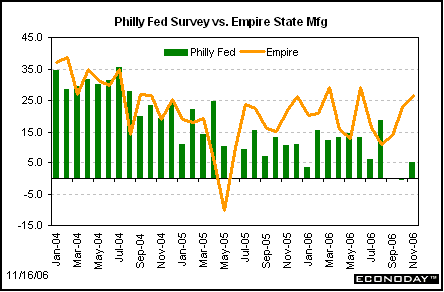
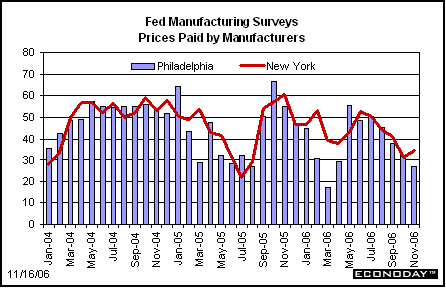
The two latest manufacturing surveys showed divergent trends on the inflation front. The Empire State survey showed a firming in prices paid. Prices paid rose 4.1 percentage points to 34.9 but the prices received index was steady, slipping 1/2 point to 17.0. The Philly Fed survey showed a moderation in price pressures. Input prices slipped to 26.7 in November from 32.0, while prices received dropped to 5.7 from 17.8 in October. Most of the input price weakness was energy related while softer prices paid reflected sluggish demand.
Inventories creeping higher
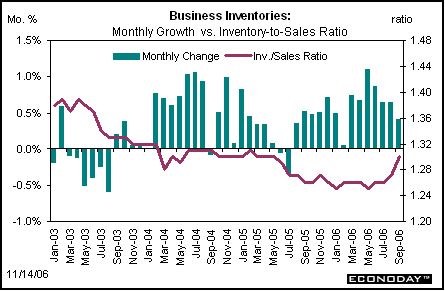
While regional manufacturing surveys are somewhat positive for manufacturing, the latest inventory numbers should give pause to any belief that manufacturing is about to rebound significantly soon. Business inventories rose 0.4 percent in September, while business sales lagged with a 2.0 percent decline. In turn, stocks have gotten more out of line with sales as the inventory-to-sales ratio jumped 3 tenths to 1.30. Most of the gain in inventories was at the wholesale and manufacturing levels as wholesale and factory stocks jumped 0.8 percent and 0.6 percent, respectively. Retail inventories dipped 0.1 percent in September. Overall, the moderately high level of inventories at wholesale and manufacturing levels will keep manufacturing output sluggish in the near term.
Minutes remind markets that Fed is serious about inflation
The minutes of the October 24-25 FOMC meeting were released last week. Markets apparently had not been listening closely enough to Fed officials and were surprised by the hawkish tone of the minutes. FOMC members clearly were more concerned about inflation not coming down enough than about modest prospects of too weak economic growth. The minutes indicated that the Fed still expects economic growth to rebound but remain below trend potential over the next two years. This is expected to lead to a moderation in inflation. Some market participants focused on the fact that the minutes reflected an economy that had not yet seen the latest and favorable inflation reports. However, while on the Fed Speak circuit, Chicago Fed President Michael Moskow punctured that balloon by noting that one month's improvement in the core CPI does not make a trend and Dallas Fed President Richard Fisher reiterated that position. The minutes noted concern about tight labor markets which is still clearly an issue given the low unemployment rate, healthy wage rate gains, and still low initial jobless claims.
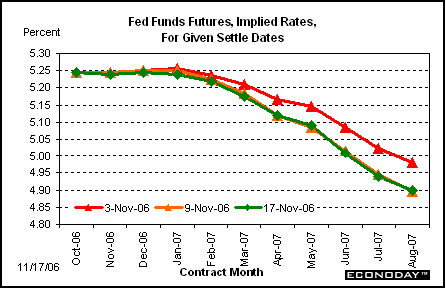
Traders in the fed funds futures market may be listening closer to Fed officials than those in other markets. Despite the weak PPI, CPI, manufacturing IP, and housing starts, implied fed funds rates showed almost no change since the prior week. Still, the fed funds futures market has kept a 25 basis point rate cut by May of next year and another by June.
The bottom line
Without a doubt last week's inflation reports were good for the economic outlook. Uncertainly remains on how substantial the slowing in the core rate is - at least the markets should remain skeptical of such quick improvement. Until we see more 0.1 percent gains in the core CPI and with the moderation more widespread within the core, the Fed is going to be in a holding pattern. Regarding the slowing trend in economic growth, the pattern is very traditional in response to a moderate boost in interest rates. The auto and housing sectors always decline first along with manufacturing. We need to pay close attention to leading indicators such as durables orders and measures of real estate traffic to make sure that the soft landing is merely bumpy and does not turn into a hard landing. Nonetheless, the economy appears to be on track although the markets still expect the soft landing (inflation easing into the Fed's target range) to happen sooner than it probably will.
Looking Ahead: Week of November 20 to November 24
Monday
The Conference Board's index of leading indicators has been soft in recent months, rising 0.1 percent in September, following a 0.2 percent decline in August. This index for some time has pointed toward modest economic growth but with no call for recession.
Leading indicators Consensus Forecast for October 06: +0.3 percent
Range: +0.1 to +0.5 percent
Wednesday
Initial jobless claims edged down 2,000 to 308,000 in the Nov. 11 week. The latest numbers indicate that the labor market remains moderately healthy. Given the weakness in housing and sluggishness in manufacturing, continued positive economic growth currently is dependent on the consumer sector holding mostly steady, and initial claims is the first indicator for any notable changes in the consumer sector.
Jobless Claims Consensus Forecast for 11/17/06: 310,000
Range: 298,000 to 315,000
Simply Economics will be taking off next week to celebrate Thanksgiving. Commentary typically found in the Looking Ahead section, however, will be posted in the consensus notes sections for next week's economic indicators. Simply Economics will return on December 1, 2006. Happy Thanksgiving from all of us at Econoday!


