|
The bad news is that home sales are at historic lows. The good news is that markets did not overreact—though hits clearly were taken. While still up for debate, the recovery continues but for the near term, the pace is quite sluggish.
 Equities fell notably this past week but it would have been much worse without a last day rally. A key background point is that it is August. Many are on vacation—especially in Europe—and markets are thin. And volatility seems to be back with the thin trading. The week started with worries that M&A activity was ignoring macroeconomic undercurrents. That is, bidding was overpriced for the current economy. And that view was abetted by a plunge in existing home sales, released on Tuesday, bumping stocks down sharply again. Adding to equities’ woes for the day, Standard & Poor downgraded Ireland's sovereign debt rating. Equities fell notably this past week but it would have been much worse without a last day rally. A key background point is that it is August. Many are on vacation—especially in Europe—and markets are thin. And volatility seems to be back with the thin trading. The week started with worries that M&A activity was ignoring macroeconomic undercurrents. That is, bidding was overpriced for the current economy. And that view was abetted by a plunge in existing home sales, released on Tuesday, bumping stocks down sharply again. Adding to equities’ woes for the day, Standard & Poor downgraded Ireland's sovereign debt rating.
Equities made a sizeable comeback on Wednesday and it was not due to economic news. Durables orders were weaker than expected after discounting the volatile transportation component. And new home sales plunged in July as released mid-week, following the lead of existing home sales. But investors saw equities as oversold as even homebuilder stocks rebounded. Sentiment outweighed economic news on Thursday as initial jobless claims offered some positive karma, dropping significantly. But markets chose to worry more about overall economic conditions and simply chose to be in a down mood.
Stocks rebounded significantly on Friday after a downward revision to second quarter GDP was not as large as feared and Fed Chairman Ben Bernanke emphasized in a speech that the Fed has a number of options to boost the economy if needed. Bernanke stated that the Fed “is prepared to provide additional monetary accommodation through unconventional measures if it proves necessary, especially if the outlook were to deteriorate significantly.”
Net for the week most indexes were down sizably although small caps actually netted a modest gain.
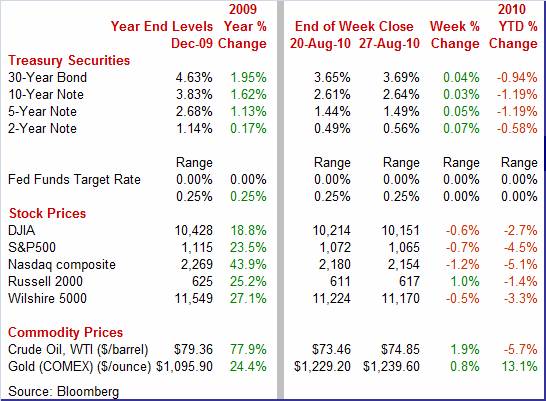
Equities were mostly down this past week. The Dow was down 0.6 percent; the S&P 500, down 0.7 percent; and the Nasdaq, down 1.2 percent. The Russell 2000 rose 1.0 percent.
For the year-to-date, major indexes are down as follows: the Dow, down 2.7 percent; the S&P 500, down 4.5 percent; the Nasdaq, down 5.1 percent; and the Russell 2000, down 1.4 percent.
Weekly percent change column reflects percent changes for all components except interest rates. Interest rate changes are reflected in simple differences.
 For those who track the market nuances, it is well known that bond traders often march to the beat of a different drummer. And that certainly was true this past week, although thin trading likely contributed. Despite the mostly negative economic news, most Treasury yields ended the week up. For those who track the market nuances, it is well known that bond traders often march to the beat of a different drummer. And that certainly was true this past week, although thin trading likely contributed. Despite the mostly negative economic news, most Treasury yields ended the week up.
However, Treasury rates closely tracked the direction of stocks during the week. Flight to safety nudged rates down Monday. Yields declined notably on Tuesday on the disappointing existing home sales. Rates firmed Wednesday on reversal of flight to safety despite weak economic news and fell on Thursday despite a positive report on jobless claims.
 But it all came down to the last trading day as GDP beat expectations while consumer sentiment fell short. Chairman Bernanke’s comments that the Fed would backstop the economy were the trump card, lifting yields sharply at week end. But it all came down to the last trading day as GDP beat expectations while consumer sentiment fell short. Chairman Bernanke’s comments that the Fed would backstop the economy were the trump card, lifting yields sharply at week end.
For this past week Treasury rates were mostly up as follows: the 2-year note, up 7 basis points; the 5-year note, up 5 basis points; the 7-year note, up 4 basis points; the 10-year bond, up 3 basis points; and the 30-year bond, up 4 basis points. The 3-month T-bill slipped 1 basis point.
 Crude oil prices surprisingly netted a gain for the week. However, prices dipped the first two days of the week over concern that the recovery is faltering. Spot prices for West Texas Intermediate firmed on Wednesday despite a rise in inventories as the dollar weakened. Basically, oil traders had baked in negative economic news earlier and decided that a more realistic price was a little higher than seen early in the week. And as long as the negative news was not too negative, that was seen as a positive. Bernanke’s supportive comments gave spot crude the biggest daily lift for the week. Yes, every market has its own psychology—equities, bonds, and even energy. And for the week, oil traders appear to be the least pessimistic. Nonetheless, spot crude—while up for the week—is still down significantly from recent highs of over $82 per barrel seen in early August. Crude oil prices surprisingly netted a gain for the week. However, prices dipped the first two days of the week over concern that the recovery is faltering. Spot prices for West Texas Intermediate firmed on Wednesday despite a rise in inventories as the dollar weakened. Basically, oil traders had baked in negative economic news earlier and decided that a more realistic price was a little higher than seen early in the week. And as long as the negative news was not too negative, that was seen as a positive. Bernanke’s supportive comments gave spot crude the biggest daily lift for the week. Yes, every market has its own psychology—equities, bonds, and even energy. And for the week, oil traders appear to be the least pessimistic. Nonetheless, spot crude—while up for the week—is still down significantly from recent highs of over $82 per barrel seen in early August.
Net for the week, spot prices for West Texas Intermediate rose $1.39 per barrel to settle at $74.85.
The latest news has the economy still posting gains through the second quarter—but at a very sluggish pace. News at the start of the third quarter is abysmal for housing and shows manufacturing easing. In the meantime, the consumer is still nervous about job and income prospects.
 As many economists had expected, second quarter GDP was downgraded by the Commerce Department to 1.6 percent annualized from the advance estimate of 2.4 percent. The good news is that the figure beat analysts’ expectation for 1.3 percent. As many economists had expected, second quarter GDP was downgraded by the Commerce Department to 1.6 percent annualized from the advance estimate of 2.4 percent. The good news is that the figure beat analysts’ expectation for 1.3 percent.
The downward revision was primarily due to a higher net export deficit and a smaller gain in inventories. Also getting downgrades were residential investment and government purchases. Partially offsetting were modest upward revisions to personal consumption and nonresidential fixed investment.
What do the latest numbers tell us about forward momentum' Final sales give us an idea of demand by taking out the inventory impact. There are two notable versions of final sales—that for just domestic sources of demand and a version that adds in net exports. Real final sales to domestic purchasers was revised up to 4.3 percent from the initial estimate of 4.1 percent while final sales of domestic product (adds in net exports) was revised down to 1.0 percent from the advance figure of 1.3 percent.
Even though overall economic growth slowed substantially from the first quarter’s 3.7 percent pace, domestic demand was actually stronger—4.3 percent compared to 1.3 percent in the first quarter. Certainly, there will be some slowing in domestic demand growth in the second half as we will not see a repeat soon of the second quarter jump in residential investment and business investment in equipment likely will soften. But a rebound in exports could help support the overall growth rate. The bottom line is that the latest GDP revisions are more supportive of continued recovery—albeit modest—than a double dip.
 Special tax incentives appear to have sharply rearranged the monthly pattern of home sales—and the current portion of the pattern is rather ugly. Existing home sales fell a monthly 27.2 percent in July to a 3.83 million annual rate for the lowest level in 15 years. Special tax incentives appear to have sharply rearranged the monthly pattern of home sales—and the current portion of the pattern is rather ugly. Existing home sales fell a monthly 27.2 percent in July to a 3.83 million annual rate for the lowest level in 15 years.
This is in sharp contrast to the recent high of 6.49 million annualized units in November 2009 and 5.79 million units in April of this year. These two months were boosted, however, by deadlines to qualify for special tax credits for homebuyers. Clearly, many home purchases were moved forward to claim the tax credits, leaving a gap in demand after the incentives ended. Of course, part of the rationale for the incentives was to boost the industry and hopefully the economy would be strong enough to lift housing demand. However, the strength of the overall recovery has been downgraded and that partially explains the drop in home sales.
Prices are under significant downward pressure as supply at the current sales rate ballooned from June's already swollen 8.9 months to 12.5 months for the worst reading in 11 years. But apparently there is resistance to price cutting. The median price dipped only 0.2 percent to $182,600. Also, there may have been a shift in sales to higher priced homes.
 The collapse in home sales has carried over to new homes. New home sales fell 12.4 percent in July to a record low 276,000 unit annual rate for a series that goes back to 1963. This compares to recent highs of 408,000 in July 2009 and 414,000 in April of this year. The collapse in home sales has carried over to new homes. New home sales fell 12.4 percent in July to a record low 276,000 unit annual rate for a series that goes back to 1963. This compares to recent highs of 408,000 in July 2009 and 414,000 in April of this year.
Supply rose steeply, to 9.1 months from June's 8.0 months. In contrast to existing home prices, prices for new homes showed weakness with the median price dropping 6.0 percent to $204,000. The median price is the lowest since 2003. Some homebuilders have been offering discounts as a substitute for the no longer available special tax credits.
The bottom line is that housing demand has dropped sharply due to sales being moved forward, still high unemployment, and tighter lending standards. This sector likely will remain soft until employment improves. However, sales likely will come off the anemic July pace as we get further away from this period of stolen sales.
 Manufacturing has been a source of strength for the recovery but some of that is waning. New factory orders for durable goods in July rebounded 0.3 percent, following a 0.1 percent decline the prior month. Manufacturing has been a source of strength for the recovery but some of that is waning. New factory orders for durable goods in July rebounded 0.3 percent, following a 0.1 percent decline the prior month.
Unfortunately, strength is narrowly focused for the month. The bounce back in July was led by the transportation component. Most other components slipped. Excluding transportation, new durables orders dropped 3.8 percent, following a 0.2 percent rise in June. While durables orders are a volatile series and some month-to-month dips are to be expected, the latest news is disappointing.
 Most of new orders strength came from transportation which jumped 13.1 percent, following a 1.0 percent decrease in June. Nondefense aircraft spiked 75.9 percent after falling 25.3 percent in June. Defense aircraft orders declined 8.3 percent in the latest month. Analysts often focus on the ex-transportation component to see the underlying trend without the sharp monthly swings from aircraft. But excluding transportation also excludes one of the other few big positives in the report. Looking for a silver lining, the ex-transportation series may actually overstate weakness a bit. Within transportation, motor vehicles continued to post healthy gains, rising 5.3 percent in July after increasing 4.0 percent in June. Most of new orders strength came from transportation which jumped 13.1 percent, following a 1.0 percent decrease in June. Nondefense aircraft spiked 75.9 percent after falling 25.3 percent in June. Defense aircraft orders declined 8.3 percent in the latest month. Analysts often focus on the ex-transportation component to see the underlying trend without the sharp monthly swings from aircraft. But excluding transportation also excludes one of the other few big positives in the report. Looking for a silver lining, the ex-transportation series may actually overstate weakness a bit. Within transportation, motor vehicles continued to post healthy gains, rising 5.3 percent in July after increasing 4.0 percent in June.
Other components were mostly down for the latest period.
By source of demand instead of by industry, a strong part of the recovery recently has been business investment in equipment. But there may be slowing in the near term. Nondefense capital goods orders excluding aircraft in July fell 8.0 percent, following a 3.6 percent jump the month before.
While the last couple of reports on durables have not been as positive as hoped, there still are signs of forward momentum. Auto sales are still holding up and manufacturers are still seeing gains in orders. With Europe stabilizing and Asia still posting healthy gains, exports are likely to help support manufacturing in coming months. Manufacturing is not as robust as just a few months ago, but the trend is still upward.
 Apparently consumers noticed. Yes, initial jobless claims worsened in mid-August and the stock market has been on a downtrend since August 10 (the date of the last FOMC statement) and consumers have either noticed that not as many are working or that 401(k) retirement funds are sharply lower. These have shown up in a dip in consumer sentiment over the last two weeks. The Reuters/University of Michigan's index dropped seven tenths from the mid-month reading to a final August reading of 68.9. Apparently consumers noticed. Yes, initial jobless claims worsened in mid-August and the stock market has been on a downtrend since August 10 (the date of the last FOMC statement) and consumers have either noticed that not as many are working or that 401(k) retirement funds are sharply lower. These have shown up in a dip in consumer sentiment over the last two weeks. The Reuters/University of Michigan's index dropped seven tenths from the mid-month reading to a final August reading of 68.9.
Because the survey sample is about evenly divided between the first half of the month and the second half, the implied reading for the second half of the month is 68.2, barely ahead of July's final reading of 67.8. Weakness the last half of the month was centered in expectations.
Economic growth is rarely even for much of a time period. And that certainly is true for the current recovery. Recent news has shown a downshift in the pace of growth—but it is still growth. In the near term, housing will likely come off its extreme lows but the impact will be modest until demand is boosted by employment gains. Meanwhile, manufacturing has slowed but could strengthen if exports pick back up.
Markets are bombarded with readings of the pulse of the consumer sector. Personal income posts on Monday, consumer confidence is released Tuesday, motor vehicles print Wednesday, jobless claims hit the wires Thursday, and—the big one—the August employment situation will have traders’ attention Friday. Also, ISM manufacturing should garner some attention Wednesday.
Personal income in June was unchanged, following a 0.3 percent boost the month before. What the consumer really bases spending on fared even worse. The wages & salaries component slipped 0.1 percent after posting a healthy 0.4 percent advance in May. Overall personal consumption was flat, following a 0.1 percent rise in May. Tugged down by lower energy costs, the headline PCE price index dipped 0.1 percent, matching May’s decrease. The core rate was flat after a 0.1 percent gain in May. Looking ahead, we should see improvement in July at least in wages and salaries as aggregate weekly earnings jumped 0.6 percent. PCEs are likely to rise as retail sales excluding autos rose 0.2 percent in July and unit new motor vehicle sales rebounded 3.3 percent. Look for a bump up in headline PCE inflation as the overall CPI gained 0.3 percent in July. But the core CPI rose only 0.1 percent.
Personal income Consensus Forecast for July 10: + 0.3 percent
Range: + 0.2 to + 0.4 percent
Personal consumption expenditures Consensus Forecast for July 10: + 0.3 percent
Range: + 0.2 to + 0.5 percent
Core PCE price index Consensus Forecast for July 10: + 0.1 percent
Range: + 0.1 to + 0.2 percent
The Chicago PMI in June rose to 62.3, a level right at the top of the recovery and indicating very strong, if not robust, month-to-month growth. And we are likely to see another healthy number in August as July’s new orders index jumped 5-1/2 points to 64.6.
Chicago PMI Consensus Forecast for August 10: 56.0
Range: 54.1 to 58.5
The Conference Board's consumer confidence index slipped to 50.4 in July from an upwardly revised 54.3 in June (initially 52.9). The latest decrease was led by a drop in expectations to 66.6 from 72.7 in June. But the present situation sub-index also declined-to 26.1 from 26.8. Looking ahead, we already have an early indication from the final August consumer sentiment index from Reuters/University of Michigan. The August sentiment reading was up only marginally at 68.9 from its July full-month reading of 67.8. The level remains quite low.
Consumer confidence Consensus Forecast for August 10: 51.0
Range: 48.0 to 54.0
The Minutes of the August 10 FOMC meeting are scheduled for release at 2:00 p.m. ET. Traders will be parsing for any new information on Fed plans for quantitative easing.
Sales of domestic light motor vehicles made a comeback in July, rising to an 8.7 million annual rate compared to June's 8.4 million. Combined light truck and auto sales of domestics and imports rose to 11.5 million units annualized from 11.2 million the month before. The biggest source of strength in July was a 4.8 percent jump in domestic light trucks which includes SUVs, vans, and minivans. According to industry sources, most of the July boost in sales came from fleet purchases by such as rental car agencies. So, sales in August may come off this boost in July.
Motor vehicle domestic sales Consensus Forecast for August 10: 8.7 million-unit rate
Range: 8.6 to 9.0 million-unit rate
The composite index from the ISM manufacturing survey eased to 55.5 from 56.2 in June – but still reflected moderate growth in activity as the reading topped the breakeven point of 50. Production slowed nearly 4-1/2 points in July to what for now is a still very strong 57.0. Looking ahead, we may see more moderation in the composite in August as the July new orders index fell to 53.5 from 58.5 in June.
ISM manufacturing composite index Consensus Forecast for August 10: 53.0
Range: 51.5 to 54.5
Construction spending in June edged up 0.1 percent, following a 1.0 percent drop in May. The June rebound was led by a 1.5 percent jump in public outlays, following a 0.3 percent decline the prior month. In contrast, the private residential component declined 0.8 percent and private nonresidential outlays slipped 0.5 percent in June. Looking ahead, there likely will be weakness in at least the residential component of outlays as housing starts have been on a downtrend April. The May and June starts declines of 13.4 percent and 8.7 percent, respectively, should weigh on outlays despite a 1.7 percent uptick in starts in July.
Construction spending Consensus Forecast for July 10: -0.6 percent
Range: -1.2 to + 0.3 percent
Initial jobless claims for the August 21 week fell 31,000 for the second biggest decline of the year to 473,000. The prior week was revised 4,000 higher to 504,000— the highest level since November. Continuing claims fell 62,000 in data for the August 14 week to a 4.456 million level, the best of the recovery. But much of the decline likely reflects the expiration of benefits.
Jobless Claims Consensus Forecast for 8/28/10: 470,000
Range: 465,000 to 484,000
Nonfarm business productivity for the first quarter was revised to an annualized increase of 2.8 percent, compared to the initial estimate of 3.6 percent. Growth in unit labor costs was nudged up to a 1.3 percent annualized decrease from the initial estimate of a 1.6 percent decline for the first quarter. Looking ahead, second quarter GDP is significantly slower than for the first quarter, coming in at a revised 1.6 percent annualized, compared to the first quarter’s 3.7 percent. This indicates that productivity in the second quarter will likely be less robust in the second quarter while unit labor costs will be higher.
Nonfarm Business Productivity Consensus Forecast for initial Q2 10: -1.9 percent annual rate
Range: -2.2 to -1.4 percent annual rate
Unit Labor Costs Consensus Forecast for initial Q2 10: +1.2 percent annual rate
Range: +0.7 to + 1.5 percent annual rate
Factory orders fell 1.2 percent in June after a 1.8 percent drop in May. For the latest month, the durable goods component fell 1.2 percent while orders for nondurable goods decreased 1.3 percent. More recently in the advance report, new factory orders for durable goods in July rebounded 0.3 percent, following a revised 0.1 percent decline the prior month.
Factory orders Consensus Forecast for July 10: +0.3 percent
Range: -1.2 to +0.5 percent
Nonfarm payroll employment in July declined 131,000 after falling a revised 221,000 in June and after a 432,000 boost in May. Of the July government plunge, 143,000 came from a drop in Census Bureau payrolls. State government fell 10,000 while local government dropped 38,000. Private nonfarm employment, which discounts the effects of hiring and firing temporary Census workers, accelerated moderately to a 71,000 increase, following a 31,000 gain in June. Average hourly earnings improved to up 0.2 percent, following no change in June. The average workweek for all workers rose to 34.2 hours from 34.1 hours in June. Turning to the household survey, the unemployment rate was unchanged at 9.5 percent in July. More recently, despite a dip this past week, initial jobless claims in August have been running higher than during July and this implies sluggish payroll and unemployment numbers. Employment indexes for the Philly and New York Fed manufacturing surveys were mixed as Empire rose while Philly slipped from positive to negative. Analysts will be tweaking their expectations with the ISM manufacturing and ADP reports just ahead of Friday’s employment situation.
Nonfarm payrolls Consensus Forecast for August 10: -80,000
Range: -160,000 to +75,000
Private nonfarm payrolls Consensus Forecast for August 10: +50,000
Range: -5,000 to +110,000
Unemployment rate Consensus Forecast for August 10: 9.6 percent
Range: 9.5 to 9.7 percent
Average workweek Consensus Forecast for August 10: 34.2 hours
Range: 34.2 to 34.3 hours
Average hourly earnings Consensus Forecast for August 10: + 0.1 percent
Range: + 0.1 to + 0.2 percent
The composite index from the ISM non-manufacturing survey in July improved to 54.3 from 53.8 month before. Yet business activity, akin to a production index, edged lower to a still very strong 57.4 – well above breakeven of 50. But we could see a higher composite in August as the new orders index rose nearly 2-1/2 points to 56.7.
ISM non-manufacturing composite index Consensus Forecast for August 10: 53.0
Range: 52.0 to 54.5
R. Mark Rogers is the author of The Complete Idiot’s Guide to Economic Indicators, Penguin Books, October 2009.
Econoday Senior Writer Mark Pender contributed to this article.
|
