|
We may have gotten our hopes up too much. Or we may not have let earlier economic prognostications sink in. We are still seeing economic growth but not as much as some had built in earlier this year even though many economists warned that the recovery would be sluggish. This week the Fed took additional monetary easing and made a modest downgrade in its view of the recovery. Markets paid more attention to the downgrade than to the new policy stance. Nonetheless, there are glimmers of hope for a slowly improving consumer sector.
 Equities took a dive this past week on jitters over whether the recovery is stalling or even turning into a double dip. For now, the economic data suggest a moderation in growth rather than a new decline. Nonetheless, traders made major adjustments to equity valuations based on the believed change in trajectory. Outside of retailing, earnings were respectable. Equities took a dive this past week on jitters over whether the recovery is stalling or even turning into a double dip. For now, the economic data suggest a moderation in growth rather than a new decline. Nonetheless, traders made major adjustments to equity valuations based on the believed change in trajectory. Outside of retailing, earnings were respectable.
Negative sentiment settled in on Tuesday with news of a slowing in imports by China. Later in the day, the Fed announced a modest resumption of quantitative easing. This news was offset by a downgrade to the Fed’s view of the recovery – which the Fed sees as still on but not as strong.
The biggest hit to equities was on Wednesday and was due to a variety of factors. Traders increasingly shifted to a more negative evaluation of the Fed’s FOMC statement. The U.S. trade gap widened with a drop in exports being a key factor. The Bank of England lowered its forecast for U.K. economic growth and Chinese industrial production slowed. Thursday, initial jobless claims rose while analysts had expected a dip. At week's end, retail sales were disappointing despite a headline rebound. Overall, economic news pointed toward a slowing in economic growth though some interpreted the numbers to suggest a double dip. As a result, traders cut their views of appropriate valuations of equities.
Equities were down sharply this past week. The Dow was down 3.3 percent; the S&P 500, down 3.8 percent; the Nasdaq, down 5.0 percent; and the Russell 2000, down 6.3 percent.
All major indexes that were not already down returned to negative territory for the year. For the year-to-date, major indexes are down as follows: the Dow, down 1.2 percent; the S&P 500, down 3.2 percent; the Nasdaq, down 4.2 percent; and the Russell 2000, down 2.5 percent.
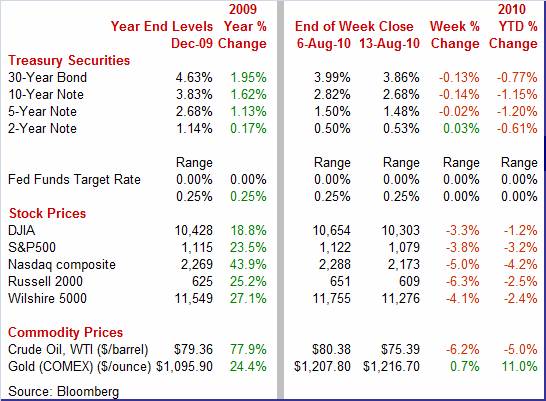
Weekly percent change column reflects percent changes for all components except interest rates. Interest rate changes are reflected in simple differences.
 Treasury yields eased this past week due to weak economic news, the Fed announcing that it would reinvest principal payments from its balance sheets for mortgage-backed securities and agency debt into Treasuries, and due to flight to safety. Treasury yields eased this past week due to weak economic news, the Fed announcing that it would reinvest principal payments from its balance sheets for mortgage-backed securities and agency debt into Treasuries, and due to flight to safety.
For this past week Treasury rates were mostly down as follows: the 5-year note, down 5 basis points; the 7-year note, down 14 basis points; the 10-year bond, down 14 basis points; and the 30-year bond, down 13 basis points. The 3-month T-bill edged up 1 basis point and the 2-year note rose 3 basis points.
 Even though the Fed announced pending purchases of Treasuries in the 2-year to 10-year range, the impact on the yield curve has been modest. This is primarily due to the fact that rates are already extremely low. Even though the Fed announced pending purchases of Treasuries in the 2-year to 10-year range, the impact on the yield curve has been modest. This is primarily due to the fact that rates are already extremely low.
However, the result is a very modest flattening of the yield curve with the near end little changed (rates cannot really go below near zero) and the long end down somewhat.
 Crude oil prices dropped sharply this past week despite a dip in inventories. Behind the weakness were disappointing economic news for the U.S., indications of moderating growth in China, and a stronger dollar. The dollar index gained over three percent for the week. Crude oil prices dropped sharply this past week despite a dip in inventories. Behind the weakness were disappointing economic news for the U.S., indications of moderating growth in China, and a stronger dollar. The dollar index gained over three percent for the week.
Net for the week, spot prices for West Texas Intermediate dropped $4.99 per barrel to settle at 75.39.
This past week, news on the consumer sector was mixed. On the international trade front, manufacturers got little help from exports, while imports were lifted by expectations of rising purchases by consumers and by businesses boosting investment. Despite the headline numbers, inflation remains soft.
 It was not the comeback hoped for. Overall retail sales in July rebounded 0.4 percent, following a 0.3 percent decrease in June. However, a large part of the strength came from the auto component. Excluding autos, sales gained 0.2 percent, following a 0.1 percent downtick in June. Certainly, the boost in auto sales is a positive, but the other source of strength likely is not - a spike in gasoline sales likely lifted by higher prices. Without the jump in gasoline sales, consumer spending was soft. Sales excluding autos and gasoline slipped 0.1 percent, following a 0.2 percent boost in June. It was not the comeback hoped for. Overall retail sales in July rebounded 0.4 percent, following a 0.3 percent decrease in June. However, a large part of the strength came from the auto component. Excluding autos, sales gained 0.2 percent, following a 0.1 percent downtick in June. Certainly, the boost in auto sales is a positive, but the other source of strength likely is not - a spike in gasoline sales likely lifted by higher prices. Without the jump in gasoline sales, consumer spending was soft. Sales excluding autos and gasoline slipped 0.1 percent, following a 0.2 percent boost in June.
By components, the rebound in July was led by a 1.6 percent boost in motor vehicle sales and a 2.3 percent jump in gasoline station sales. Also showing gains were miscellaneous stores, nonstore retailers, and food services & drinking places.
Declines were seen in furniture & home furnishings, electronics & appliances, building materials & garden equipment, food & beverage stores, health & personal care, clothing, sporting goods & hobby stores, and general merchandise.
Growth in retail sales in recent months has slowed significantly relative to earlier this year and late 2009. Nonetheless, consumer spending clearly has not fallen off a cliff. And there are signs that the consumer sector is a little stronger than the latest sales numbers indicate. Consumer optimism has picked up a little.
 It is still low, but at least it is headed in the right direction. Consumer sentiment improved in mid-August to 69.6 from July's full-month reading of 67.8. The latest number is still below the recent high of 76.04 in June of this year, but is significantly higher than the recession low of 55.3 or November 2008. It is still low, but at least it is headed in the right direction. Consumer sentiment improved in mid-August to 69.6 from July's full-month reading of 67.8. The latest number is still below the recent high of 76.04 in June of this year, but is significantly higher than the recession low of 55.3 or November 2008.
For the latest survey, the assessments of the outlook and of current conditions both improved.
Looking ahead, however, near-term gains in sentiment are questionable, given the recently elevated initial jobless claims and decline in equities. Common wisdom likely holds true that sentiment and spending will pick up after hiring does. The latest productivity figures suggest that businesses actually may have no choice other than adding to payrolls.
 While clearly a negative for the upcoming revision to the second quarter GDP, there are quite a few question marks in the latest international trade report. The overall U.S. trade deficit spiked to $49.9 billion in June from $42.0 billion in May. Exports fell 1.3 percent, following a 2.5 percent gain in May. Overall imports advanced 3.0 percent in June after rising 2.8 percent the month before. Nonoil imports gained a sharp 4.7 percent, following a 6.1 percent spike in May. While clearly a negative for the upcoming revision to the second quarter GDP, there are quite a few question marks in the latest international trade report. The overall U.S. trade deficit spiked to $49.9 billion in June from $42.0 billion in May. Exports fell 1.3 percent, following a 2.5 percent gain in May. Overall imports advanced 3.0 percent in June after rising 2.8 percent the month before. Nonoil imports gained a sharp 4.7 percent, following a 6.1 percent spike in May.
 The widening of the trade gap was primarily in non-oil. The nonpetroleum deficit widened to $40.0 billion in June from $32.2 billion the prior month. The petroleum goods gap, however, narrowed to $21.2 billion from $21.5 billion in May. The widening of the trade gap was primarily in non-oil. The nonpetroleum deficit widened to $40.0 billion in June from $32.2 billion the prior month. The petroleum goods gap, however, narrowed to $21.2 billion from $21.5 billion in May.
By end-use categories, the drop in goods exports was led by a decline in capital goods excluding autos. Also slipping were industrial supplies and the foods, feeds & beverages components. Exports of consumer goods and autos posted modest gains.
The advance in imports was widespread outside of oil. Consumer goods posted a large gain. Also rising notably were autos and capital goods. Foods, feeds & beverages rose marginally. Industrial supplies—which include oil—declined marginally.
So, what are the question marks' Exports fell in June—is this a trend' Just a few weeks ago, worries were quite significant that sovereign debt problems in Europe would slow growth there. However, recent economic news from Europe has been somewhat on the upside. The Chinese government appears to be tapping the brakes a bit, but growth is still likely quite healthy. And the rest of Asia is following that trend. Most likely, foreign economic growth will keep exports from the U.S. on a moderate uptrend.
What questions do the import numbers raise or what do they tell us' Businesses plan imports well in advance of expected sales or deliveries—there is a significant lag from import order to delivery. Apparently, U.S. firms expect improvement ahead in both consumer spending and in equipment investment. There also likely is still some inventory rebuilding occurring.
The bottom line is that the underlying trend of expansion in trade-in both exports and imports-likely is continuing.
 A bump up in energy costs led to a rebound in CPI inflation, ending a three month string of declines. Meanwhile, the core rate remained soft. In June overall CPI inflation rebounded 0.3 percent, following a 0.1 percent decline in June. Excluding food and energy, the CPI eased to a 0.1 percent gain after a 0.2 percent boost in June. The consensus projection was for a 0.1 percent increase. A bump up in energy costs led to a rebound in CPI inflation, ending a three month string of declines. Meanwhile, the core rate remained soft. In June overall CPI inflation rebounded 0.3 percent, following a 0.1 percent decline in June. Excluding food and energy, the CPI eased to a 0.1 percent gain after a 0.2 percent boost in June. The consensus projection was for a 0.1 percent increase.
By components, energy increased 2.6 percent, following a 2.9 percent drop in June. Gasoline rebounded 4.6 percent after a 4.5 percent decrease the previous month. Food prices dipped 0.1 percent after being flat the prior two months.
 Within the core, a lot was going on—and we can see why the Fed in part is still betting on inflation remaining subdued. Shelter costs rose only 0.1 percent for the fourth month in a row. This reflects the weak housing market which has resulted in more unsold homes going to the rental market. The shelter component makes up 32.3 percent of the total CPI and 41.6 percent of the core CPI. As long as shelter is soft, it is almost certain that the core rate will be subdued. On a year ago basis, the shelter component was actually down 0.4 percent July. Within the core, a lot was going on—and we can see why the Fed in part is still betting on inflation remaining subdued. Shelter costs rose only 0.1 percent for the fourth month in a row. This reflects the weak housing market which has resulted in more unsold homes going to the rental market. The shelter component makes up 32.3 percent of the total CPI and 41.6 percent of the core CPI. As long as shelter is soft, it is almost certain that the core rate will be subdued. On a year ago basis, the shelter component was actually down 0.4 percent July.
Also in the latest report, medical care cost fell back 0.1 percent after jumping 0.3 percent in June.
But some components showed some strength – with apparel and tobacco each showing notable increases. And new & used motor vehicles gained 0.3 percent.
Overall, inflation at the consumer level continues to meet the Fed’s expectation of “subdued.”
 Import prices rose 0.2 percent in July, largely due to a 2.0 percent rise in petroleum. Excluding petroleum, import prices fell 0.2 percent following June's 0.5 percent contraction. Import prices rose 0.2 percent in July, largely due to a 2.0 percent rise in petroleum. Excluding petroleum, import prices fell 0.2 percent following June's 0.5 percent contraction.
Within non-petroleum components, downward pressure came from industrial supplies & materials excluding petroleum which fell 0.7 percent, consumer goods ex autos, down 0.2 percent, and from capital goods which slipped 0.1 percent. Providing some lift was foods, feeds & beverages, rising 0.4 percent. Overall, import prices remain soft.
 Over the past recession and current recovery, businesses have been on a cost cutting binge with labor cuts being a huge part of this. Productivity has been on an uptrend as result. But that trend took a hit in the second quarter. Nonfarm productivity fell an annualized 0.9 percent, following a 3.9 percent boost in the first quarter. Productivity had risen for five consecutive quarters. For the latest quarter, a 3.6 percent increase in hours worked outpaced a 2.6 percent increase in output. Over the past recession and current recovery, businesses have been on a cost cutting binge with labor cuts being a huge part of this. Productivity has been on an uptrend as result. But that trend took a hit in the second quarter. Nonfarm productivity fell an annualized 0.9 percent, following a 3.9 percent boost in the first quarter. Productivity had risen for five consecutive quarters. For the latest quarter, a 3.6 percent increase in hours worked outpaced a 2.6 percent increase in output.
Due to the reversal in productivity, unit labor costs rose an annualized 0.2 percent to end three straight quarters of sequential decline, including a 3.7 percent drop in the first quarter.
The second quarter fall in productivity may have implications for hiring. Businesses may have already squeezed out about all they can get out of their cut-back work force. If so, more business activity will mean more hiring and may start a virtuous cycle (more hiring, more spending, more hiring) that strengthens the recovery.
 At this past week’s FOMC meeting, the Fed took out a modest insurance policy to keep the recovery going. The Fed will engage in some new quantitative easing to keep the level of the balance sheet constant rather than to further expand its assets. The Fed, of course, left the fed funds target unchanged at a range of zero to 0.25 percent. The somewhat controversial language was retained that rates are expected to remain low for an "extended period." As in recent policy decisions, Kansas City Fed President Thomas Hoenig voted against this language. The FOMC did make a minor downgrade in its view of the recovery but emphasized that growth continues. At this past week’s FOMC meeting, the Fed took out a modest insurance policy to keep the recovery going. The Fed will engage in some new quantitative easing to keep the level of the balance sheet constant rather than to further expand its assets. The Fed, of course, left the fed funds target unchanged at a range of zero to 0.25 percent. The somewhat controversial language was retained that rates are expected to remain low for an "extended period." As in recent policy decisions, Kansas City Fed President Thomas Hoenig voted against this language. The FOMC did make a minor downgrade in its view of the recovery but emphasized that growth continues.
Prior to the latest policy meeting, the Fed had stopped adding to its balance sheet and actually was starting to let it “naturally” unwind slowly as principal was paid on mortgage-backed securities and agency debt. The Fed has now decided to keep its balance sheet at its current level by reinvesting payments on agency debt and mortgage-backed securities into longer-term Treasuries. This is consistent with many Fed officials' view that the Fed should not be tinkering with specific private portions of the credit markets (mortgages, for example).
About half an hour after the FOMC statement, the New York Fed announced some of the specifics for the Fed purchases.
 "On August 10, 2010, the Federal Open Market Committee directed the Open Market Trading Desk ("the Desk") at the Federal Reserve Bank of New York to keep constant the Federal Reserve's holdings of securities at their current level by reinvesting principal payments from agency debt and agency mortgage-backed securities ("agency MBS") in longer-term Treasury securities. The most recent H.4.1 data release indicates that outright holdings of domestic securities in the System Open Market Account ("SOMA") totaled $2.054 trillion as of August 4, 2010. The Desk will seek to maintain the face value of outright holdings of domestic securities in the SOMA at approximately this level." "On August 10, 2010, the Federal Open Market Committee directed the Open Market Trading Desk ("the Desk") at the Federal Reserve Bank of New York to keep constant the Federal Reserve's holdings of securities at their current level by reinvesting principal payments from agency debt and agency mortgage-backed securities ("agency MBS") in longer-term Treasury securities. The most recent H.4.1 data release indicates that outright holdings of domestic securities in the System Open Market Account ("SOMA") totaled $2.054 trillion as of August 4, 2010. The Desk will seek to maintain the face value of outright holdings of domestic securities in the SOMA at approximately this level."
As a result of the Fed’s announcement, interest rates eased marginally. Based on the fed funds futures market, traders moved further out the timing of Fed tightening. These traders expect the Fed to raise the fed funds target to 0.50 percent no sooner than late 2011.
Economic indicators mostly fell short of expectations this week. However, that is very different from a return to negative growth. Most economic news suggests a continuation of a sluggish recovery.
Housing and manufacturing take center stage this week. Homebuilders give a vote of confidence or not on the economy with housing starts on Tuesday. We’ll see if the engine of the recovery regains strength as industrial production posts on Wednesday.
The Empire State manufacturing index reported an abrupt slowdown in growth for July, falling nearly 15 points to 5.08. However, this was still above breakeven of zero and reflected modest growth. Looking ahead, the July new orders index also slowed—to 10.13 from 17.53 in June. This indicates moderate growth for new orders and a likely modestly positive Empire State index for August.
Empire State Manufacturing Survey Consensus Forecast for August 10: 8.0
Range: 6.5 to 10.0
Housing starts fell again in June as homebuilders are still trying to figure out how to balance inventories to meet expected sales after the end of expired tax incentives. Homebuilders again slowed the pace of ground breaking as housing starts in June declined 5.0 percent after a 14.9 percent plunge in May. Multifamily starts plunged 21.5 percent in the latest month as the single-family component only slipped 0.7 percent. But we could get a little bounce in July for starts as housing permits rebounded a revised 1.6 percent in June (originally 2.1 percent), following a 5.9 percent drop in May.
Housing starts Consensus Forecast for July 10: 0.565 million-unit rate
Range: 0.550 million to 0.585 million-unit rate
The producer price index fell 0.5 percent in June, following a 0.3 percent drop in May. Lower food costs were the main reason for the June dip but a decline in energy costs also helped. At the core level, the PPI eased to 0.1 percent from a 0.2 percent boost in May. Looking ahead, the headline number for July will likely rebound on higher energy costs. We have already seen energy or petroleum prices jump in July’s CPI and in import prices.
PPI Consensus Forecast for July 10: +0.2 percent
Range: -0.2 to +0.5 percent
PPI ex food & energy Consensus Forecast for July 10: +0.1 percent
Range: +0.1 to +0.2 percent
Industrial production in June edged up 0.1 percent, following a 1.3 percent gain the prior month. But there was some false strength in the latest number. The bump up in output was led by a 2.7 percent surge in utilities output—likely weather related. In contrast, manufacturing fell 0.4 percent in June, following a 1.0 percent jump in May. Much of the manufacturing decline was due to a drop in auto assemblies. Overall capacity utilization was unchanged at 74.1 percent in June. Looking ahead, we should see a rebound in the manufacturing component of industrial production as production worker hours rebounded 0.5 percent in July.
Industrial production Consensus Forecast for July 10: +0.6 percent
Range: +0.3 to +1.0 percent
Capacity utilization Consensus Forecast for July 10: 74.5 percent
Range: 73.8 to 75.5 percent
Initial jobless claims for the August 7 week rose 2,000 to 484,000 - the highest level since February. The four-week average, up a steep 14,250 to 473,500, is also the highest since February. In a partial offset, continuing claims fell 118,000 in data for the July 31 week. The four-week average fell 64,000 to 4.519 million.
Jobless Claims Consensus Forecast for 8/14/10: 480,000
Range: 465,000 to 495,000
The Conference Board's index of leading indicators fell 0.2 percent in June. This was the second dip in three months as May had rebounded 0.5 percent after slipping 0.1 percent in April. The factory workweek was the single biggest negative for the report followed by vendor performance. On the upside, the interest rate spread was the strongest component with a 0.32 percent contribution to the overall index’s monthly change. The index of coincident economic indicators also lost strength, slowing to unchanged in June following a run of gains.
Leading indicators Consensus Forecast for July 10: +0.1 percent
Range: -0.2 to +0.5 percent
The general business conditions index of the Philadelphia Fed's Business Outlook Survey eased to 5.1 in July indicating a slower rate of growth than June's 8.0 reading. Breakeven is zero instead of 50 as with the ISM reports. But there is a possibility of decline in August as the new orders index fell to minus 4.3 to mark an end to a year long string of growth.
Philadelphia Fed survey Consensus Forecast for August 10: 7.0
Range: -0.6 to 10.0
R. Mark Rogers is the author of The Complete Idiot’s Guide to Economic Indicators, Penguin Books, October 2009.
Econoday Senior Writer Mark Pender contributed to this article.
|
