|
It was a mostly quiet week in terms of economic news, but apparently the 100 degree plus heat in New York had stocks sizzling ahead of earnings season.
 Many pundits—including economists—say the strength of the recovery is waning. But that does not mean that profits are not still healthy and it showed in a sizeable jump in equities this past week as traders are starting to anticipate favorable earnings reports for the second quarter. Alcoa unofficially starts the Dow earnings season this Monday. Buyers seeing equities as oversold the prior week also helped lift stocks. Many pundits—including economists—say the strength of the recovery is waning. But that does not mean that profits are not still healthy and it showed in a sizeable jump in equities this past week as traders are starting to anticipate favorable earnings reports for the second quarter. Alcoa unofficially starts the Dow earnings season this Monday. Buyers seeing equities as oversold the prior week also helped lift stocks.
The rebound started with a holiday delayed open on Tuesday with Alcoa jumping on gains in metal prices. Also, Goldman Sachs rose on an upgrade by JP Morgan Chase. And General Electric helped lift stocks after announcing a large contract for gas turbines. However, equity advances were softened by an ISM non-manufacturing report that was less positive than forecast.
Equities really sizzled on Wednesday on several factors. The International Council of Shopping Centers report that sales were growing at the fastest pace since 2006—undermining the argument that weak consumer confidence is holding the consumer back. An announcement by the regional bank State Street reported a profit that significantly beat expectations, boosting bank stocks in general. Finally, reliable sources said European stress tests will likely assume a 17 percent loss on Greek bonds. This is sharply lower than estimated by some analysts. The haircut on Spanish bonds was seen now as 3 percent, compared to earlier fears of 10 to 20 percent. The euro gained, reflecting increased confidence in European credit markets, and stocks advanced. For the day, major indexes were up roughly from 2-1/2 to 3-1/3 percent and the Dow was back over 10,000.
Stocks got another nice lift on Thursday after initial jobless claims fell sharper than projected and as the euro rose in value, a reflection of lower anxiety about sovereign debt problems in Greece, Spain, and others in Europe. The week ended with significant gains for most indexes as traders continued to take long positions ahead of earnings announcements. A statement from Google that it had renewed its license with the Chinese government to operate in that country also put traders in a positive mood as did better-than-expected job growth in Canada.
Most indexes made sizeable comebacks this week, nearly reversing the losses of the prior week. The Dow and S&P 500 actually netted positive for the two weeks.
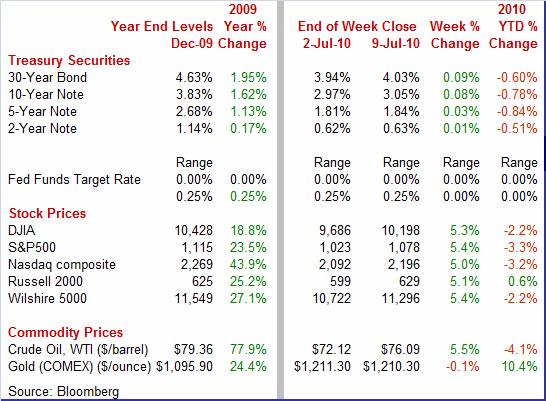
Equities were up sharply this past week. The Dow was up 5.3 percent; the S&P 500, up 5.4 percent; the Nasdaq, up 5.0 percent; and the Russell 2000, up 5.1 percent.
For the year-to-date, major indexes are mostly down as follows: the Dow, down 2.2 percent; the S&P 500, down 3.3 percent; and the Nasdaq, down 3.2 percent. The Russell 2000 is up 0.6 percent.
Weekly percent change column reflects percent changes for all components except interest rates. Interest rate changes are reflected in simple differences.
 Treasury yields ended the week rising marginally on the short end and moderately on the far end. Rates started the week in the other direction on Tuesday’s release of disappointing news on ISM’s non-manufacturing index. The remainder of the week, however, rates continued to rise both on traders seeking higher returns in equities and on reversal of flight to safety as the euro firmed and european credit concerns eased. Thursday’s better-than-expected drop in jobless claims also boosted yields. Treasury yields ended the week rising marginally on the short end and moderately on the far end. Rates started the week in the other direction on Tuesday’s release of disappointing news on ISM’s non-manufacturing index. The remainder of the week, however, rates continued to rise both on traders seeking higher returns in equities and on reversal of flight to safety as the euro firmed and european credit concerns eased. Thursday’s better-than-expected drop in jobless claims also boosted yields.
For this past week Treasury rates were mostly up as follows: the 2-year note, up 1 basis point; the 5-year note, up 3 basis points; the 7-year note, up 5 basis points; the 10-year bond, up 8 basis points; and the 30-year bond, up 9 basis points. The 3-month T-bill slipped 1 basis point.
 What a difference a week makes. Fears over a slowing economy, a weak euro, and slumping equities bumped the price of crude down just before the U.S. holiday weekend. This past week, most of that was reversed as the euro firmed marginally. But the dollar weakened more with a 0.5 percent dip for the week according to the dollar index. This put upward pressure on oil since it is largely priced in dollars. But for the most part, the spot price of West Texas Intermediate followed equities up. Also, at mid-week, crude inventories dropped more than forecast. What a difference a week makes. Fears over a slowing economy, a weak euro, and slumping equities bumped the price of crude down just before the U.S. holiday weekend. This past week, most of that was reversed as the euro firmed marginally. But the dollar weakened more with a 0.5 percent dip for the week according to the dollar index. This put upward pressure on oil since it is largely priced in dollars. But for the most part, the spot price of West Texas Intermediate followed equities up. Also, at mid-week, crude inventories dropped more than forecast.
Net for the week, spot prices for West Texas Intermediate rebounded $3.95 per barrel to settle at $76.09. The prior week, spot dropped $6.47 to $72.14.
This past week, indicator news was rather limited but showed some slowing in economic growth.
 The non-manufacturing sector is growing—just not as fast as in recent months. The big worry is whether the deceleration will continue or will growth level out. According to the Institute for Supply Management, its headline composite index slipped back 1.6 points to 53.8 in June for its lowest reading since February. Nearly all details showed deceleration since May. New orders fell nearly three points to 54.4 for its lowest reading of the year. The non-manufacturing sector is growing—just not as fast as in recent months. The big worry is whether the deceleration will continue or will growth level out. According to the Institute for Supply Management, its headline composite index slipped back 1.6 points to 53.8 in June for its lowest reading since February. Nearly all details showed deceleration since May. New orders fell nearly three points to 54.4 for its lowest reading of the year.
Business activity, at 58.1, is at its lowest level since February. The report does not bode well for payroll employment for service-providing and construction sectors. Its employment index edged back to 49.7, ending its one-month visit over breakeven 50. Backlogs slowed slightly, export orders contracted, imports contracted, and inventory gains slowed.
Even price pressure eased a bit as the price index decreased 6.8 percentage points to 53.8 in June, indicating that prices are still rising but at a slower rate than in May.
The bottom line is that non-manufacturing is still growing but at a less robust pace. The composite index, after all, has been in positive territory for seven consecutive months. Also, ISM stated that 14 industries reported increased business activity, and two industries reported a decline in activity for the month of June. Two industries reported no change.
 Are consumers returning to the bunker, clamping down on their wallets' The latest consumer credit report suggests that likely is the case as May credit fell significantly after a huge downward revision for April. But the story likely is a little complicated. Are consumers returning to the bunker, clamping down on their wallets' The latest consumer credit report suggests that likely is the case as May credit fell significantly after a huge downward revision for April. But the story likely is a little complicated.
Consumer credit contracted a sharp $9.1 billion in May with April revised to show an even more severe $14.9 billion contraction. The April revision was quite a shock, given the initial reading of a $1.0 billion gain.
Revolving credit contracted $7.4 billion in May and contracted $8.3 billion in April. Non-revolving credit shows a $1.8 billion contraction in May on top of a $6.5 billion contraction in April.
 So, what’s going on—are consumers retrenching' That might be part of the story. But consumer credit outstanding can decline either due to consumers paying balances down or because banks and finance companies are charging off bad credit. Indeed, through the first quarter (latest data available), charge-off rates on consumer loans by commercial banks were quite elevated and rising. The first quarter charge-off rate stood at 6.5 percent, compared to 5.3 percent the prior quarter. So, what’s going on—are consumers retrenching' That might be part of the story. But consumer credit outstanding can decline either due to consumers paying balances down or because banks and finance companies are charging off bad credit. Indeed, through the first quarter (latest data available), charge-off rates on consumer loans by commercial banks were quite elevated and rising. The first quarter charge-off rate stood at 6.5 percent, compared to 5.3 percent the prior quarter.
We do not know what share of the drop in consumer credit in May was due to consumer pay down and what share to charge offs. Both likely played a role. Clearly, charge-offs weigh on bank profits but near zero interest rates are more than helping banks adjust. But for the outlook for consumer spending, the charge offs are actually a positive—more discretionary income is freed. The big picture is that the consumer is still cautious. But the recent downtrend in consumer credit may not indicate that the consumer is back in the bunker—just being careful. Nonetheless, all signs point to a tepid consumer sector until hiring strengthens.
While economic growth is slowing, there is not a compelling argument that the economy is dipping into another recession. Progress still is likely to be gradual in the near term.
This coming week is making up for last week’s dearth of economic news. There are five major market moving indicators starting with international trade on Tuesday, retail sales on Wednesday, PPI and industrial production on Thursday, and the CPI at week end. Plus the second tier is rather strong, too, with FOMC minutes at mid-week, Philly Fed on Thursday, and consumer sentiment on Friday. The combination of a barrage of economic data and the start of earnings reports should keep traders on edge all week.
The U.S. international trade gap widened to $40.3 billion in April from $40.0 billion the previous month. For the latest month, exports slipped 0.7 percent while imports decreased 0.4 percent. By end-use categories, goods exports’ weakness was led by a decline in consumer goods while softness in goods imports was in the same category. However, the bright spot in imports was a jump in capital goods excluding autos. Businesses appear to see demand strong enough to expand or upgrade capacity. Looking ahead, the question is whether businesses in the U.S. and abroad see consumer demand and investment strengthening or slowing. Leading into May, concern over European sovereign debt problems remained high while the U.S. consumer still looked relatively healthy ahead of May retail sales. Monthly data are volatile but this suggests imports may be relatively strong compared to exports for May.
International trade balance Consensus Forecast for May 10: -$39.0 billion
Range: -$41.0 billion to -$38.0 billion
The U.S. Treasury monthly budget report showed a deficit of $135.9 billion for May. But the pace slowed for the year-to-date deficit for the fiscal year beginning in October. The cumulative deficit came in at $935.6 billion, a sizable sum but 5.7 percent lower than for May last year. Looking ahead, the month of June typically shows a modest surplus for the month. Over the past 10 years, the average surplus for the month of June has been $16.7 billion and $1.9 billion over the past 5 years. The June 2009 figure, however, was a huge deficit of $94.3 billion.
Treasury Statement Consensus Forecast for June 10: -$70.0 billion
Range: -$90.0 billion to -$69.0 billion.
Retail sales disappointed in May, falling 1.2 percent. But the decline had followed healthy gains of 0.6 percent in April and 2.1 percent in March. Sales ex-autos decreased 1.1 percent in May after advancing 0.6 percent in April. The volatility appears to have been related to swings in housing sales from the ending of special tax credits. The drop in overall sales in May was centered in a 9.3 percent plunge in building materials. However, this component jumped 8.1 percent in March and 8.4 percent in April. So, we are likely to see some leveling off in retail sales ex autos in June. But a 4.7 percent drop in unit new motor vehicle in June sales points to a drop in the headline sales number.
Retail sales Consensus Forecast for June 10: -0.2 percent
Range: -0.4 to +0.3 percent
Retail sales excluding motor vehicles Consensus Forecast for June 10: 0.0 percent
Range: -0.6 to +0.5 percent
Business inventories rose 0.4 percent in April, continuing a run of gains. April, however, represents a slowing from 0.7 percent in March and 0.5 percent in February. Stocking decelerated the most among retailers as businesses appear to become concerned about growth in demand easing. Looking ahead, we already have a 0.4 percent decline in manufacturers’ inventories for May and a 0.5 percent boost for wholesaler inventories, basically a wash for the two. Overall inventories will be led by the retail component when it comes in and it likely will be up based on weak retail sales for the month.
Business inventories Consensus Forecast for May 10: +0.2 percent
Range: -0.4 to +0.6 percent
The Minutes of the June 22-23 FOMC meeting are scheduled for release at 2:00 p.m. ET. Since Fed officials have made it clear that short-term interest rates are on hold for an extended period, the focus likely will be on commentary on strengths and weaknesses of the economy plus any insight into sovereign debt problems in Europe.
The producer price index in May fell 0.3 percent after dipping 0.1 percent in April. But at the core level, the PPI gained 0.2 percent, matching the rate in April. The decline in the headline PPI was led by a 1.5 percent drop in energy costs, following a 0.8 percent dip in April. Also adding to weakness in the headline number was a 0.6 percent decrease in food prices after a 0.2 percent decline in April. The mild acceleration in May for the core PPI was led by a spike in tobacco prices and a boost in light truck prices. Energy again will likely weigh on the June PPI.
PPI Consensus Forecast for June 10: -0.1 percent
Range: -0.5 to +0.2 percent
PPI ex food & energy Consensus Forecast for June 10: +0.1 percent
Range: +0.1 to +0.2 percent
The Empire State manufacturing index for June firmed to 19.57 from 19.11 the month before. Empire’s strength was broad based. New orders rose more than three points to 17.53. Shipments, which follow orders, rose nearly 8-1/2 points to 19.67 with the workweek rising to 8.64 versus no change in May. Based on the new orders index, the overall index is likely to be healthy in July.
Empire State Manufacturing Survey Consensus Forecast for July 10: 18.0
Range: 16.0 to 20.0
Initial jobless claims fell 21,000 in the July 3 week to 454,000 for the lowest level since early May. The four-week average fell 1,250 to 466,000, the best weekly improvement since early May though the level is still slightly higher than a month ago. Declines were also seen for continuing claims, down 224,000 in the June 26 week to 4.413 million for the lowest level since November. Markets will be hoping for another dip in initial claims for the latest week but the fact that it is for a holiday shortened week will raise doubts about its reliability.
Jobless Claims Consensus Forecast for 7/10/10: 445,000
Range: 420,000 to 460,000
Industrial production in May surged 1.2 percent, following a 0.7 percent boost the month before. Manufacturing has been robust over the last three months with this component gaining 0.9 percent in the two latest months and jumping 1.2 percent in March. A jump in motor vehicle production added significantly to May’s overall production boost. Overall capacity utilization continues its upward trend, reaching the 74.7 percent mark in May from 73.7 percent the prior month. Looking ahead, we are likely to see some retracing in production in June. Production worker hours for the month dropped 1.0 percent. However, manufacturing surveys were not as pessimistic as the ISM manufacturing index and Philly Fed index slowed but remained in positive territory. The New York Fed index actually edged higher into positive territory. The need to rebuild auto inventories could support June’s production figure. Some automakers have deferred retooling to restock.
Industrial production Consensus Forecast for June 10: -0.2 percent
Range: -0.6 to +0.2 percent
Capacity utilization Consensus Forecast for June 10: 74.0 percent
Range: 73.0 to 74.2 percent
The general business conditions index of the Philadelphia Fed's Business Outlook Survey saw a slowing in growth in June as the headline index, called general business conditions, edged back 8.0 from a long string of 20 or nearly 20 readings. Looking ahead, however, we may see a modest rebound. The new orders index accelerated to 9.0 from 6.1 in May.
Philadelphia Fed survey Consensus Forecast for July 10: 12.0
Range: 4.1 to 15.0
The consumer price index has been negative two months in a row—thanks to energy declines. In May, overall CPI inflation declined 0.2 percent, following a 0.1 percent dip in April. Excluding food and energy, CPI inflation rose 0.1 percent, following no change in both March and April. Helping to keep the core rate soft was no change in the owners’ equivalent rent subcomponents. This series has either been flat or negative for several months. Looking ahead, seasonally soft gasoline prices should kept the headline number on its recent downtrend.
CPI Consensus Forecast for June 10: -0.1 percent
Range: -0.2 to 0.0 percent
CPI ex food & energy Consensus Forecast for June 10: +0.1 percent
Range: 0.0 to +0.1 percent
The Reuter's/University of Michigan's Consumer sentiment index rose to 76.0 for the final June reading, up from 75.5 at mid-June and from 73.6 May and 72.2 in April. Sentiment hit a recent low in mid-April of 69.5. The latest gain in sentiment was led by the current conditions component as the expectations component edged back. Looking ahead, the mid-July reading overall could be lifted by further gains in the stock market and a recent dip in initial jobless claims. But market expectations should still be modest given that unemployment remains high and hiring sluggish.
Consumer sentiment Consensus Forecast for preliminary July 10: 75.0
Range: 71.0 to 76.0
R. Mark Rogers is the author of The Complete Idiot’s Guide to Economic Indicators, Penguin Books, October 2009.
Econoday Senior Writer Mark Pender contributed to this article.
|
