|
We have seen it before. Tax credit incentives pushed sales earlier to meet deadlines. The first time, it was cash-for-clunkers auto incentives in mid-2009 which caused sales to spike before the program expired, then plunge after the deadline, then return to “normal” a few months later. This time it is the expiration of special tax credits for homebuyers. Both times, sales were moved forward—“stolen” from the future. Yes, home sales surged ahead of the April signings deadline, but new home sales came crashing down in May as many on the market had already made their move, leaving fewer sales for after the deadline. There was payback in reduced sales after the deadline. The question is—what’s next for the economy'
 Equities were down notably this past week largely on lousy housing data and from worries over financial regulation legislation. Stocks tried to get the week off to a good start, initially rising Monday on news over the weekend that China was loosening it trading band on the yuan, allegedly to allow it to appreciate. But equities ended the day flat to down modestly as investors became skeptical of China’s announcement, seeing it as simply posturing ahead of the G-20 meeting. Stocks plunged Tuesday on an unexpected decline existing home sales, raising fears of a double dip in housing. Also, a White House statement that it would appeal a federal judge’s ruling lifting the six-month ban on deep water drilling weighed on the energy patch. Equities were down notably this past week largely on lousy housing data and from worries over financial regulation legislation. Stocks tried to get the week off to a good start, initially rising Monday on news over the weekend that China was loosening it trading band on the yuan, allegedly to allow it to appreciate. But equities ended the day flat to down modestly as investors became skeptical of China’s announcement, seeing it as simply posturing ahead of the G-20 meeting. Stocks plunged Tuesday on an unexpected decline existing home sales, raising fears of a double dip in housing. Also, a White House statement that it would appeal a federal judge’s ruling lifting the six-month ban on deep water drilling weighed on the energy patch.
Equities were modestly mixed Wednesday despite an unexpectedly huge plunge in new home sales. Somewhat offsetting the bad news in housing were a Fed FOMC statement indicating that the Fed is going to keep rates lower longer than previously anticipated and a stronger euro. The euro currently is seen as a worry index over sovereign debt problems of Greece and some other European countries. The less the worry, the stronger the euro is.
The economic news was mostly good on Thursday as jobless claims declined and durables orders excluding transportation were up. But Senate and House negotiations over a final version of financial regulation legislation were at a fever pitch and traders saw banks at risk, sending financial stocks down and most other equities. News from Europe went the other way on Thursday as the cost to protect against default by Greece on sovereign debt rose to an all-time high. Rates also rose on credit-default swaps for contracts on Portugese government securities.
Most major indexes rebounded on Friday on news of the negotiated Senate-House compromise version of financial regulation reform. The latest version was seen as less restrictive than expected. This news outweighed a downward revision to first quarter GDP. Also, consumer sentiment was a little better than forecast. The Russell 2000 got some extra lift on Friday as Russell indexes were to be given their annual reweighting after close.
Equities were down this past week. The Dow was down 2.9 percent; the S&P 500, down 3.6 percent; the Nasdaq, down 3.7 percent; and the Russell 2000, down 3.3 percent.
For the year-to-date, most major indexes are down: the Dow, down 2.7 percent; the S&P 500, down 3.4 percent; and the Nasdaq, down 2.0 percent. The Russell 2000 is up 3.2 percent.
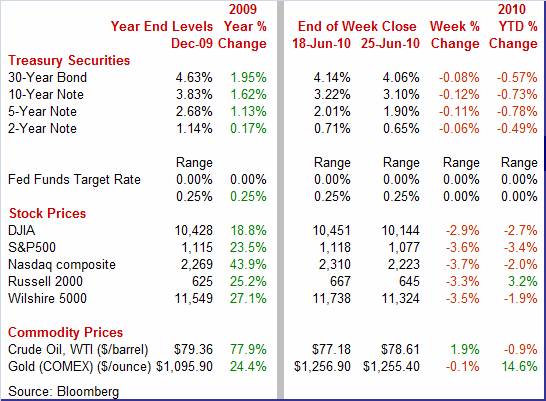
Weekly percent change column reflects percent changes for all components except interest rates. Interest rate changes are reflected in simple differences.
 Treasury rates were down this past week on negative economic news. The biggest dips in yields were on Tuesday, Wednesday, and Friday. Declines those days were in reaction to negative numbers for existing and new home sales. Also bumping down rates on Wednesday was a less robust evaluation of the economy in the Fed’s FOMC statement. Friday’s decrease came on a downward revision to GDP. There was a little firming, however, on Thursday on a drop in jobless claims. Treasury rates were down this past week on negative economic news. The biggest dips in yields were on Tuesday, Wednesday, and Friday. Declines those days were in reaction to negative numbers for existing and new home sales. Also bumping down rates on Wednesday was a less robust evaluation of the economy in the Fed’s FOMC statement. Friday’s decrease came on a downward revision to GDP. There was a little firming, however, on Thursday on a drop in jobless claims.
 For this past week Treasury rates were mostly down as follows: the 2-year note, down 6 basis points; the 5-year note, down 11 basis points; the 7-year note, down 12 basis points; the 10-year bond, down 12 basis points; and the 30-year bond, down 8 basis points. The 3-month T-bill was up 4 basis points. For this past week Treasury rates were mostly down as follows: the 2-year note, down 6 basis points; the 5-year note, down 11 basis points; the 7-year note, down 12 basis points; the 10-year bond, down 12 basis points; and the 30-year bond, down 8 basis points. The 3-month T-bill was up 4 basis points.
The yield curve has flattened during 2010 as the recovery has been less robust than hoped and as inflation has been more subdued than earlier forecast.
 This past week, weather worries ended up trumping all other news affecting oil prices. Spot prices for West Texas Intermediate slipped the first three days of trading on weak housing data and an unexpected rise in oil inventories. After a little-changed Thursday, crude spike almost two and half bucks on reports of a tropical depression forming in the Gulf off the coast of southern Mexico. Traders feared a hurricane could form that would threaten oil production facilities in Mexico, Texas, and elsewhere in the Gulf. This past week, weather worries ended up trumping all other news affecting oil prices. Spot prices for West Texas Intermediate slipped the first three days of trading on weak housing data and an unexpected rise in oil inventories. After a little-changed Thursday, crude spike almost two and half bucks on reports of a tropical depression forming in the Gulf off the coast of southern Mexico. Traders feared a hurricane could form that would threaten oil production facilities in Mexico, Texas, and elsewhere in the Gulf.
 Net for the week, spot prices for West Texas Intermediate rose a moderate $1.43 per barrel to settle at $78.61. Net for the week, spot prices for West Texas Intermediate rose a moderate $1.43 per barrel to settle at $78.61.
Oil prices have been trending back up in since late May. With the Obama Administration’s continued insistence on a temporary ban on new deep water drilling in the Gulf and with hurricane season back, the recent firming in oil prices may stick in coming months, resulting in upward pressure on headline inflation indicators.
It turns out the first quarter was more sluggish than originally believed. But the big story now is the drop in housing now that the April deadline has passed for home sale credits. Until housing demand returns to trend, the economy is depending more on the consumer and on manufacturing to keep the recovery going. And the latest numbers indicate these sectors are up to the challenge.
 Very early this year, many economists expected an easing in growth from the fourth quarter’s rapid pace of 5.6 percent. The inventory contribution was seen as being much less in the first quarter. Very early this year, many economists expected an easing in growth from the fourth quarter’s rapid pace of 5.6 percent. The inventory contribution was seen as being much less in the first quarter.
Economists got the slowing down part right but growth has been revised down regularly. The third estimate for first quarter GDP growth was revised down to an annualized 2.7 pace from the prior estimate of 3.0 percent and an initial estimate of 3.2 percent. The downward revision to GDP growth primarily reflected an upward revision to imports and a downward revision to personal consumption expenditures that were partly offset by upward revisions to exports and to private inventory investment. Final sales of domestic product were revised down to 0.8 percent from the prior estimate of 1.4 percent.
Despite the sluggish first quarter number, components still point to forward momentum. Consumer spending was up an annualized 3.0 percent with equipment & software investment gaining 11.4 percent. The big negatives are not surprises—nonresidential structures, down an annualized 15.5 percent, and residential investment, down 10.3 percent.
Looking ahead, the second quarter will likely pick up strength moderately, based on recent gains in industrial production and in aggregate production hours.
 We’ve seen it before with the cash-for-clunkers program last summer as incentives boosted sales but in part by taking away from future sales. Car purchases spiked as the incentive deadline approached and plunged after it passed. This time home sales are following a similar pattern. We’ve seen it before with the cash-for-clunkers program last summer as incentives boosted sales but in part by taking away from future sales. Car purchases spiked as the incentive deadline approached and plunged after it passed. This time home sales are following a similar pattern.
Here’s what you need to know to fully understand the pattern in sales for different measures of home sales. For qualifying homebuyers to obtain the special tax credits, the contract signing had to be by the end of April. The deadline for closing the contract has been extended to the end of June. So, qualifying contracts signed in April can still close in May and in June and get tax credits. The existing home sales data are based on contract closings while new home sales are based on contract signings.
Existing home sales fell 2.2 percent to an annual sales rate of 5.66 million from April’s 5.79 million. The recent peak in existing home sales was 6.49 million units for November 2009 when the original tax incentives expired. The more recent bump in sales from the second round topped at April’s 5.79 million units. Supply on the market fell only slightly in May and is quite high at 8.3 months and compares with seven-month supply during the buying surge late last year, a spike that was fed by first-round stimulus. High supply will continue to pressure prices which did, however, firm 4.2 percent in May for both the median price ($179,600) and average price ($226,400). The price gains likely were related to a shift in composition to more expensive homes.
While existing home sales in May were propped up by prior-to-May pending sales (signings), new home sales were not.  New home sales could get no lift at all from second-round stimulus since new sales data are based on signings and the deadline had passed the prior month. New home sales could get no lift at all from second-round stimulus since new sales data are based on signings and the deadline had passed the prior month.
New home sales plunged 33.3 percent in May to an annual rate of 300,000, the lowest rate on the books in data going back to 1963. The latest pace compares to an April peak of 446,000 units. Months’ supply on the market, due to the drop in sales, surged to 8.5 months from April's 5.8 months. But the actual number of new homes on the market, down 1,000 in the month to an adjusted 213,000, is the lowest since 1970. With demand expected to be soft for a few months after the tax credit deadline, homebuilders are being quite cautious not to end up with heavy inventories. The median price for new homes sold fell a monthly 1.0 percent to a $200,900—with the year-ago pace at down 9.6 percent.
 What can we learn from cash-for-clunkers that may apply to housing sales' Yes, motor vehicles sales spiked to 14.1 million units annualized in August 2009 but plunged to 9.2 million units in September after special incentives ended. But the good news was that sales returned to trend in just a few months. This, however, was based on a stabilized consumer sector and credit that was not too difficult to get. Housing sales are not likely to return to trend quickly as did auto sales. A home purchase is a much bigger decision than that for a car and consumers are going to remain cautious until the labor market improves further. Also, credit remains relatively tight for home purchases (higher standards). We probably will get a little bounce in new home sales in June, but based on the recent run of weekly mortgage application data, it is going to be some months before sales are back to trend or even considered healthy. What can we learn from cash-for-clunkers that may apply to housing sales' Yes, motor vehicles sales spiked to 14.1 million units annualized in August 2009 but plunged to 9.2 million units in September after special incentives ended. But the good news was that sales returned to trend in just a few months. This, however, was based on a stabilized consumer sector and credit that was not too difficult to get. Housing sales are not likely to return to trend quickly as did auto sales. A home purchase is a much bigger decision than that for a car and consumers are going to remain cautious until the labor market improves further. Also, credit remains relatively tight for home purchases (higher standards). We probably will get a little bounce in new home sales in June, but based on the recent run of weekly mortgage application data, it is going to be some months before sales are back to trend or even considered healthy.
 Despite a negative headline number, May durables orders remain healthy. New factory orders for durable goods in May declined 1.1 percent after jumping a revised 3.0 percent in April. Excluding the transportation component, however, new durable orders rebounded 0.9 percent, following a 0.8 percent decrease in April. Despite a negative headline number, May durables orders remain healthy. New factory orders for durable goods in May declined 1.1 percent after jumping a revised 3.0 percent in April. Excluding the transportation component, however, new durable orders rebounded 0.9 percent, following a 0.8 percent decrease in April.
The big negative in the report was the transportation component which dropped 6.9 percent in May. Nondefense aircraft swung down 29.6 percent after spiking 215.7 percent in April. Yes, you might call that category volatile.
Advances were widespread in other components—including primary metals, machinery, computers & electronics, and other durables. Declines were seen in fabricated metals, communication equipment, and in electrical equipment. The last was negative but essentially flat.
The bottom line is that forward momentum continues in manufacturing—a needed offset to current weakness in housing.
 Just as manufacturing appears to be doing its part to keep the recovery going, so is the consumer despite many obstacles. The Reuters/University of Michigan consumer sentiment index rose to 76.0 for the final June reading, up from 75.5 at mid-June and from 73.6 May and 72.2 in April. Sentiment hit a recent low in mid-April of 69.5. Just as manufacturing appears to be doing its part to keep the recovery going, so is the consumer despite many obstacles. The Reuters/University of Michigan consumer sentiment index rose to 76.0 for the final June reading, up from 75.5 at mid-June and from 73.6 May and 72.2 in April. Sentiment hit a recent low in mid-April of 69.5.
The latest gain in sentiment was led by the current conditions component which rose to 85.6 from 81.0 in May. Consumer spirits are tied most directly with employment conditions and the gain suggests that consumers see the labor market as gradually improving. Recent net gains in the stock market also likely helped boost consumer views of current conditions. The expectations component edged up to 69.8 from May’s 68.8 but actually was down from 70.7 for mid-June.
The bottom line is that the consumer sector is slowly strengthening—a trend favoring the recovery for the overall economy.
 The Fed left the fed funds target rate at a historically low range of zero to 0.25. The target has been unchanged since the Fed’s dramatic move with its December 16, 2008 rate cut. The Fed left the fed funds target rate at a historically low range of zero to 0.25. The target has been unchanged since the Fed’s dramatic move with its December 16, 2008 rate cut.
The latest decision was based largely on a favorable inflation outlook, a continuation of recovery, and gradual improvement in the labor market. The FOMC retained language that the fed funds rate likely will remain exceptionally low for an extended period. The vote was 9 to 1 for the statement with Kansas City Fed President Thomas Hoenig voting against. Hoenig again disliked the “extended period” language.
The Fed took a relatively neutral approach in describing the recovery, merely stating that it is "proceeding" rather than offering a view on whether it is strengthening. This was basically a downgrade in the Fed’s view of the economy. But the meeting participants did acknowledge that the "labor market is improving gradually."
The biggest change in the statement may be regarding financial conditions which "have become less supportive of economic growth on balance, largely reflecting developments abroad. Bank lending has continued to contract in recent months." This is a reference largely to sovereign debt problems of Greece, Spain, and other European countries damping economic growth in Europe and spilling over to the global economy.
 The inflation outlook is a little more favorable due to the decline in prices of energy and other commodities in recent months. According to the Fed, underlying inflation has trended lower. The FOMC expects inflation to remain subdued for some time. The inflation outlook is a little more favorable due to the decline in prices of energy and other commodities in recent months. According to the Fed, underlying inflation has trended lower. The FOMC expects inflation to remain subdued for some time.
Overall, the Fed is in a holding pattern with recent developments in Europe and a soft recovery in the U.S. leaving little other option for now. Since the April policy meeting, financial markets have pushed out when and by how fast the Fed will be tightening short term interest rates. Specifically, the implied fed funds rate in the futures market has come down significantly for rates in late 2010 and throughout 2011. At the end of April, traders expected the Fed to raise the fed funds rate to 0.50 percent by January 2011 and to 1.00 percent by mid-2011 and to 1.50 percent by late 2011. Currently, traders in fed funds futures anticipate no change in the Fed’s target rate until spring 2011 and possibly not until mid-2011.
The recovery likely will continue despite a huge stumble by the housing market as manufacturing remains healthy and the consumer is gradually growing more confident.
The consumer continues to hog the spotlight -- the week is bookended by personal income on Monday and employment on Friday. Given investor concerns about growth, Thursday's ISM report will give us a measure of how robust manufacturing activity was in June.
Personal income posted a solid 0.4 percent increase for April, matching the gain the month before. Importantly, the latest increase was in what really counts as the wages & salaries component advanced 0.4 percent after rising 0.3 percent in March. But overall, personal consumption was flat, following a 0.6 percent rise the prior month. The April decline in PCEs was led by a 0.6 percent drop in nondurables and was mostly price related. Inflation at the consumer level is still almost nonexistent. The headline PCE price index was unchanged in April—easing from up 0.1 percent in March. The core rate also was soft, gaining only 0.1 percent and matching both March and the consensus forecast. More recently, aggregate weekly earnings were up 0.6 percent in May, suggesting a nice boost in the wages & salaries component of personal income. But spending may be down. Retail sales excluding autos dropped 1.1 percent in May. However, unit new motor vehicle sales rebounded 3.8 percent for the month and should soften the overall decline in sales or even boost it. PCE inflation should be soft based on a 0.2 percent decline in May’s headline CPI and a 0.1 percent rise in the core CPI.
Personal income Consensus Forecast for May 10: +0.5 percent
Range: +0.3 to +0.6 percent
Personal consumption expenditures Consensus Forecast for May 10: +0.2 percent
Range: -0.2 to +0.3 percent
Core PCE price index Consensus Forecast for May 10: +0.1 percent
Range: +0.1 to +0.1 percent
The Conference Board's consumer confidence index advanced to 63.3 in May, up notably from April’s 57.9. A big factor behind the improvement was greater optimism about the jobs market. The assessment of the jobs market has improved sizably for a third month with 43.6 percent describing jobs as currently hard to get, still a big number but well down from February's 47.3 percent. If the confidence index tracks last week’s consumer sentiment index, we should see a modest rise for June.
Consumer confidence Consensus Forecast for June 10: 63.3
Range: 61.0 to 65.0
The Chicago PMI eased to 59.7 for May from April’s 63.8 reading. But the latest figure was still far above break-even 50 to indicate month-to-month growth. We are likely to see a healthy reading for June based on the new orders index in May which came in at a robust 62.7.
Chicago PMI Consensus Forecast for June 10: 59.7
Range: 57.0 to 62.9
Initial jobless claims fell back in the June 19 week, down 19,000 to 457,000. The four-week average also fell, though only by a very slight 1,500 to a 462,750 level that is still 5,000 higher than mid-May. The Labor Department was upbeat, saying a downward trend for the series has been re-established and noted that claims in the two preceding weeks were skewed higher by seasonal adjustment problems tied to the Memorial holiday. Looking ahead, it may be difficult to determine the underlying direction of claims as sharp cuts in temporary jobs for the 2010 Census may give claims a boost as some discharged temporary Census workers may be eligible for benefits.
Jobless Claims Consensus Forecast for 6/26/10: 450,000
Range: 445,000 to 460,000
Sales of domestic light motor vehicles in May improved to 8.9 million units annualized from 8.5 million the month before. Most of the improvement was in light trucks which jumped 8.6 percent as domestic auto sales firmed only 0.2 percent. Domestic and import totals hit 11.6 million, following April's 11.2 million.
Motor vehicle domestic sales Consensus Forecast for June 10: 8.9 million-unit rate
Range: 8.2 to 9.0 million-unit rate
The composite index from the ISM manufacturing survey in May came in at 59.7—down slightly from 60.4 in April but still well above breakeven of 50. Based on the new orders index posting a strong 65.7 reading, the June composite should be healthy. However, more recent regional surveys have been mixed with the Philly Fed index for June slipping to 8.0 from 21.4 in May while the New York Fed manufacturing index improved to 19.57 from 19.11 in May (breakeven of zero for both regional surveys).
ISM manufacturing composite index Consensus Forecast for June 10: 59.0
Range: 57.6 to 59.7
Construction spending in April surged 2.7 percent, following a 0.4 percent rebound the month before. The April boost was led by a jump in private residential outlays which gained 4.4 percent after no change the prior month. Public outlays increased 2.4 percent in the latest month while private nonresidential construction rebounded 1.7 percent. Looking ahead, construction outlays are likely to soften—at least the residential component. Housing starts plunged 10.0 percent.
Construction spending Consensus Forecast for May 10: -0.5 percent
Range: -2.0 to +2.7 percent
Nonfarm payroll employment in May surged 431,000, following a 290,000 boost in April, and a 208,000 gain in March. The May boost was the largest since a 472,000 spike in March 2000. But according to the BLS, Census hiring added 411,000 temporary jobs to the payroll gain. Private nonfarm employment increased only 41,000, following a 218,000 boost in April. Average hourly earnings picked up with a 0.3 percent rise in May, following a 0.1 percent advance the month before. The average workweek for all workers edged up to 34.2 hours from 34.1 hours in April. The unemployment rate slipped to 9.7 percent from 9.9 percent in April. Some are already seeing Census layoffs turning the June payroll number negative. Once again, market focus will be on private payrolls to discount the Census effect. Ahead of the Friday release of June numbers, traders may reposition as data come out for ISM employment, ADP, Monster, and jobless claims.
Nonfarm payrolls Consensus Forecast for June 10: -100,000
Range: -165,000 to +431,000
Nonfarm private payrolls Consensus Forecast for June 10: -100,000
Range: +41,000 to +200,000
Unemployment rate Consensus Forecast for June 10: 9.8 percent
Range: 9.6 to 9.9 percent
Average workweek Consensus Forecast for June 10: 34.2 hours
Range: 34.2 to 34.3 hours
Average hourly earnings Consensus Forecast for June 10: +0.1 percent
Range: +0.1 to +0.3 percent
Factory orders in April posted a 1.2 percent increase, following a 1.7 percent gain the prior month. The latest number included a slight downward revision to the advance durables orders figure to a 2.8 percent jump from the initial estimate of 2.9 percent. Nondurables orders for April edged down 0.1 percent after spiking 3.0 percent the month before. More recently, new orders for durables in May declined 1.1 percent after jumping a revised 3.0 percent in April.
Factory orders Consensus Forecast for May 10: -0.5 percent
Range: -2.0 to +1.5 percent
R. Mark Rogers is the author of The Complete Idiot’s Guide to Economic Indicators, Penguin Books, October 2009.
Econoday Senior Writer Mark Pender contributed to this article.
|
