|
This past week of economic data made it all but certain that the U.S. economy is in recession. Third quarter GDP posted a negative growth rate and monthly indicators suggest it is only going to get worse. And the Fed’s FOMC announcement was quite gloomy. But instead of facing economic reality, equity markets decided to end the month on a positive note, partying in part to the fact that the Fed did cut interest rates and did indicate that the door is still open for additional cuts.
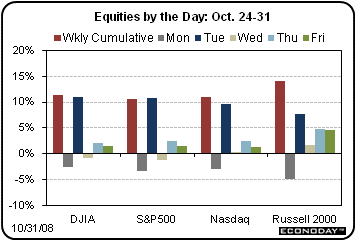 Equity moves last week often were despite the economic data. A case in point was on Tuesday when the Conference Board’s consumer confidence index hit a record low before market open. Instead of declining, the Dow posted its second largest point gain ever. Bolstering stocks were the belief that the Fed would be easing the next day and by the fact that quite a few companies were taking up the Fed’s offer to buy up commercial paper. The new lending facility was seen as unfreezing credit markets. Equity moves last week often were despite the economic data. A case in point was on Tuesday when the Conference Board’s consumer confidence index hit a record low before market open. Instead of declining, the Dow posted its second largest point gain ever. Bolstering stocks were the belief that the Fed would be easing the next day and by the fact that quite a few companies were taking up the Fed’s offer to buy up commercial paper. The new lending facility was seen as unfreezing credit markets.
Sizeable gains were also seen on Thursday and Friday. Thursday’s gains were boosted by the fact that third quarter GDP fell marginally less than expected and by the additional sizes the credit markets were easing – notably a coming down in the TED spread (Treasury-Euro-dollar). Also, rate cuts by the Fed and other central banks continued to lift investors’ moods and equities into Friday. Financials led on Friday but gains were widespread.
The problem, however, with last week’s equity price increases is that they fly in the face of worsening economic data. The list was somewhat long. New home sales edged up but remained extremely low. Consumer confidence hit a record low. Durables orders excluding aircraft fell again. GDP was negative with the all important consumer sector pulling it down. Jobless claims remained high. The Chicago purchasers’ index fell sharply. And consumer sentiment remained barely above record lows.
So, why were investors so inspired' Yes, the Fed cut rates but no one is lending to consumers and businesses. Credit markets are warming up – more money is available, but again no one is lending. And now, consumers themselves do not want to spend. It probably is a good idea to rethink the optimism.
 Equities were up this past week. The Dow was up 11.3 percent; the S&P 500, up 10.5 percent; the Nasdaq, up 10.9 percent; and the Russell 2000, up 14.1 percent. Equities were up this past week. The Dow was up 11.3 percent; the S&P 500, up 10.5 percent; the Nasdaq, up 10.9 percent; and the Russell 2000, up 14.1 percent.
But despite the notable gains for the week, equity indexes posted their largest percentage monthly losses since October 1987. The Dow was down 14.1 percent; the S&P 500, down 16.8 percent; the Nasdaq, down 17.4 percent; and the Russell 2000, down 20.9 percent.
For the year-to-date, major indexes are down as follows: the Dow, down 29.7 percent; the S&P 500, down 34.0 percent; the Nasdaq, down 35.1 percent; and the Russell 2000, down 29.8 percent.
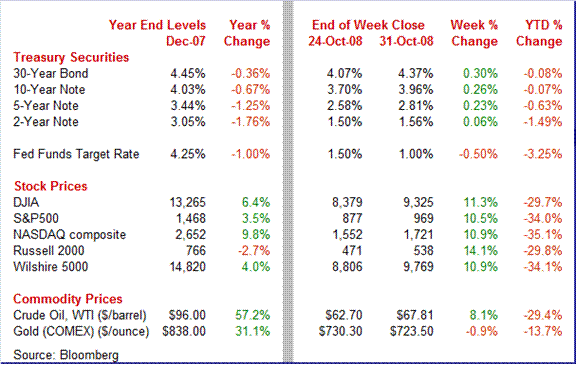
Weekly percent change column reflects percent changes for all components except interest rates. Interest rate changes are reflected in simple differences.
 Treasury yields ended the past week mixed with the near end lower and far end rates higher. The drop in short-term yields was due to the Fed cutting its target rate for overnight lending between banks to 1.0 percent – a cut of 50 basis points. Treasury yields ended the past week mixed with the near end lower and far end rates higher. The drop in short-term yields was due to the Fed cutting its target rate for overnight lending between banks to 1.0 percent – a cut of 50 basis points.
But there were a variety of reasons why long-term yields rose. On Tuesday, Anthony Ryan, acting Treasury undersecretary for domestic finance, stated that the U.S. government is headed toward “unprecedented” financing needs. He believes that the Treasury will have to sell more longer dated Treasuries to meet those needs. This increased supply will weigh on prices.
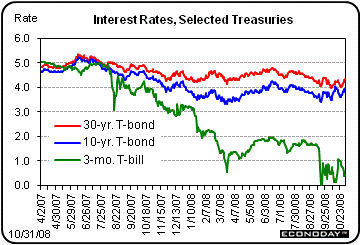 But currently, signs of thawing in credit markets this past week led to some reduction in demand for Treasuries. Also, funds flowed out of fixed income markets and into stocks as equities rebounded smartly this past week. Finally, long term inflation expectations appear to be rising and boosting long yields. This past week, the difference between rates on 10-year Treasury Inflation Protected Securities (TIPS) and comparable notes jumped sharply. But currently, signs of thawing in credit markets this past week led to some reduction in demand for Treasuries. Also, funds flowed out of fixed income markets and into stocks as equities rebounded smartly this past week. Finally, long term inflation expectations appear to be rising and boosting long yields. This past week, the difference between rates on 10-year Treasury Inflation Protected Securities (TIPS) and comparable notes jumped sharply.
For this past week Treasury rates were mixed as follows: 3-month T-bill, down 41 basis points, the 2-year note, up 6 basis points; the 5-year note, up 23 basis points; the 10-year bond, up 26 basis points; and the 30-year bond, up 30 basis points.
 Oil prices netted a moderate gain for the week. As usual there were some notable swings during the week. On Tuesday, spot crude oil hit a 17-month low at $62.70 per barrel – the lowest since $62.55 set on May 16, 2007. Prices had been damped by a report from MasterCard indicating a weekly drop in credit card swipes at gas stations. But the Fed’s rate cut on Wednesday led to a rise in crude on the belief that the economy would strengthen – adding to the fact that weekly inventories were not up as much as expected. Prices also spiked late Friday, apparently on end-of-month window dressing with some investors locking in profits from short positions. Despite the intraweek swings in prices, the bottom line is that demand for oil is seen as relatively soft in coming months because of weakness in the economy. Oil prices netted a moderate gain for the week. As usual there were some notable swings during the week. On Tuesday, spot crude oil hit a 17-month low at $62.70 per barrel – the lowest since $62.55 set on May 16, 2007. Prices had been damped by a report from MasterCard indicating a weekly drop in credit card swipes at gas stations. But the Fed’s rate cut on Wednesday led to a rise in crude on the belief that the economy would strengthen – adding to the fact that weekly inventories were not up as much as expected. Prices also spiked late Friday, apparently on end-of-month window dressing with some investors locking in profits from short positions. Despite the intraweek swings in prices, the bottom line is that demand for oil is seen as relatively soft in coming months because of weakness in the economy.
Net for the week, spot prices for West Texas Intermediate rebounded $5.11 per barrel to settle at $67.81 – and coming in $77.48 below the record settle of $145.29 per barrel set on July 3.
Despite a moderate turnaround this past week, crude oil ended the month down 32.6 percent – the largest monthly loss on record.
The economy now is almost certainly in recession. The third quarter contracted mildly but there are signs it is going to be significantly worse in the fourth quarter.
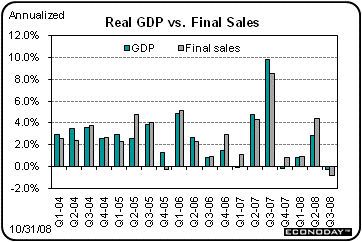 It’s almost official. Third quarter GDP has added to the growing list of arguments that the U.S. economy is in recession. The Commerce Department’s initial estimate for third quarter GDP came in at minus 0.3 and followed a 2.8 percent boost the prior quarter. It’s almost official. Third quarter GDP has added to the growing list of arguments that the U.S. economy is in recession. The Commerce Department’s initial estimate for third quarter GDP came in at minus 0.3 and followed a 2.8 percent boost the prior quarter.
Although the decline was not large, the reasons behind it were widespread. The drop in growth was due to a fall in personal consumption, weaker residential investment, a decline in nonresidential fixed investment, slower growth in exports, and a less negative import decline. On the positive side, inventories fell less rapidly and government purchases accelerated.
The continued decline in inventories is good news in that there is not much inventory overhang for manufacturers or many other businesses weighing on future production. But weakness in the consumer sector is disconcerting as this sector is the largest in the economy. If consumers are pulling back – as is likely due to job and debt problems – then it will be difficult for the economy to get back to positive growth. Additionally, housing declined at an accelerated pace – residential investment had not hit bottom in the second quarter as many had hoped. More discussion on the consumer sector is below in the personal income report analysis.
 On the inflation front, the GDP price index jumped to an annualized 4.2 percent from 1.1 percent in the second quarter. Headline PCE inflation is still reflecting higher oil prices for the quarterly average with a surge to 5.4 percent annualized after a 4.3 percent jump in the second quarter. Core PCE inflation rose 2.9 percent, compared to 2.2 percent the previous quarter. On the inflation front, the GDP price index jumped to an annualized 4.2 percent from 1.1 percent in the second quarter. Headline PCE inflation is still reflecting higher oil prices for the quarterly average with a surge to 5.4 percent annualized after a 4.3 percent jump in the second quarter. Core PCE inflation rose 2.9 percent, compared to 2.2 percent the previous quarter.
As discussed in the personal income section, there has been more recent improvement in PCE inflation in the monthly numbers.
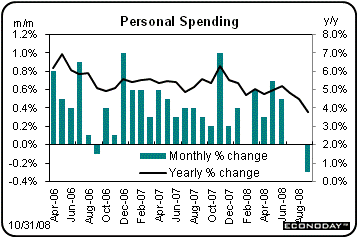 The September personal income report came in much as expected but clearly showed significant erosion in the consumer sector. Personal income growth was sluggish, edging up 0.2 percent, following a 0.4 percent rebound in August. The wages and salaries component was even more anemic, nudging up a slim 0.1 percent in September, after posting a 0.4 percent boost the previous month. The September personal income report came in much as expected but clearly showed significant erosion in the consumer sector. Personal income growth was sluggish, edging up 0.2 percent, following a 0.4 percent rebound in August. The wages and salaries component was even more anemic, nudging up a slim 0.1 percent in September, after posting a 0.4 percent boost the previous month.
But more importantly, consumers are pulling back on spending despite modest gains income. Personal consumption expenditures dropped 0.3 percent, following no change in August. Most of the weakness in the latest month was in durables with a monthly 2.9 percent fall – with a drop in auto sales being a key cause. Nondurables also declined, by 0.8 percent, while services rose 0.2 percent.
The spending numbers were even worse after taking into account inflation. Real PCEs dropped 0.4 percent in September after no change the month before. Real PCEs have been either negative or flat for the last four months.
 Lower oil prices and a weakening economy are having favorable effects on inflation. Headline PCE price inflation remained modest, rising an incremental 0.1 percent, following a flat reading in August. The core PCE price index inflation rate was unchanged with a 0.2 percent. Lower oil prices and a weakening economy are having favorable effects on inflation. Headline PCE price inflation remained modest, rising an incremental 0.1 percent, following a flat reading in August. The core PCE price index inflation rate was unchanged with a 0.2 percent.
The latest monthly numbers are helping to ease longer-term numbers toward the Fed’s comfort zone. PCE inflation slowed to up 4.2 percent from up 4.5 percent the month before. Core PCE inflation softened to 2.4 percent from 2.5 percent in August. Both headline and core PCE price inflation remain above the Fed’s implicit inflation target range of 1-1/2 to 2 percent annualized but are likely headed toward that zone as the economy continues to be weak.
The bottom line from the personal income report is that the consumer sector is losing momentum and likely will not be contributing to overall economic growth in coming months. The latest numbers on consumer attitudes are confirming this.
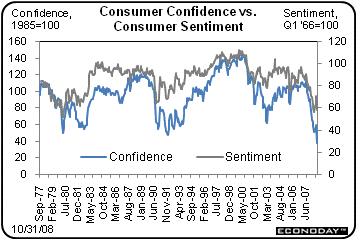 Gyrations in the financial markets and a weakening labor market have pummeled consumer confidence. According to the Conference Board, consumer confidence in October plunged to a record low, falling more than 20 points to 38.0 and the lowest reading in more than 40 years of data. Gyrations in the financial markets and a weakening labor market have pummeled consumer confidence. According to the Conference Board, consumer confidence in October plunged to a record low, falling more than 20 points to 38.0 and the lowest reading in more than 40 years of data.
There were additional negative angles in the consumer confidence report. The employment outlook is not good as those saying jobs are currently plentiful fell nearly 4 percentage points to only 8.9 percent. Prospects for auto dealers are turning grim as those saying they expect to buy a car in the next six months hit a record low.
The Reuters/University of Michigan consumer sentiment index corroborated how low consumer attitudes have fallen. The late October reading came in at 57.6 and was little changed from the mid-month reading of 57.5 but was still deeply lower than the September reading of 70.3. The assessment of current conditions weakened the most in October, to 58.4 and very close to the expectations reading of 57.0. All readings are at or near record lows covering nearly 60 years of data.
Both the consumer confidence and consumer sentiment indexes suggest that consumers will be tight with their cash in coming months, probably letting the economy slip further.
 After the depressing news in housing over recent months, you take what good news you can get. The new home sales report for September, together with the prior week's stronger report on existing homes, are hinting at the possibility that this sector has bottomed. New home sales came in at an annual rate of 464,000, up 2.7 percent on the month. The 464,000 rate, nevertheless, marks the first back-to-back sub-500 rates since the 1991 recession. The lower level of housing starts is finally impacting supply somewhat. Supply slipped to 10.4 months from 11.4 months in August. Builders are definitely cutting back as the number of new homes for sale, at 394,000, is the lowest in four years. After the depressing news in housing over recent months, you take what good news you can get. The new home sales report for September, together with the prior week's stronger report on existing homes, are hinting at the possibility that this sector has bottomed. New home sales came in at an annual rate of 464,000, up 2.7 percent on the month. The 464,000 rate, nevertheless, marks the first back-to-back sub-500 rates since the 1991 recession. The lower level of housing starts is finally impacting supply somewhat. Supply slipped to 10.4 months from 11.4 months in August. Builders are definitely cutting back as the number of new homes for sale, at 394,000, is the lowest in four years.
But the bump up in sales clearly is coming from required heavy discounting. The median price declined 0.9 percent for the latest month to $218,400 and was also the lowest in four years. The year-ago decline stood at 9.1 percent.
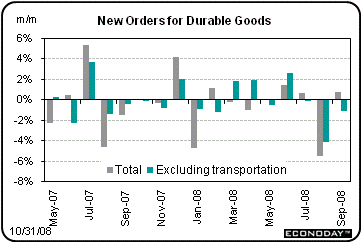 Durable goods orders in September unexpectedly rebounded but you have to look at the details to realize that the trend is still down. Durable goods orders rose 0.8 percent in September, following a 5.5 percent decrease in August. However, excluding the transportation component, new orders fell 1.1 percent, after a 4.1 percent drop the month before. Durable goods orders in September unexpectedly rebounded but you have to look at the details to realize that the trend is still down. Durable goods orders rose 0.8 percent in September, following a 5.5 percent decrease in August. However, excluding the transportation component, new orders fell 1.1 percent, after a 4.1 percent drop the month before.
The gain in the latest headline number was the result of a surge in aircraft orders – up 10.1 percent for defense aircraft and up 29.7 percent for nondefense aircraft. Outside of aircraft, durables orders remain weak.
 Strength in September was led by transportation which jumped 6.3 percent and included aircraft orders. Also posting gains were machinery and electrical equipment. But there were sharp declines in a number of other components. Industries with lower orders were primary metals, fabricated metals, computers & electronics, and communications equipment. Strength in September was led by transportation which jumped 6.3 percent and included aircraft orders. Also posting gains were machinery and electrical equipment. But there were sharp declines in a number of other components. Industries with lower orders were primary metals, fabricated metals, computers & electronics, and communications equipment.
September’s report also showed a softening in business investment in equipment. Nondefense capital goods orders rose 0.8 percent after a 7.7 percent drop in August. But excluding aircraft, orders for nondefense capital goods declined 1.4 percent after decreasing 2.2 percent in August. The latest numbers indicate that businesses are pulling back on investment spending in coming months due to weakness in the economy and also likely due to reduced availability of credit.
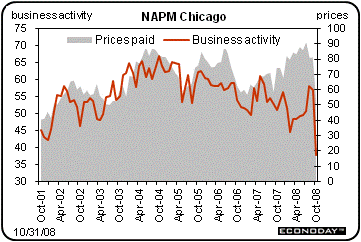 More current data are looking nasty. The Chicago purchasers’ index plunged nearly 20 points from a solid 56.7 in September to a deeply recessionary 37.8 in October. Disastrous data on orders point to perhaps deeper lows in the months ahead. The new orders index fell more than 20 points to 32.5 and backlog orders fell nearly 15 points to 39.0. Also falling sharply were production and employment indexes. Economic weakness is translating into lower prices for energy and other commodities as the prices paid index fell nearly 30 points to 53.7. More current data are looking nasty. The Chicago purchasers’ index plunged nearly 20 points from a solid 56.7 in September to a deeply recessionary 37.8 in October. Disastrous data on orders point to perhaps deeper lows in the months ahead. The new orders index fell more than 20 points to 32.5 and backlog orders fell nearly 15 points to 39.0. Also falling sharply were production and employment indexes. Economic weakness is translating into lower prices for energy and other commodities as the prices paid index fell nearly 30 points to 53.7.
While the Chicago purchasing managers’ index is known to be very volatile due to low sample size, the latest numbers still have to be very disconcerting. They bode ill for next week’s ISM report and the October employment report.
 The Fed appears to be taking the stance that it will not hold back on its ammunition in its gunfight with recession. As expected the Federal Reserve cut its key policy rates by 50 basis points. The Fed by a vote of 10 to 0 lowered the fed funds target rate to 1.0 percent and the discount rate to 1.25 percent. The Fed cited slowing economic activity and "intensification of market turmoil” as reasons for the cuts. Also supporting the policy actions were "declines in the prices of energy and other commodities” and the expectation that inflation will moderate in coming quarters. The Fed appears to be taking the stance that it will not hold back on its ammunition in its gunfight with recession. As expected the Federal Reserve cut its key policy rates by 50 basis points. The Fed by a vote of 10 to 0 lowered the fed funds target rate to 1.0 percent and the discount rate to 1.25 percent. The Fed cited slowing economic activity and "intensification of market turmoil” as reasons for the cuts. Also supporting the policy actions were "declines in the prices of energy and other commodities” and the expectation that inflation will moderate in coming quarters.
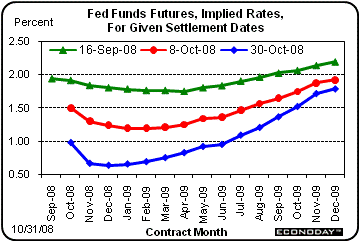 The FOMC left the door open on future rate cuts saying that it will monitor economic and financial developments and will "act as needed.” In fact, even though the Fed stated that recent policy actions and official steps to strengthen should help to improve credit markets over time, the committee found that "downside risks to growth remain" – suggesting that the FOMC may be leaning toward another rate cut. The FOMC left the door open on future rate cuts saying that it will monitor economic and financial developments and will "act as needed.” In fact, even though the Fed stated that recent policy actions and official steps to strengthen should help to improve credit markets over time, the committee found that "downside risks to growth remain" – suggesting that the FOMC may be leaning toward another rate cut.
From September of last year, the Fed has cut the fed funds target rate from 5.25 percent to 1.00 percent for a cumulative 425 basis point drop.
Looking forward, most traders in the fed funds futures market actually are expecting the Fed to cut the target rate to 0.50 percent at the next meeting in December – while others merely expect a 25 basis point cut to 0.75 percent.
The limited amount of Fedspeak after the FOMC meeting indicated that Fed officials are more pessimistic about the near-term economic outlook. San Francisco Fed President Janet Yellen confirmed that the Fed would not rule out cutting the fed funds target below 1 percent if conditions warranted. She also was gloomy about the economic outlook and expected fourth quarter GDP to decline "significantly." The San Francisco Fed president stated that the credit crunch still has a long way to go before there is significant improvement. But on a positive note, she believes that there are "tentative" signs of stress easing in credit markets.
The bottom line is that the Fed sees a period of negative growth ahead, although they have not come out and specifically stated such. But on November 19, we get to see the Fed’s revised economic forecast and whether they actually put negative numbers on the record.
Although equity markets rebounded notably this past week, it appears that many traders were ignoring the plethora of negative economic data. The evidence is that there is widespread weakness in the economy that improving credit market conditions may be too late to fix in a hurry. Housing is still depressed – although hopefully leveling off. Manufacturing is declining as even foreign economies are contracting and will not be boosting U.S. exports as in recent months. Most importantly, the consumer sector is weakening significantly. Employment and income growth are very soft. Low confidence is making consumers reluctant to spend. And the hard to quantify – consumer debt is finally being addressed by lenders and consumers alike. Consumer spending likely will be sluggish at best for months.
On an important timing note, the U.S. returns to standard time Sunday morning, November 2.
Market moving indicators bracket this coming week with the ISM manufacturing index out on Monday and the all important employment report for October released on Friday. But markets also have other key issues to digest – the U.S. presidential election’s impact on the economy and the Treasury’s quarterly refunding statement on Wednesday that may shed light on the Treasury’s financial rescue plan.
The Institute for Supply Management's manufacturing index in September fell to 43.5 from 49.9 in August. The September drop was very sharp compared to typical monthly changes. But the drop in the new orders index was even worse. New orders plunged nearly 10 points to 38.8 from 48.3 in a reading that points to sustained overall contraction in the months ahead. The prices paid index eased dramatically, confirming a drop in demand, to 53.5 from 77.0 in August.
ISM manufacturing index Consensus Forecast for October 08: 41.5
Range: 37.8 to 48.5
Construction spending was unchanged in August, following a decline of 1.4 percent in the prior month. Strength in the latest month was primarily in public outlays, which rose 0.8 percent after a 1.3 percent boost in July. Residential outlays rebounded 0.3 percent after a 3.9 percent fall the prior month. But the private nonresidential component is showing new weakness, declining 0.8 percent in August, following a 1.1 percent decrease in July. Given that slowing revenue growth for states portends an easing on public construction, there is no major component in construction outlays where the outlook is positive.
Construction spending Consensus Forecast for September 08: -0.8 percent
Range: -1.5 to -0.2 percent
U.S presidential election
Sales of domestic motor vehicles proved very weak in September. Unit sales of North American-made vehicles fell to an annual rate of 9.4 million, down from 10.4 million in August. While weakness is partly related to the end of discounts, the trend is not good and likely reflects reduced credit availability and consumers retrenching.
Motor vehicle domestic sales Consensus Forecast for October 08: 9.2 million-unit rate
Range: 8.4 to 9.6 million-unit rate
Factory orders contracted severely in August but, based the latest durables report, may have posted a modest gain in September. Overall factory orders plunged 4.0 percent in August, reflecting a sharp contraction for durable goods and a moderate dip on the nondurables side that reflected lower prices for energy. Even though recent manufacturing surveys have been negative, the advance report for durables orders for September was on the positive side due to a surge in aircraft orders. New durables orders rose 0.8 percent in September and this likely will give some lift to overall factory orders for September. But the wild card is oil prices. The recent, sharp fall in oil prices will bring nondurables orders down and this very well could pull overall factory orders down for September. Regardless of the overall number, it will be important to sort out the durables and nondurables components for September.
Factory orders Consensus Forecast for September 08: -0.7 percent
Range: -2.9 to +1.5 percent
The Treasury quarterly refunding statement will be released this morning and will give financial markets more details about how the Treasury’s rescue plan for the financial system is developing.
The composite index from the ISM non-manufacturing survey surprisingly held relatively steady in September, slipping only 4 tenths to a 50.2. Essentially, conditions were flat in both September and August. But the economy has worsened since with job losses increasing and consumer confidence hitting a record low, and mass layoffs have increased - suggesting that the non-manufacturing sector is weakening.
Composite index Consensus Forecast for October 08: 47.5
Range: 42.0 to 50.5
Initial jobless claims held steady in the week ending October 25, unchanged at 479,000. Nonetheless, this is a high level which has been boosted in recent weeks by the continuing effects from hurricanes. There could be some easing as workers in hurricane hit areas get back to work. But growing concerns over recession could lead employers to hand out more pink slips.
Jobless Claims Consensus Forecast for 11/1/08: 480,000
Range: 460,000 to 500,000
Nonfarm productivity most recently was revised to an annualized 4.3 percent increase for the second quarter while unit labor costs were revised to a 0.5 percent annualized decline. But the third quarter is likely to not be nearly as good. The advance figure for third quarter GDP was a minus 0.3 percent and this strongly suggests that the output component of productivity will be flat to slightly negative. But employers have been cutting back on jobs and worker hours and that may keep productivity from slowing too much.
Nonfarm Productivity Consensus Forecast for initial Q3 08: +0.8 percent annual rate
Range: -0.1 to +2.2 percent annual rate
Unit Labor Costs Consensus Forecast for initial Q3 08: +2.8 percent annual rate
Range: +0.3 to +4.8 percent annual rate
Nonfarm payroll employment has been on a downtrend all year with the most recent drop coming in at 159,000 for September. High initial claims and increased mass layoffs point to further payroll losses in October and in coming months. We also are likely to see continued softness in hours worked. Average weekly hours slipped to 33.6 hours in September from 33.7 hours in August. The sluggish labor market has started to impact earnings also. Average hourly earnings eased to a 0.2 percent rise in September, following a 0.4 percent gain the month before. The market had projected a 0.3 percent increase. Most economists expect the unemployment rate to resume its rise. In September, the civilian unemployment rate held steady at 6.1 percent.
Nonfarm payrolls Consensus Forecast for October 08: -200,000
Range: -250,000 to -85,000
Unemployment rate Consensus Forecast for October 08: 6.3 percent
Range: 6.2 to 6.5 percent
Average workweek Consensus Forecast for October 08: 33.6 hours
Range: 33.4 to 33.7 hours
Average hourly earnings Consensus Forecast for October 08: +0.2 percent
Range: +0.2 to +0.3 percent
The pending home sales index surged 7.4 percent in August for a year-on-year gain of 8.8 percent. Lower home prices finally may be attracting buyers. But with unemployment rising, the question is which the August improvement in sales will continue.
Pending home sales Consensus Forecast for September 08: 90.6
Range: 87.8 to 92.0
Consumer credit in August plunged $7.9 billion for the first month-to-month decline in nearly 11 years. The decline was centered in non-revolving credit which fell $7.3 billion. With auto sales falling, there's little reason to expect gains in this category for September. Additionally, there is anecdotal evidence that banks and credit card companies are lowering existing credit lines for many consumers and this will crimp credit growth in coming months.
Consumer credit Consensus Forecast for September 08: -$0.5 billion
Range: -$6.0 billion to +$5.2 billion
Econoday Senior Writer Mark Pender contributed to this article.
|

![[Econoday]](images/econoday_logo_slim.gif)
![[Econoday]](images/logo.gif)


 Equity moves last week often were despite the economic data. A case in point was on Tuesday when the Conference Board’s consumer confidence index hit a record low before market open. Instead of declining, the Dow posted its second largest point gain ever. Bolstering stocks were the belief that the Fed would be easing the next day and by the fact that quite a few companies were taking up the Fed’s offer to buy up commercial paper. The new lending facility was seen as unfreezing credit markets.
  Equities were up this past week. The Dow was up 11.3 percent; the S&P 500, up 10.5 percent; the Nasdaq, up 10.9 percent; and the Russell 2000, up 14.1 percent.
 Treasury yields ended the past week mixed with the near end lower and far end rates higher. The drop in short-term yields was due to the Fed cutting its target rate for overnight lending between banks to 1.0 percent – a cut of 50 basis points.
  But currently, signs of thawing in credit markets this past week led to some reduction in demand for Treasuries. Also, funds flowed out of fixed income markets and into stocks as equities rebounded smartly this past week. Finally, long term inflation expectations appear to be rising and boosting long yields. This past week, the difference between rates on 10-year Treasury Inflation Protected Securities (TIPS) and comparable notes jumped sharply.
  Oil prices netted a moderate gain for the week. As usual there were some notable swings during the week. On Tuesday, spot crude oil hit a 17-month low at $62.70 per barrel – the lowest since $62.55 set on May 16, 2007. Prices had been damped by a report from MasterCard indicating a weekly drop in credit card swipes at gas stations. But the Fed’s rate cut on Wednesday led to a rise in crude on the belief that the economy would strengthen – adding to the fact that weekly inventories were not up as much as expected. Prices also spiked late Friday, apparently on end-of-month window dressing with some investors locking in profits from short positions. Despite the intraweek swings in prices, the bottom line is that demand for oil is seen as relatively soft in coming months because of weakness in the economy.
 It’s almost official. Third quarter GDP has added to the growing list of arguments that the U.S. economy is in recession. The Commerce Department’s initial estimate for third quarter GDP came in at minus 0.3 and followed a 2.8 percent boost the prior quarter.
  On the inflation front, the GDP price index jumped to an annualized 4.2 percent from 1.1 percent in the second quarter. Headline PCE inflation is still reflecting higher oil prices for the quarterly average with a surge to 5.4 percent annualized after a 4.3 percent jump in the second quarter. Core PCE inflation rose 2.9 percent, compared to 2.2 percent the previous quarter.
 The September personal income report came in much as expected but clearly showed significant erosion in the consumer sector. Personal income growth was sluggish, edging up 0.2 percent, following a 0.4 percent rebound in August. The wages and salaries component was even more anemic, nudging up a slim 0.1 percent in September, after posting a 0.4 percent boost the previous month.
  Lower oil prices and a weakening economy are having favorable effects on inflation. Headline PCE price inflation remained modest, rising an incremental 0.1 percent, following a flat reading in August. The core PCE price index inflation rate was unchanged with a 0.2 percent.
  Gyrations in the financial markets and a weakening labor market have pummeled consumer confidence. According to the Conference Board, consumer confidence in October plunged to a record low, falling more than 20 points to 38.0 and the lowest reading in more than 40 years of data.
  After the depressing news in housing over recent months, you take what good news you can get. The new home sales report for September, together with the prior week's stronger report on existing homes, are hinting at the possibility that this sector has bottomed. New home sales came in at an annual rate of 464,000, up 2.7 percent on the month. The 464,000 rate, nevertheless, marks the first back-to-back sub-500 rates since the 1991 recession. The lower level of housing starts is finally impacting supply somewhat. Supply slipped to 10.4 months from 11.4 months in August. Builders are definitely cutting back as the number of new homes for sale, at 394,000, is the lowest in four years.
 Durable goods orders in September unexpectedly rebounded but you have to look at the details to realize that the trend is still down. Durable goods orders rose 0.8 percent in September, following a 5.5 percent decrease in August. However, excluding the transportation component, new orders fell 1.1 percent, after a 4.1 percent drop the month before.
  Strength in September was led by transportation which jumped 6.3 percent and included aircraft orders. Also posting gains were machinery and electrical equipment. But there were sharp declines in a number of other components. Industries with lower orders were primary metals, fabricated metals, computers & electronics, and communications equipment.
 More current data are looking nasty. The Chicago purchasers’ index plunged nearly 20 points from a solid 56.7 in September to a deeply recessionary 37.8 in October. Disastrous data on orders point to perhaps deeper lows in the months ahead. The new orders index fell more than 20 points to 32.5 and backlog orders fell nearly 15 points to 39.0. Also falling sharply were production and employment indexes. Economic weakness is translating into lower prices for energy and other commodities as the prices paid index fell nearly 30 points to 53.7.
  The Fed appears to be taking the stance that it will not hold back on its ammunition in its gunfight with recession. As expected the Federal Reserve cut its key policy rates by 50 basis points. The Fed by a vote of 10 to 0 lowered the fed funds target rate to 1.0 percent and the discount rate to 1.25 percent. The Fed cited slowing economic activity and "intensification of market turmoil” as reasons for the cuts. Also supporting the policy actions were "declines in the prices of energy and other commodities” and the expectation that inflation will moderate in coming quarters.
 The FOMC left the door open on future rate cuts saying that it will monitor economic and financial developments and will "act as needed.” In fact, even though the Fed stated that recent policy actions and official steps to strengthen should help to improve credit markets over time, the committee found that "downside risks to growth remain" – suggesting that the FOMC may be leaning toward another rate cut.