|
This past week was quiet on the economic indicator front. Even though credit markets appeared to be loosening somewhat, recession fears were running rampant. In turn, equities resumed their plummet with many indexes dropping below their October 10, 2008 lows.
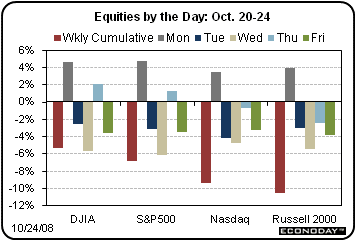 Despite a relatively quiet week for economic indicators, most equity indexes this past week dropped below the lows from two weeks ago. However, stocks were up at the start of the week on modestly favorable comments from Fed Chair Bernanke on the possibility of a second fiscal stimulus package. Bernanke did emphasize his preference that stimulus focus on getting credit to consumers and businesses. Despite a relatively quiet week for economic indicators, most equity indexes this past week dropped below the lows from two weeks ago. However, stocks were up at the start of the week on modestly favorable comments from Fed Chair Bernanke on the possibility of a second fiscal stimulus package. Bernanke did emphasize his preference that stimulus focus on getting credit to consumers and businesses.
But after a nice jump in equities on Monday, it was mostly downhill the rest of the week. Mostly underwhelming earnings reports tugged many stocks down. Despite good earnings numbers from Apple, techs generally declined during the week with Texas Instruments leading the way.
During the week, lower oil prices pulled the energy sector down while lower prices for other commodities pulled down mining companies. Chevron, Exxon Mobil, and Alcoa were victims of the lower oil and commodity prices. Financials were mixed but mostly down on recession fears. In particularly, Bank of America was down sharply. For financials overall, consumer credit conditions were seen as worsening in coming quarters with slower paybacks on mortgage and consumer debt.
A big hit by a Dow member was taken by Ford Motor Co. as billionaire investor Kirk Kerkorian’s Tracinda Corp. announced it was likely to sell its huge holdings of Ford shares. Another key company weighing on the Dow was Boeing which is still suffering a labor strike.
Throughout the week, news from overseas cast a gloom over U.S. equities as a number of foreign equity exchanges plummeted on both credit market woes and reported declines in economic growth with the most recent addition to the list of countries in contraction being the U.K.
The one piece of economic news the U.S. markets did give attention was one that is generally overlooked – the Labor Department’s report on mass layoffs. The number of company layoffs affecting 50 workers or more rose in September to the highest level since September 2001. This news heightened recession worries.
Equities were down this past week. The Dow was down 5.3 percent; the S&P 500, down 6.8 percent; the Nasdaq, down 9.3 percent; and the Russell 2000, down 10.5 percent.

For the year-to-date, major indexes are down as follows: the Dow, down 36.8 percent; the S&P 500, down 40.3 percent; the Nasdaq, down 41.5 percent; and the Russell 2000, down 38.5 percent.
Since the Dow’s peak on October 10, 2007, major indexes are down as follows: the Dow, down 40.5 percent; the S&P 500, down 43.9 percent; the Nasdaq, down 44.8 percent; and the Russell 2000, down 44.3 percent.
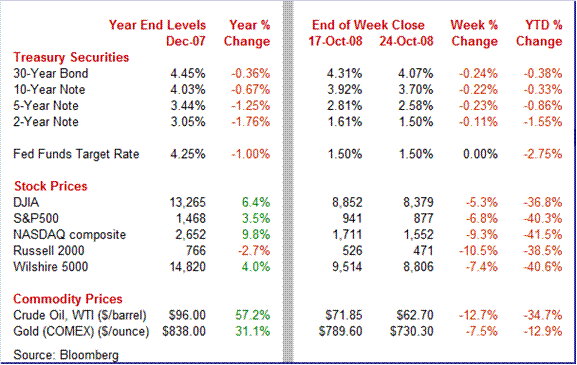
Weekly percent change column reflects percent changes for all components except interest rates. Interest rate changes are reflected in simple differences.
 Treasury yields were down notably for the week except on the near end. For this past week Treasury rates were mostly down as follows: the 2-year note, down 11 basis points; the 5-year note, down 23 basis points; the 10-year bond, down 22 basis points; and the 30-year bond, down 24 basis points. The 3-month T-bill firmed by 6 basis points, Treasury yields were down notably for the week except on the near end. For this past week Treasury rates were mostly down as follows: the 2-year note, down 11 basis points; the 5-year note, down 23 basis points; the 10-year bond, down 22 basis points; and the 30-year bond, down 24 basis points. The 3-month T-bill firmed by 6 basis points,
Economic indicators had little to do with rate movements – especially since there were only two indicators and second tier at that. And the markets ignored both leading indicators and existing home sales. But what did get bond market attention were broader trends. These included a continued drop in the price of oil, a strengthening dollar, and a more pervasive belief that a significant global recession is developing. Additionally, inflation expectations are coming down. All of these factors worked to ease rates.
On the near-end, there were countervailing forces. Bets increased that the Fed will cut the fed funds target rate by 50 basis points on Wednesday afternoon, October 29. But helping firm short Treasury rates was improved access to liquidity – notably from some of the Fed’s newer facilities. Also helping rates ease was the Treasury’s announcement that it is likely to buy equity in some insurance companies in order to improve their capital positions. Overall, there has been greater willingness for investors to buy commercial paper – resulting in some funds moving out of Treasuries. But that is a very good sign that the credit crunch is easing.
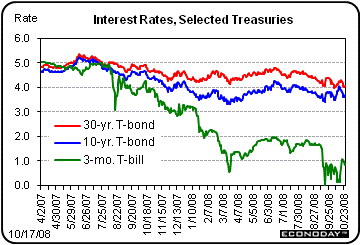 Still, safety concerns remain and are keeping Treasury rates low. The 3-month T-bill occasionally traded with a yield a little above 1 percent but overall remained below 1 percent. Still, safety concerns remain and are keeping Treasury rates low. The 3-month T-bill occasionally traded with a yield a little above 1 percent but overall remained below 1 percent.
The apparent world-wide economic contraction, easing inflation concerns, and continued safety concerns pushed the 30-year T-bond yield to its lowest in 30 years, with the yield at times trading below 4 percent.
 Oil prices continued to plummet last week and equity markets – other than the energy sector – barely noticed. Declines continued even on Friday after OPEC announced its first production cuts in two years in an attempt to bolster oil prices. Early Friday, OPEC announced a 1.5 million barrel per day cut in production. However, many analysts see demand having fallen more than the cut. Also, some analysts believe that several oil producers have not been meeting their quotas, meaning the true cut in production is more like a modest 1.1 million barrels. Oil prices continued to plummet last week and equity markets – other than the energy sector – barely noticed. Declines continued even on Friday after OPEC announced its first production cuts in two years in an attempt to bolster oil prices. Early Friday, OPEC announced a 1.5 million barrel per day cut in production. However, many analysts see demand having fallen more than the cut. Also, some analysts believe that several oil producers have not been meeting their quotas, meaning the true cut in production is more like a modest 1.1 million barrels.
In contrast to recent months, oil prices this past week moved in tandem with non-energy equities instead of in the opposite direction. Generally, lower oil prices have boosted the overall stock market but last week, recession fears pushed both oil and stocks down in the same direction. Oil declined Tuesday, Wednesday, and Friday – the same days that equities declined. It was all about recession fears for the U.S. and abroad.
Prices did get weighed down Tuesday with some help from the expiration of the November futures contract.
A sharp rise in the dollar last week also helped to soften oil prices. The dollar has become a refuge for some traders as foreign economies are turning out to be in worse shape than the U.S. For the week, the dollar was up well over 6 percent against the euro and up almost 9 percent against the British pound. Because oil is traded in dollars, a stronger currency value for the dollar tends to lower oil prices.
Economic indicators had little to do with the decline in oil prices since there was so little news on indicators. Oil continued to fall even with the positive news on a rebound in existing home sales. Again, recession fears dominated the market.
Net for the week, spot prices for West Texas Intermediate dropped $9.15 per barrel to settle at $62.70 – and coming in $82.59 (56.8 percent) below the record settle of $145.29 per barrel set on July 3. Spot crude is at its lowest settle since $62.55 seen for May 16, 2007.
There was little economic indicator news last week. You would never know it from the stock market but there actually was good news Friday morning on the housing front. Nonetheless, the leading indicators report was pointing toward recession even though it was mixed for the latest month.
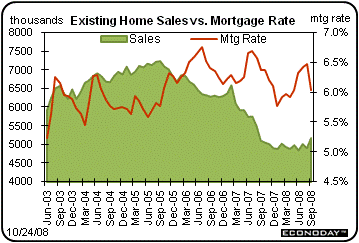 Nearly all economists agree that what is needed to get the economy turned around is recovery in housing. The latest existing home sales report indicates that housing may have hit bottom and possibly even started a turnaround. Sales of existing homes jumped 5.5 percent in September to an annual rate of 5.18 million -- the best rate since August last year. The month-on-month percentage jump is the best in more than five years while the year-on-year rate of plus 1.4 percent is the first positive rate in three years. Of course these gains are being made against easy comparisons, in fact against record lows. Gains were concentrated in the West which has been hardest hit during the downturn. Nearly all economists agree that what is needed to get the economy turned around is recovery in housing. The latest existing home sales report indicates that housing may have hit bottom and possibly even started a turnaround. Sales of existing homes jumped 5.5 percent in September to an annual rate of 5.18 million -- the best rate since August last year. The month-on-month percentage jump is the best in more than five years while the year-on-year rate of plus 1.4 percent is the first positive rate in three years. Of course these gains are being made against easy comparisons, in fact against record lows. Gains were concentrated in the West which has been hardest hit during the downturn.
 The bad news in the report is a steep drop in prices. It has taken heavy discounting to boost sales. The median price for the single-family component plunged 5.6 percent in the month of September, after a 3.4 percent decrease the month before. However, the price numbers are not seasonally adjusted and the best comparison is year-on-year. On this basis, existing single-family median prices were down 8.6 percent, compared to down 9.7 percent in August. Continued price declines are certain to raise foreclosures and will weigh on supply. Nonetheless, supply on the market was down in September, coming in at 9.9 months supply versus 10.6 months in August.
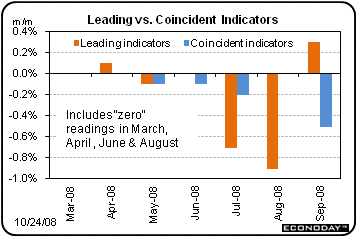 We got a surprise pop in the index of leading indicators in September. The index rose 0.3 percent in September, but followed a very steep decline of 0.9 percent in August and a 0.7 percent drop in July. The largest factor by far adding to September's gain was the Fed’s pumping up liquidity as the money supply component added 0.45 percentage points to the leading index’s monthly change — meaning the overall index would have fallen 0.2 percent without the surge in money supply. We got a surprise pop in the index of leading indicators in September. The index rose 0.3 percent in September, but followed a very steep decline of 0.9 percent in August and a 0.7 percent drop in July. The largest factor by far adding to September's gain was the Fed’s pumping up liquidity as the money supply component added 0.45 percentage points to the leading index’s monthly change — meaning the overall index would have fallen 0.2 percent without the surge in money supply.
Also, adding to the monthly increase were the rate spread (10-year T-bonds less fed funds rate) and supplier deliveries. Negative components were building permits, stock prices, initial claims for unemployment insurance (inverted) and the average workweek in manufacturing. Looking ahead, the money supply component is not likely to contribute such a large positive and there is a good chance the leading index will resume its fall in October, especially given the further weakening in stocks.
The coincident index increasingly is pointing to an official recession. The coincident index fell 0.5 percent in September and together with a flat reading in August and a 0.2 percent decline in July point strongly to recession for the third quarter. Given how many flat readings we have seen interspersed with negative numbers in recent months, it is possible that any downward annual revisions to employment, industrial production, and income could push back the start of official recession into at least the second quarter. But we will not have those revisions until next year – hopefully when the likely recession is actually over.
There actually were glimmers of hope last week despite the large equities losses. Credit markets improved and housing sales picked up. The two key areas that have been of primary concern are pointing to progress – but the limited good news may be a little late as recession has set in overseas and most likely in the U.S. The next key focus for the markets will be on this coming week of heavily laden economic news – including a regularly scheduled Fed rate decision.
The weakness in equities in the U.S. and overseas has led to higher odds that the Fed will be cutting rates again on Wednesday of this week. According to the fed funds futures market at close this past Friday, there is a 74 percent probability for a 50 basis point cut and a 26 percent probability for a 75 basis point cut. Of course, it is always good to remember that this futures market has at times been completely wrong. Many traders also expect the ECB and other central banks to be cutting rates in coming months.
This coming week we get some high profile market moving indicators. Durables orders give us an update on manufacturing and whether that sector’s decline is likely to continue. The FOMC announcement is out at mid-week and we could get another interest rate cut. We get our first look at third quarter GDP and many economists expect a recessionary number. Finally, the personal income report will give us a broad report on the status of the consumer sector – and it is likely to be dismal.
New home sales plunged 11.5 percent in August to a 460,000 annual unit rate, a rate comparable to downturns in the early 1990s and early 1980. Sales were especially weak in the West and Northeast. The year-on-year decline stands at 34.5 percent. Supply at the current sales rate rose from 10.3 months in July to 10.9 months -- one of the very highest readings in nearly 50 years of data. Prices fell a very steep 5.5 percent on the month to a median $221,900. The year-on-year decline of 6.2 percent has been steeper during the ongoing downturn but is still one of the very steepest on record.
New home sales Consensus Forecast for September 08: 450 thousand-unit annual rate
Range: 400 thousand to 550 thousand-unit annual rate
The Conference Board's consumer confidence index continued to edge up from record lows as this index rose 1.3 points in September to 59.8. The boost was led by a sizable 6.4 point gain in the expectations component to 60.5. The current assessment was much weaker falling to 58.8 from 65.0, in line with downturns across most economic indicators and the seizing up of the credit markets.
Consumer confidence Consensus Forecast for October 08: 52.0
Range: 45.0 to 59.4
Durable goods orders in August dropped sharply, pointing to contraction in manufacturing. Durable goods orders fell a revised 4.9 percent in August, following a 0.7 percent boost in July. Excluding the transportation component, new orders declined a revised 3.3 percent after no change in July. Weakness was led by aircraft and motor vehicles. Recent regional manufacturing surveys have been pointing to negative numbers for new orders.
New orders for durable goods Consensus Forecast for September 08: -1.1 percent
Range: -3.0 percent to +1.9 percent
New orders for durable goods, ex-trans., Consensus Forecast for September 08: -1.5 percent
Range: -3.9 percent to +1.0 percent
The FOMC announcement for the October FOMC policy meeting is expected to cut the fed funds rate another 50 basis points even though the Fed just lowered the target rate to 1.5 percent at an emergency meeting on October 8. Not only will markets get to parse the statement wording as usual but we get a revised Fed forecast for economic growth and inflation. A sharply lower forecast alone could rattle the markets even if the Fed does cut the target rate.
FOMC Consensus Forecast for 10/29/08 policy vote on fed funds target: down 50 basis points to 1.0 percent
Range: 74 percent probability for a 50 basis point cut and a 26 percent probability for a 75 basis point cut, based on settle for October 24
GDP for the second quarter came in with a final estimate of 2.8 percent. On the inflation front, the GDP price index was an annualized 1.1 percent – an extremely low number due largely to a quirk in how surging imports (related to oil prices in the second quarter) are a negative for nominal GDP, the numerator for the GDP price index. Headline PCE inflation stood at an annualized 4.3 percent while core PCE inflation came in at 2.2 percent. But for the initial estimates for the third quarter, both real growth and PCE inflation are likely to be down from the second quarter and possibly even negative. Monthly real sector data have been negative while we have had very favorable CPI numbers due to lower energy prices.
Real GDP Consensus Forecast for advance Q3 08: -0.5 percent annual rate
Range: -2.0 to +2.7 percent annual rate
GDP price index Consensus Forecast for advance Q3 08: +3.8 percent annual rate
Range: +3.0 to +4.9 percent annual rate
Initial jobless claims rose 15,000 in the week ending October 18 week from 463,000 in the prior week. A minor positive, continuing claims fell back 6,000 for the October 11 week. Hurricanes were still inflating the numbers, adding 12,000 to the unadjusted initial claims total of 415,000. But overall, the trend is a slowly worsening labor market. Unfortunately, the weakness may be accelerating based on recent mass lay-off reports.
Jobless Claims Consensus Forecast for 10/25/08: 475,000
Range: 460,000 to 500,000
Personal income for August personal income report was good on the income side but worrisome on the spending side. Personal income in August rebounded 0.5 percent, following a 0.6 percent drop in July. Within personal income, the wages and salaries component posted a 0.4 percent increase in August, after advancing 0.3 percent the previous month. Consumers have been tight with their money as personal consumption expenditures in August were flat, following a mere 0.1 percent uptick in July. On the inflation front, the headline PCE price finally eased on lower energy costs. The overall index slowed to no change, following hefty gains in July and June of 0.6 percent and 0.8 percent, respectively. The core PCE price index slowed to 0.2 percent from 0.3 percent in July. Looking ahead, continued declines in employment point to anemic income numbers for September. Retail sales for September were abysmally negative and PCEs outside of services will likely follow that act. But we should get good PCE price index numbers as headline CPI inflation was flat in September and the CPI core edged up only 0.1 percent.
Personal income Consensus Forecast for September 08: +0.1 percent
Range: -0.5 to +0.4 percent
Personal consumption expenditures Consensus Forecast for September 08: -0.3 percent
Range: -0.8 to +0.3 percent
Core PCE price index Consensus Forecast for September 08, m/m: +0.1 percent
Range: 0.0 to +0.2 percent
Core PCE price index Consensus Forecast for September 08, y/y: +2.5 percent
Range: +2.4 to +2.5 percent
The employment cost index for civilian workers has been relatively well behaved recently despite earlier higher inflation for key consumer staples of gasoline and food prices. The employment cost index for the second quarter rose 0.7 percent (not annualized) from the first quarter for a year-on-year rise of 3.1 percent, the latter down 2 tenths from the prior two quarters. Deceleration was centered in benefits where the 2.9 percent year-on-year pace is down from 3.5 percent in the first quarter. The quarter-to-quarter gain for this component held at 0.6 percent for a second straight quarter, down from 0.8 percent gains in the prior two quarters. This reflects, among other cutbacks, employers asking employees to pay higher medical deductibles. The wages & salaries component showed a 0.7 percent quarter-to-quarter gain, down from a string of 0.8 percent readings. The year-on-year rate is unchanged at 3.2 percent.
Employment cost index Consensus Forecast for Q3 08: +0.7 percent simple quarterly rate
Range: +0.3 to +0.8 percent simple quarterly rate
The NAPM-Chicago purchasing managers' index has been an outlier compared to other regional surveys, posting a second month of healthy growth in September. The Chicago purchasers' index dipped 1.2 points in September to a still very solid 56.7. This reflected a big jump in production and significant improvement in employment. New and backlogs orders indexes, however, slowed to just over break even.
NAPM-Chicago Consensus Forecast for October 08: 48.0
Range: 42.0 to 48.0
The Reuter's/University of Michigan's Consumer sentiment index shows consumers being rattled by the sharp losses in the stock market and increased job losses as the consumer sentiment index plunged a record 12.8 points from September to a mid-month October reading of 57.5. The current conditions component, at 58.9, is at an all-time low.
Consumer sentiment Consensus Forecast for final October 08: 57.5
Range: 54.0 to 63.0
Econoday Senior Writer Mark Pender contributed to this article.
|

![[Econoday]](images/econoday_logo_slim.gif)
![[Econoday]](images/logo.gif)


 Despite a relatively quiet week for economic indicators, most equity indexes this past week dropped below the lows from two weeks ago. However, stocks were up at the start of the week on modestly favorable comments from Fed Chair Bernanke on the possibility of a second fiscal stimulus package. Bernanke did emphasize his preference that stimulus focus on getting credit to consumers and businesses.

 Treasury yields were down notably for the week except on the near end. For this past week Treasury rates were mostly down as follows: the 2-year note, down 11 basis points; the 5-year note, down 23 basis points; the 10-year bond, down 22 basis points; and the 30-year bond, down 24 basis points. The 3-month T-bill firmed by 6 basis points,
 Still, safety concerns remain and are keeping Treasury rates low. The 3-month T-bill occasionally traded with a yield a little above 1 percent but overall remained below 1 percent.
 Oil prices continued to plummet last week and equity markets – other than the energy sector – barely noticed. Declines continued even on Friday after OPEC announced its first production cuts in two years in an attempt to bolster oil prices. Early Friday, OPEC announced a 1.5 million barrel per day cut in production. However, many analysts see demand having fallen more than the cut. Also, some analysts believe that several oil producers have not been meeting their quotas, meaning the true cut in production is more like a modest 1.1 million barrels.
 Nearly all economists agree that what is needed to get the economy turned around is recovery in housing. The latest existing home sales report indicates that housing may have hit bottom and possibly even started a turnaround. Sales of existing homes jumped 5.5 percent in September to an annual rate of 5.18 million -- the best rate since August last year. The month-on-month percentage jump is the best in more than five years while the year-on-year rate of plus 1.4 percent is the first positive rate in three years. Of course these gains are being made against easy comparisons, in fact against record lows. Gains were concentrated in the West which has been hardest hit during the downturn.
 The bad news in the report is a steep drop in prices. It has taken heavy discounting to boost sales. The median price for the single-family component plunged 5.6 percent in the month of September, after a 3.4 percent decrease the month before. However, the price numbers are not seasonally adjusted and the best comparison is year-on-year. On this basis, existing single-family median prices were down 8.6 percent, compared to down 9.7 percent in August. Continued price declines are certain to raise foreclosures and will weigh on supply. Nonetheless, supply on the market was down in September, coming in at 9.9 months supply versus 10.6 months in August.
 We got a surprise pop in the index of leading indicators in September. The index rose 0.3 percent in September, but followed a very steep decline of 0.9 percent in August and a 0.7 percent drop in July. The largest factor by far adding to September's gain was the Fed’s pumping up liquidity as the money supply component added 0.45 percentage points to the leading index’s monthly change — meaning the overall index would have fallen 0.2 percent without the surge in money supply.