|
Economists and Fed policy-makers keep talking about the slowdown coming in the second half. But equities recently have put on their rose-colored glasses and seem to only be paying attention to the good news. Yes, there has been some good news recently, but there is much on the downside to temper it. And the markets finally started to get it on Friday – but probably not as much as they should.
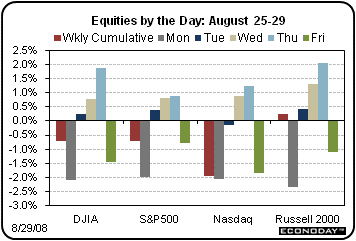 Equities bounced around during this past week and the Dow was moderately positive through Thursday as markets largely focused on the positives. But a dowsing of cold water from negative news on Friday left most indexes down for the week. The week started off on the wrong foot when fears about Fannie Mae and Freddie Mac, rumors that Korean investors were no longer interested in buying Lehman Brothers, higher oil prices, and a downgrade on AIG all pushed equities down at the start of the week. But events were more favorable the next three days and notably so on Wednesday when an unexpectedly strong durables orders report boosted stocks and upgraded the economic outlook for many traders. Also helping were dovish comments from Atlanta Fed President Dennis Lockhart who said inflation may ease with a slowing in the economy. A sharp upward revision to second quarter GDP boosted stocks on Thursday with an easing in oil prices also helping after the Energy Department announced it would draw oil from the Strategic Petroleum Reserve if needed due to Hurricane Gustav. The mid-week economic news was seen as very favorable – even though some of the details suggested otherwise. Equities bounced around during this past week and the Dow was moderately positive through Thursday as markets largely focused on the positives. But a dowsing of cold water from negative news on Friday left most indexes down for the week. The week started off on the wrong foot when fears about Fannie Mae and Freddie Mac, rumors that Korean investors were no longer interested in buying Lehman Brothers, higher oil prices, and a downgrade on AIG all pushed equities down at the start of the week. But events were more favorable the next three days and notably so on Wednesday when an unexpectedly strong durables orders report boosted stocks and upgraded the economic outlook for many traders. Also helping were dovish comments from Atlanta Fed President Dennis Lockhart who said inflation may ease with a slowing in the economy. A sharp upward revision to second quarter GDP boosted stocks on Thursday with an easing in oil prices also helping after the Energy Department announced it would draw oil from the Strategic Petroleum Reserve if needed due to Hurricane Gustav. The mid-week economic news was seen as very favorable – even though some of the details suggested otherwise.
But a negative personal income report brought back the economic reality that a slowdown is in the works, and stocks dropped notably heading into the three-day weekend. Declines in personal income and real spending reminded traders that the all important consumer sector is weakening.
Equities ended this past week mostly down. The Dow was down 0.7 percent; the S&P 500, down 0.7 percent; and the Nasdaq, down 2.0 percent. The Russell 2000 netted a modest 0.3 percent for the week.
 Equities were up moderately in August. The Dow was up 1.5 percent; the S&P 500, up 1.2 percent; the Nasdaq, up 1.8 percent; and the Russell 2000, up 3.5 percent. Equities were up moderately in August. The Dow was up 1.5 percent; the S&P 500, up 1.2 percent; the Nasdaq, up 1.8 percent; and the Russell 2000, up 3.5 percent.
For the year-to-date, major indexes are down as follows: the Dow, down 13.0 percent; the S&P 500, down 12.6 percent; the Nasdaq, down 10.7 percent; and the Russell 2000, down 3.5 percent.
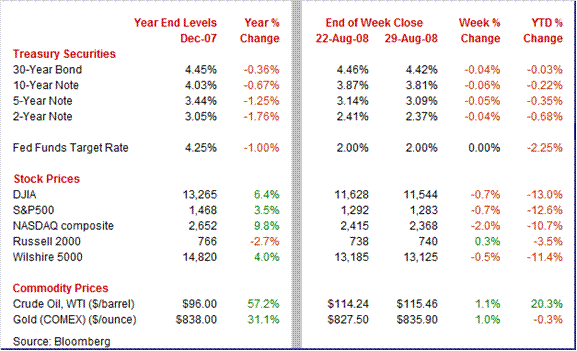
Weekly percent change column reflects percent changes for all components except interest rates. Interest rate changes are reflected in simple differences.
 Treasury bond yields were generally down and only slightly during this past pre-holiday week. Flight to safety was somewhat a factor as Korean investors appear to be backing away from purchasing Lehman Brothers. Also, JP Morgan indicated that it believes that the values of preferred shares of Fannie Mae and Freddie Mac have declined sharply. Surprisingly, rates edged down despite disappointing results in the government’s record $32 billion 2-year auction. A much stronger-than-expected upward revision to second quarter GDP (to 3.3 percent from 1.9 percent) caused yields to firm on Thursday. But Friday’s weak personal income report sent yields back down – especially due to the soft spending numbers. Short-covering before the long weekend also pushed yields down. Treasury bond yields were generally down and only slightly during this past pre-holiday week. Flight to safety was somewhat a factor as Korean investors appear to be backing away from purchasing Lehman Brothers. Also, JP Morgan indicated that it believes that the values of preferred shares of Fannie Mae and Freddie Mac have declined sharply. Surprisingly, rates edged down despite disappointing results in the government’s record $32 billion 2-year auction. A much stronger-than-expected upward revision to second quarter GDP (to 3.3 percent from 1.9 percent) caused yields to firm on Thursday. But Friday’s weak personal income report sent yields back down – especially due to the soft spending numbers. Short-covering before the long weekend also pushed yields down.
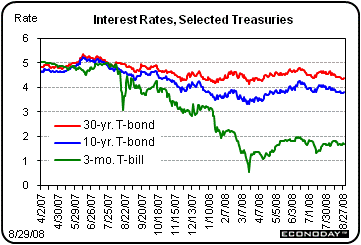 For this past week Treasury rates were mostly down slightly: the 2-year note, down 4 basis points; the 5-year note, down 5 basis points; the 10-year bond, down 6 basis points; and the 30-year bond, down 4 basis points. The 3-month T-bill was up 2 basis points. For this past week Treasury rates were mostly down slightly: the 2-year note, down 4 basis points; the 5-year note, down 5 basis points; the 10-year bond, down 6 basis points; and the 30-year bond, down 4 basis points. The 3-month T-bill was up 2 basis points.
The bond markets appear to be less sanguine about the economy than equities as longer yields have been steadily easing in recent weeks.
 The oil market last week mostly focused on the potential impact of Hurricane Gustav on oil rigs and production facilities in and around the Gulf of Mexico. Concern was particularly notable on Tuesday and Wednesday with the spot price of West Texas Intermediate rising $1.56 and $1.23 per barrel on those days, respectively. But the Department of Energy damped those gains on Thursday by announcing that if needed due to hurricane damage, the Strategic Petroleum Reserve would be tapped. The oil market last week mostly focused on the potential impact of Hurricane Gustav on oil rigs and production facilities in and around the Gulf of Mexico. Concern was particularly notable on Tuesday and Wednesday with the spot price of West Texas Intermediate rising $1.56 and $1.23 per barrel on those days, respectively. But the Department of Energy damped those gains on Thursday by announcing that if needed due to hurricane damage, the Strategic Petroleum Reserve would be tapped.
Net for the week, spot prices for West Texas Intermediate rose $1.22 per barrel to settle at $115.46 per barrel. This is down 20.5 percent and $29.83 per barrel from the record settle of $145.29 per barrel set on July 3.
The economic news was mixed this past week. But equities mostly focused on the positives — a sharp upward revision to second quarter GDP, small gains in home sales, a boost in durables orders, and some improvement in consumer confidence. But there were signs of weakness in some of the detail of those reports and also in the personal income report overall.
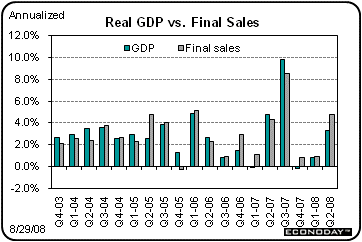 Second quarter GDP has turned out to be much stronger than anyone anticipated just a few months ago. But sources of strength are likely to fade in the second half. Revisions to second quarter GDP blew away any claims of recession for spring. The Commerce Department's first revision to second quarter GDP boosted the quarter's growth rate sharply to 3.3 percent from the initial 1.9 percent. The upward revision was primarily due to upward revisions to exports and durables consumption. Second quarter GDP has turned out to be much stronger than anyone anticipated just a few months ago. But sources of strength are likely to fade in the second half. Revisions to second quarter GDP blew away any claims of recession for spring. The Commerce Department's first revision to second quarter GDP boosted the quarter's growth rate sharply to 3.3 percent from the initial 1.9 percent. The upward revision was primarily due to upward revisions to exports and durables consumption.
Once again, we need to ignore a key inflation measure because of quirks in the methodology. The GDP price index was revised to an annualized 1.2 percent -- up from the initial estimate of 1.1 percent. The sharp easing in the overall price index was technical in nature, caused by a spike in nominal imports cutting into nominal GDP growth. In contrast, the inflation for final sales of domestic purchases was revised up to a strong 4.3 percent, compared to the initial estimate of 4.2 percent. Headline PCE inflation was unrevised at 4.2 percent and up from 3.6 percent in the first quarter. Core PCE inflation also was unchanged - -coming at 2.1 percent from 2.3 percent in the first quarter.
 The latest revision to GDP growth was extremely large with the Bureau of Economic Analysis having underestimated export and inventory growth for June when the initial estimate for second quarter GDP was released. Reviewing historical numbers back through 2002 from Econoday’s database of initial releases, the second quarter revision was the largest over this six-and-a-half year time frame. For the latest quarter, the upward revision was 1.4 percentage points with the next largest revision a 1.3 percentage point downward revision for the fourth quarter of 2006. The latest revision to GDP growth was extremely large with the Bureau of Economic Analysis having underestimated export and inventory growth for June when the initial estimate for second quarter GDP was released. Reviewing historical numbers back through 2002 from Econoday’s database of initial releases, the second quarter revision was the largest over this six-and-a-half year time frame. For the latest quarter, the upward revision was 1.4 percentage points with the next largest revision a 1.3 percentage point downward revision for the fourth quarter of 2006.
Clearly, the economy has been growing much better than expected despite the credit crunch. But growth is likely to come down quite a bit from the second quarter pace. Growth has heavily depended upon rapid export growth but with several key trading partners teetering on recession, export growth in coming quarters is likely to slow sharply. Additionally, inventory investment also is likely to ease. Finally, the latest personal income report is pointing toward perhaps a decline in real personal spending for the third quarter.
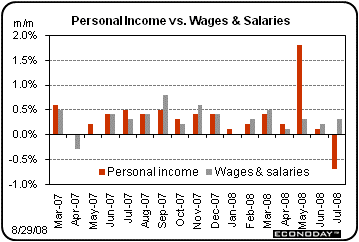 The consumer sector is losing momentum as personal income and real spending dropped in the latest month. Pulled down by a drop in income tax rebate checks, personal income in July fell 0.7 percent, following a 0.1 percent rise in June. The important wages and salaries component was not as weak though, posting a moderate 0.3 percent gain, following a 0.2 percent rise in June. The consumer sector is losing momentum as personal income and real spending dropped in the latest month. Pulled down by a drop in income tax rebate checks, personal income in July fell 0.7 percent, following a 0.1 percent rise in June. The important wages and salaries component was not as weak though, posting a moderate 0.3 percent gain, following a 0.2 percent rise in June.
Consumer spending has slowed with July numbers heavily damped by a sharp dip in motor vehicle purchases. Personal consumption expenditures in July slowed to a 0.2 percent rise, after jumping 0.6 percent in June. Strength was in a 0.5 percent boost in services, followed by a 0.3 percent rise in nondurables. Durables fell 1.5 percent.
 But inflation is running high and cutting into real income and real spending. The headline PCE price index remained quite hot in July with a 0.6 percent jump — only slightly down from June’s red hot 0.7 percent surge. The core PCE price index held steady but at a pace unacceptable to the Fed, rising 0.3 percent in both July and June. On a year-ago basis, inflation is far above the Fed’s comfort zone of 1-1/2 to 2 percent annualized growth. Headline PCE inflation jumped to up 4.5 percent from up 4.0 percent in June. Core PCE inflation rose to 2.4 percent from 2.3 percent in June. But inflation is running high and cutting into real income and real spending. The headline PCE price index remained quite hot in July with a 0.6 percent jump — only slightly down from June’s red hot 0.7 percent surge. The core PCE price index held steady but at a pace unacceptable to the Fed, rising 0.3 percent in both July and June. On a year-ago basis, inflation is far above the Fed’s comfort zone of 1-1/2 to 2 percent annualized growth. Headline PCE inflation jumped to up 4.5 percent from up 4.0 percent in June. Core PCE inflation rose to 2.4 percent from 2.3 percent in June.
Indeed, inflation is cutting into real income and spending, putting the consumer sector on increasingly shaky ground. Real disposable income fell 1.7 percent in July, after a 2.6 percent fall the month before. Real disposable income slowed to 1.2 percent in July on a year-ago basis.
Real spending actually fell 0.4 percent in July, after dipping 0.1 percent in June. This is a poor start for real PCEs for the third quarter and takes a lot of luster off the upward revision to second quarter GDP.
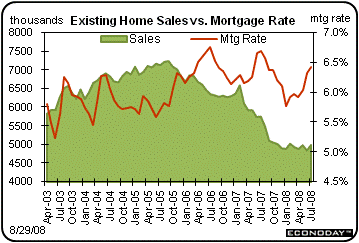 Housing is still near rock bottom despite a little bump up in sales of existing homes. Existing home sales rose 3.1 percent in July to a 5.0 million annual. But potential home sellers decided that market conditions may have improved slightly and added to homes on the market as the inventory of existing homes for sale jumped 3.9 percent for the latest month. This pushed supply up to 11.2 months – slightly higher than 11.1 months in June. Bloated supply continues to pressure prices which fell 1.3 percent in the month to a median $212,000 for a 7.1 percent year-on-year decline. When sales eventually pick up to a healthy pace, we are likely to see previously reluctant home sellers add to inventories and keep supply high. This will continue to keep new home construction soft. Housing is still near rock bottom despite a little bump up in sales of existing homes. Existing home sales rose 3.1 percent in July to a 5.0 million annual. But potential home sellers decided that market conditions may have improved slightly and added to homes on the market as the inventory of existing homes for sale jumped 3.9 percent for the latest month. This pushed supply up to 11.2 months – slightly higher than 11.1 months in June. Bloated supply continues to pressure prices which fell 1.3 percent in the month to a median $212,000 for a 7.1 percent year-on-year decline. When sales eventually pick up to a healthy pace, we are likely to see previously reluctant home sellers add to inventories and keep supply high. This will continue to keep new home construction soft.
 Continued weakness in both existing and new home sales has led homebuilders to cut even further back on construction. But new homes sales did edge up in July – by 2.4 percent to a 515,000 annual unit rate in July. But the sales pace is anemic – having fallen 35.3 percent on a year-ago basis. Continued weakness in both existing and new home sales has led homebuilders to cut even further back on construction. But new homes sales did edge up in July – by 2.4 percent to a 515,000 annual unit rate in July. But the sales pace is anemic – having fallen 35.3 percent on a year-ago basis.
Homebuilders see the writing on the wall with the weak sales pace and continued inventory overhang of new and existing homes on the market. Homebuilders added only 23,000 new homes to the market for sale – down 5.2 percent for July. This helped to ease supply marginally to 10.1 months from 10.7 in June and 10.8 in May. The median sales price rose 0.3 percent in the month but is down 6.3 percent on the year. The bottom line is that potential new supply of existing homes is still weighing on new home building.
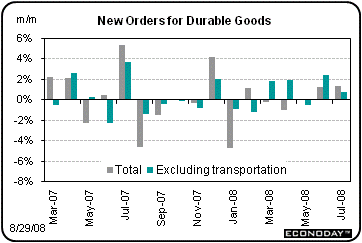 Durable goods orders in July were surprisingly strong -- even after discounting a surge in aircraft orders. And businesses are looking past current weakness in the economy, continuing to invest in the economy. Durable goods orders advanced 1.3 percent in July, matching the 1.3 percent surge in June. Excluding the transportation component, new orders increased 0.7 percent, following a 2.4 percent jump in June. Strength was moderately widespread. Durable goods orders in July were surprisingly strong -- even after discounting a surge in aircraft orders. And businesses are looking past current weakness in the economy, continuing to invest in the economy. Durable goods orders advanced 1.3 percent in July, matching the 1.3 percent surge in June. Excluding the transportation component, new orders increased 0.7 percent, following a 2.4 percent jump in June. Strength was moderately widespread.
For now, the durable goods report has some good news for third quarter GDP. Shipments of nondefense capital goods rose 1.6 percent in July after gaining 0.5 percent the previous month. These shipments are key source data for the business equipment component of GDP. In contrast to negative consumer spending growth, third quarter GDP is getting some help from the business equipment component.
Looking farther down the road, momentum from new orders may not last as soft consumer spending is likely to be joined by slower growth in exports.
 There just happens to be a chance that consumer confidence and sentiment have hit bottom and could be starting to recovery – although improvement is likely to be painfully slow. There just happens to be a chance that consumer confidence and sentiment have hit bottom and could be starting to recovery – although improvement is likely to be painfully slow.
First, consumer confidence rebounded further in August, reflecting declining gas prices but not improvement in current labor conditions. The Conference Board's index climbed back to levels seen during the spring, to 56.9 in August from 51.9 in July and compared to the recent low of 51.9 in June. June’s figure was not much above the record low of 43.2 seen in December 1974.
Improvement was centered in the expectations component which jumped more than 10 points for its biggest one-month gain in nearly three years. One-year inflation expectations really came back, down 8 tenths to 6.7 percent in evidence of the effect of lower gas prices.
Consumer sentiment likewise improved from recent rock-bottom levels. The Reuters/University of Michigan consumer sentiment index rose more than 1 point from mid-month and nearly 2 points from July to 63.0. The expectations component jumped to 57.9 from 56.8 at mid-month and is well up from 53.5 in July. The recent retreat in gasoline prices appears to be rallying consumers and also seem to be bringing down inflation expectations. One-year inflation expectations in August slipped 3 tenths to 4.8 percent. While confidence and inflation expectations have improved, this improvement probably is not a trend yet. There is still considerable weakness in labor markets and still high energy costs are feeding into core inflation.
There was considerable good news with a sharp upward revision to second quarter GDP, a jump in durables orders, and an uptick in consumer sentiment. But the details in the GDP report indicate that strength will be short-lived. And the personal income report confirms that view. It still looks like the overall economy will dodge recession but weaker growth is ahead. The markets finally understood some of the weakness with Friday’s personal income report. But there is probably more softness ahead than many expect.
It’s a holiday shortened week but there will be plenty of key economic data. The highlight will be the August employment report released on Friday with the mid-week release of the Fed’s Beige Book also likely to move markets. The week starts out with Tuesday’s ISM report on manufacturing.
Labor Day. All markets closed in U.S.
The Institute for Supply Management's manufacturing index held steady in July at the breakeven level of 50.0 compared to 50.2 in June. But looking ahead, new orders fell nearly 5 points to 45.0 for the lowest reading since the 2001 recession. Backlog orders also declined, down 4-1/2 points to 43.0 for its lowest reading since early 2003. Prices paid remain severely elevated at a little changed 88.5 in the month. A dip in oil prices likely will help ease the prices paid index but the trend in new orders bodes poorly for the overall index.
ISM manufacturing index Consensus Forecast for August 08: 49.9
Range: 49.0 to 51.9
Construction spending in June resumed a downtrend on a further drop in housing construction. Construction outlays fell 0.4 percent in June, following no change in May. The June decrease was led by a 1.8 percent decrease in private residential outlays with public outlays also dipping 0.2 percent. However, private nonresidential spending continued to be a source of strength with a 0.8 percent boost for June. Looking ahead, the latest dip in housing starts suggests that construction spending will remain soft in July.
Construction spending Consensus Forecast for July 08: -0.3 percent
Range: -0.7 to +0.2 percent
Factory orders got some real as well as an artificial lift in June. Factory orders surged 1.7 percent in June. Orders for non-durable goods, reflecting price gains for petroleum and coal, jumped 2.5 percent in June. Meanwhile, durable goods orders rose a revised 1.3 in June percent — with strength seen in primary metals, fabricated products, machinery and electrical goods. Transportation goods fell due to a drop in orders for civilian aircraft. Looking ahead, factory orders should remain strong in July as the durables component came out with a 1.3 percent advance.
Factory orders Consensus Forecast for July 08: +0.8 percent
Range: -0.1 to +1.6 percent
The Beige Book being prepared for the September 16 FOMC meeting is released this afternoon. The last Beige Book released in late July reported that the pace of economic activity had “slowed somewhat.” But when the FOMC met in early August, the outcome was a balance between upside risk for inflation and downside risk for weak growth. The key focus was ensuring that credit markets stabilized after another round of turbulence in the financial sector during July. Because the Fed is counting on slower economic growth, markets will be watching for anecdotal information that confirms this. Also, traders will be looking for reports of improvement in the financial markets, improvement that would signal when the Fed might start raising rates.
Sales of domestic motor vehicles fell sharply in July to a 9.1 million unit rate from 9.8 million the month before as high gasoline prices and a weakening labor market cut into sales – especially for trucks. The combined domestic-and-import unit sales rate fell to 12.5 million from June's 13.6 million. The rate is the lowest since November 1991.
Motor vehicle domestic sales Consensus Forecast for July 08: 9.40 million-unit rate
Range: 9.20 to 9.70 million-unit rate
Initial jobless claims fell back 10,000 in the week ending August 23 to 425,000, pulling the four-week average down by 6,000 to 440,250. Even though initial claims improved, the level is still quite high and continuing claims worsened. Continuing claims jumped 64,000 in the week ending August 16 to 3.423 million.
Jobless Claims Consensus Forecast for 8/30/08: 420,000
Range: 415,000 to 435,000
Nonfarm productivity in the second quarter productivity slowed to an annualized 2.2 percent increase, following a 2.6 percent gain in the first quarter. Unit labor costs continued to ease with a 1.3 percent annualized increase, following a 2.5 percent rise in the first quarter. We are likely to see significant improvement in the revisions to second quarter numbers for both productivity and unit labor costs as second quarter real GDP was revised up sharply from 1.9 percent to 3.3 percent. Productivity and labor costs use much of the same source data as GDP.
Nonfarm Productivity Consensus Forecast for revised Q2 08: +3.3 percent annual rate
Range: +2.7 to +4.2 percent annual rate
Unit Labor Costs Consensus Forecast for revised Q2 08: -0.3 percent annual rate
Range: -0.5 to +0.9 percent annual rate
The composite index from the ISM non-manufacturing survey showed less weakness in July. The headline composite index rose 1.3 points to 49.5, boosted by easing weakness in employment and an odd extension in delivery time. But orders point to slippage ahead. The new orders index fell nearly 1 point to 47.9, the lowest reading since January and the second lowest of the whole expansion. So far, rising oil prices have kept price pressures very elevated with the July prices paid index coming in at 80.8. With the trend in orders and recent decline in oil prices, we are likely to see lower numbers in August for both the composite index and for prices paid.
Composite index Consensus Forecast for August 08: 50.0
Range: 48.5 to 53.0
Nonfarm payroll employment has been in recession for some time – even though the overall economy has dodged contraction so far. The July jobs report posted the seventh consecutive decline in payroll jobs with a drop of 51,000 – the same as June’s decrease. The latest fall was led by declines in manufacturing and construction with losses of 35,000 and 22,000, respectively. Service-providing jobs traditionally are the last to fall going into recession or downturns and that actually happened in July with a dip of 5,000. Looking ahead the uptrend in initial jobless claims and decline in employment indexes in various regional surveys suggest another notable decline in payroll jobs in August. On the inflation front, average hourly earnings posted a 0.3 percent gain in July. The soft jobs market will likely keep wages from rising any faster in August. The civilian unemployment rate in July rose to 5.7 percent from 5.5 percent the month before. Look for another rise in August.
Nonfarm payrolls Consensus Forecast for August 08: -75,000
Range: -150,000 to -60,000
Unemployment rate Consensus Forecast for August 08: 5.8 percent
Range: 5.7 to 5.9 percent
Average workweek Consensus Forecast for August 08: 33.7 hours
Range: 33.6 to 33.7 hours
Average hourly earnings Consensus Forecast for August 08: +0.3 percent
Range: +0.2 to 0.4 percent
Econoday Senior Writer Mark Pender contributed to this article.
|

![[Econoday]](images/econoday_logo_slim.gif)
![[Econoday]](images/logo.gif)


 Equities bounced around during this past week and the Dow was moderately positive through Thursday as markets largely focused on the positives. But a dowsing of cold water from negative news on Friday left most indexes down for the week. The week started off on the wrong foot when fears about Fannie Mae and Freddie Mac, rumors that Korean investors were no longer interested in buying Lehman Brothers, higher oil prices, and a downgrade on AIG all pushed equities down at the start of the week. But events were more favorable the next three days and notably so on Wednesday when an unexpectedly strong durables orders report boosted stocks and upgraded the economic outlook for many traders. Also helping were dovish comments from Atlanta Fed President Dennis Lockhart who said inflation may ease with a slowing in the economy. A sharp upward revision to second quarter GDP boosted stocks on Thursday with an easing in oil prices also helping after the Energy Department announced it would draw oil from the Strategic Petroleum Reserve if needed due to Hurricane Gustav. The mid-week economic news was seen as very favorable – even though some of the details suggested otherwise.
 Equities were up moderately in August. The Dow was up 1.5 percent; the S&P 500, up 1.2 percent; the Nasdaq, up 1.8 percent; and the Russell 2000, up 3.5 percent.
 Treasury bond yields were generally down and only slightly during this past pre-holiday week. Flight to safety was somewhat a factor as Korean investors appear to be backing away from purchasing Lehman Brothers. Also, JP Morgan indicated that it believes that the values of preferred shares of Fannie Mae and Freddie Mac have declined sharply. Surprisingly, rates edged down despite disappointing results in the government’s record $32 billion 2-year auction. A much stronger-than-expected upward revision to second quarter GDP (to 3.3 percent from 1.9 percent) caused yields to firm on Thursday. But Friday’s weak personal income report sent yields back down – especially due to the soft spending numbers. Short-covering before the long weekend also pushed yields down.
 For this past week Treasury rates were mostly down slightly: the 2-year note, down 4 basis points; the 5-year note, down 5 basis points; the 10-year bond, down 6 basis points; and the 30-year bond, down 4 basis points. The 3-month T-bill was up 2 basis points.
 The oil market last week mostly focused on the potential impact of Hurricane Gustav on oil rigs and production facilities in and around the Gulf of Mexico. Concern was particularly notable on Tuesday and Wednesday with the spot price of West Texas Intermediate rising $1.56 and $1.23 per barrel on those days, respectively. But the Department of Energy damped those gains on Thursday by announcing that if needed due to hurricane damage, the Strategic Petroleum Reserve would be tapped.
 Second quarter GDP has turned out to be much stronger than anyone anticipated just a few months ago. But sources of strength are likely to fade in the second half. Revisions to second quarter GDP blew away any claims of recession for spring. The Commerce Department's first revision to second quarter GDP boosted the quarter's growth rate sharply to 3.3 percent from the initial 1.9 percent. The upward revision was primarily due to upward revisions to exports and durables consumption.
  The latest revision to GDP growth was extremely large with the Bureau of Economic Analysis having underestimated export and inventory growth for June when the initial estimate for second quarter GDP was released. Reviewing historical numbers back through 2002 from Econoday’s database of initial releases, the second quarter revision was the largest over this six-and-a-half year time frame. For the latest quarter, the upward revision was 1.4 percentage points with the next largest revision a 1.3 percentage point downward revision for the fourth quarter of 2006.
 The consumer sector is losing momentum as personal income and real spending dropped in the latest month. Pulled down by a drop in income tax rebate checks, personal income in July fell 0.7 percent, following a 0.1 percent rise in June. The important wages and salaries component was not as weak though, posting a moderate 0.3 percent gain, following a 0.2 percent rise in June.
  But inflation is running high and cutting into real income and real spending. The headline PCE price index remained quite hot in July with a 0.6 percent jump — only slightly down from June’s red hot 0.7 percent surge. The core PCE price index held steady but at a pace unacceptable to the Fed, rising 0.3 percent in both July and June. On a year-ago basis, inflation is far above the Fed’s comfort zone of 1-1/2 to 2 percent annualized growth. Headline PCE inflation jumped to up 4.5 percent from up 4.0 percent in June. Core PCE inflation rose to 2.4 percent from 2.3 percent in June.
 Housing is still near rock bottom despite a little bump up in sales of existing homes. Existing home sales rose 3.1 percent in July to a 5.0 million annual. But potential home sellers decided that market conditions may have improved slightly and added to homes on the market as the inventory of existing homes for sale jumped 3.9 percent for the latest month. This pushed supply up to 11.2 months – slightly higher than 11.1 months in June. Bloated supply continues to pressure prices which fell 1.3 percent in the month to a median $212,000 for a 7.1 percent year-on-year decline. When sales eventually pick up to a healthy pace, we are likely to see previously reluctant home sellers add to inventories and keep supply high. This will continue to keep new home construction soft.
 Continued weakness in both existing and new home sales has led homebuilders to cut even further back on construction. But new homes sales did edge up in July – by 2.4 percent to a 515,000 annual unit rate in July. But the sales pace is anemic – having fallen 35.3 percent on a year-ago basis.
 Durable goods orders in July were surprisingly strong -- even after discounting a surge in aircraft orders. And businesses are looking past current weakness in the economy, continuing to invest in the economy. Durable goods orders advanced 1.3 percent in July, matching the 1.3 percent surge in June. Excluding the transportation component, new orders increased 0.7 percent, following a 2.4 percent jump in June. Strength was moderately widespread.
  There just happens to be a chance that consumer confidence and sentiment have hit bottom and could be starting to recovery – although improvement is likely to be painfully slow.