|
There was no shortage of negative news this past week as financial firms reported massive losses and the Fed came out with a rather gloomy Beige Book. But at week's end, better-than-expected reports from the manufacturing, housing, and consumer sectors raised hopes that the economy is improving.
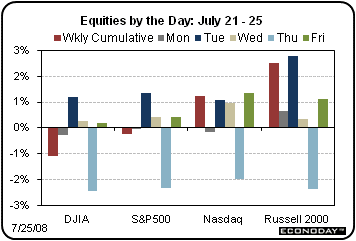
Equities were mixed this past week with blue chips down but with techs and small caps up moderately. With crude oil down for the week by over $6 per barrel, equities clearly underperformed. Fears about slowing economic growth played a key role in keeping stocks down during parts of the week.
First, equities should have done better. The spot price of West Texas Intermediate fell a sharp $6.42 per barrel over the week with the largest daily drop on Wednesday being down over $4 per barrel. Airlines and other transport equities, however, did benefit from the oil drop.
FedSpeak, economic news and company news had key impacts on stocks. The biggest gains for the week were on Tuesday when Philly Fed President Charles Plosser said the Fed should raise rates despite continued sluggishness in the economy. Equities liked FedSpeak that indicated the Fed would be reining in inflation. A $2 drop in oil also spurred equities for the day as did reports of cost cutting plans by Deutsche Bank and Wachovia. The markets liked hearing that financials are finding ways to reduce recent ongoing losses.
With the sharp drop in oil, Wednesday should have been a banner day for stocks. But the Fed’s gloomy picture of sluggish economic growth and rising inflation pressures in this past Wednesday’s Beige Book weighed on stocks, mostly offsetting the positive impact of the day’s sharp drop in oil prices.
Thursday was decidedly negative for equities with major indexes down 2 percent or more for the day. Reminding investors of a weak economy was a large spike in initial unemployment claims along with another drop in existing home sales. Also casting a pall on stocks was a record quarterly loss by Ford as domestic auto makers continue to report declining sales. A downgrade of AT&T further pulled stocks down.
But the week ended on a positive note as durable goods orders jumped, new home sales were not as bad as feared and consumer sentiment actually rebounded notably for July.
During the week, financial firms reported dramatic losses but many reports were not as bad as feared. Those beating expectations included Bank of America, Citigroup, JP Morgan Chase, Wells Fargo, and others. But a number of key financial firms reminded markets that problems are still looming as both American Express and Washington Mutual came in with larger than expected losses. AmEx warned of deterioration in consumer delinquencies.
The consumer sector is hurting except for discounters as even McDonald’s was downgraded this past week. On a final note, the lower dollar continues to help capital equipment exporters. Heavy equipment maker Caterpillar beat expectations for earnings due to exports to Asia and the Middle East.
This past week, major indexes were mixed as follows: the Dow, down 1.1 percent; the S&P 500, down 0.2 percent; the Nasdaq, up 1.2 percent; and the Russell 2000, up 2.5 percent.
For the year-to-date, major indexes are down as follows: the Dow, down 14.3 percent; the S&P 500, down 14.3 percent; the Nasdaq, down 12.9 percent; and the Russell 2000, down 7.3 percent.
Weekly percent change column reflects percent changes for all components except interest rates. Interest rate changes are reflected in simple differences.
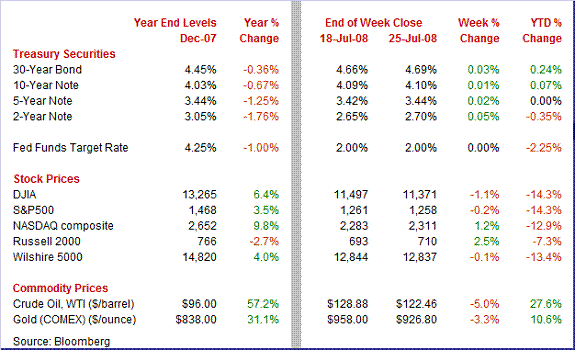
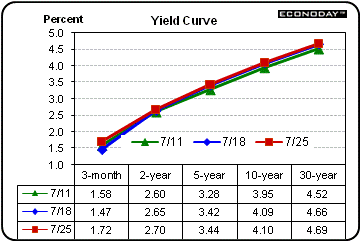 Treasury yields were up marginally for the week except for the near end where the increase was a little more pronounced. Rising concern over inflation and a possible pick up in economic growth offset a large drop in oil prices. This past Tuesday, Philadelphia Fed President Charles Plosser rang the inflation alarm again and even appeared to throw down the gauntlet to more reluctant FOMC members about the need to raise rates: “To keep inflation expectations anchored means that monetary policymakers will have to back up their words with action.” His comments bumped rates up on Tuesday along with reversal of flight to quality as equities posted sizeable gains for the day. Treasury yields were up marginally for the week except for the near end where the increase was a little more pronounced. Rising concern over inflation and a possible pick up in economic growth offset a large drop in oil prices. This past Tuesday, Philadelphia Fed President Charles Plosser rang the inflation alarm again and even appeared to throw down the gauntlet to more reluctant FOMC members about the need to raise rates: “To keep inflation expectations anchored means that monetary policymakers will have to back up their words with action.” His comments bumped rates up on Tuesday along with reversal of flight to quality as equities posted sizeable gains for the day.
 After flight to quality pushed rates down on Thursday with the selloff in equities, Friday’s economic news boosted rates back up. Durables orders were much stronger than expected for June and new home sales were not down as much as anticipated. Also at week's end, a rebound in consumer sentiment lifted expectations for economic growth in coming months and helped rates firm. After flight to quality pushed rates down on Thursday with the selloff in equities, Friday’s economic news boosted rates back up. Durables orders were much stronger than expected for June and new home sales were not down as much as anticipated. Also at week's end, a rebound in consumer sentiment lifted expectations for economic growth in coming months and helped rates firm.
The bottom line is that even before some positive economic news was reported late in the week, inflation expectations were rising in the bond pits. But this past week’s drop in oil prices did help.
For this past week Treasury rates were up as follows: 3-month T-bill, up 25 basis points, the 2-year note, up 5 basis points; the 5-year note, up 2 basis points; the 10-year bond, up 1 basis point; and the 30-year bond, up 3 basis points.
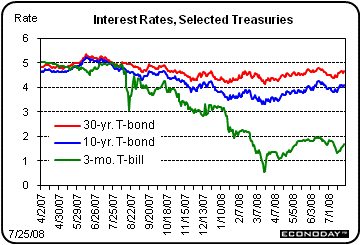
 Oil prices dropped sharply this past week with falling demand and a miss by a hurricane being key factors. Not all factors weighed on the downside. Early in the week, Iran nuclear talks ended without settling the issue of ending that country’s apparent nuclear weapons program. The possibility of Hurricane Dolly hitting southern Texas oil facilities also boosted prices. Oil prices dropped sharply this past week with falling demand and a miss by a hurricane being key factors. Not all factors weighed on the downside. Early in the week, Iran nuclear talks ended without settling the issue of ending that country’s apparent nuclear weapons program. The possibility of Hurricane Dolly hitting southern Texas oil facilities also boosted prices.
But Dolly turned away from Texas oil plants, resulting in a price slump. Worries about the economy also pushed prices down as huge losses by financial firms led many to believe that the economy will stay sluggish. Two reports on Wednesday led prices down by over $4 per barrel for the day. A jump in crude and refined inventories indicated that demand for oil products was falling significantly in response to high prices. Also, the Fed’s gloomy Beige Book led many traders to believe that demand destruction was continuing. At week end, oil prices fell by more than $2 per barrel on some reverse economic logic as better-than-expected durables orders, new home sales, and consumer sentiment led traders to see the economy as not so fragile. This led some traders to take funds out of oil and into other investments. Oil had become a safe haven for some investors.
Net for the week, spot prices for West Texas Intermediate dropped a sizeable $6.42 cents per barrel to settle at $122.46 – and coming in $22.83 below the record settle of $145.29 per barrel set on July 3. Friday’s settle was the lowest since $122.30 on June 4 of this year.
This past week gave us important updates on the manufacturing and housing sectors. Manufacturing may be in better shape than many expected while housing remains depressed. We got a nice surprise last week from upward bounce in consumer sentiment.
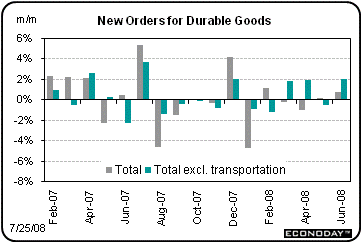 Manufacturing apparently is stronger than many believed as June durables jumped 0.8 percent for the month, surprising the markets which had expected a decline. June’s gain followed a 0.1 percent rise in May. When excluding the volatile transportation component, new orders rebounded a sharp 2.0 percent, following a 0.5 percent decline in May. Manufacturing apparently is stronger than many believed as June durables jumped 0.8 percent for the month, surprising the markets which had expected a decline. June’s gain followed a 0.1 percent rise in May. When excluding the volatile transportation component, new orders rebounded a sharp 2.0 percent, following a 0.5 percent decline in May.
For the latest month, strength was broad based. Gains were seen in primary metals, electrical equipment, machinery, fabricated metals, and “other.” Weakness was found in communication equipment, transportation, and computers & electronics.
Private investment in equipment is likely to be mixed in coming months. Orders for nondefense capital goods declined 3.2 percent, following a 0.2 percent rise in May. But the recent weakness was in aircraft. Excluding this component, nondefense capital goods orders rebounded 1.4 percent, after a 0.1 percent slip in May. On a year-ago basis, overall nondefense capital goods orders were up 0.6 percent and were up 3.8 percent after excluding aircraft.
Turning to the key source data for business equipment in GDP, shipments of nondefense capital goods rose 0.5 percent in June after a dip of 0.3 percent in May and boost of 1.8 percent in April. The business equipment component of GDP is likely to be moderately healthy given the second quarter numbers for nondefense capital goods shipments. These numbers add to the argument by some economists that second quarter real GDP will come in at least at 2 percent growth annualized.
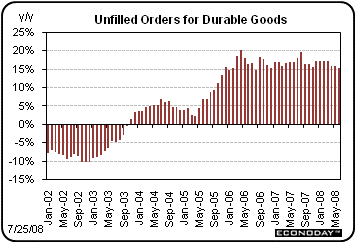 Momentum for manufacturing continues to build from backlogs. Unfilled orders for durable goods in June jumped 0.9 percent – the same as the prior month. June’s level is the highest level since the series was first stated on a NAICS basis in 1992. Unfilled orders stood at a 15.3 percent year-ago gain in June. Momentum for manufacturing continues to build from backlogs. Unfilled orders for durable goods in June jumped 0.9 percent – the same as the prior month. June’s level is the highest level since the series was first stated on a NAICS basis in 1992. Unfilled orders stood at a 15.3 percent year-ago gain in June.
Overall, the June orders data show manufacturing to be healthier than many believed. The lower dollar is continuing to keep this sector in positive territory and the odds have risen that the economy stays out of recession. Also, the Fed is being given a little more wiggle room to think about when to start raising rates.
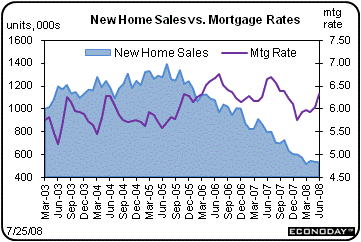 Tighter lending standards, a softer labor market, and higher mortgage rates continue to weigh on home sales. Even though new home sales did decline in June, the markets saw the numbers as somewhat positive because of upward revisions to April and May data. Annual unit sales of new homes came in at a 530,000 rate for June, down 0.6 percent in the month but against an upwardly revised 533,000 rate in May and 542,000 for April. May and April sales had been first estimated at 512,000 and 525,000, respectively. Year-on-year sales in June were still down a steep 33.2 percent. By regions, sales were strongest in the Northeast with the South and West both showing slight declines. Tighter lending standards, a softer labor market, and higher mortgage rates continue to weigh on home sales. Even though new home sales did decline in June, the markets saw the numbers as somewhat positive because of upward revisions to April and May data. Annual unit sales of new homes came in at a 530,000 rate for June, down 0.6 percent in the month but against an upwardly revised 533,000 rate in May and 542,000 for April. May and April sales had been first estimated at 512,000 and 525,000, respectively. Year-on-year sales in June were still down a steep 33.2 percent. By regions, sales were strongest in the Northeast with the South and West both showing slight declines.
Modestly good news in the report was a dip in months’ supply to 10.0 months from 10.4 months in May. But this is still an extremely bloated level and the improvement appears to be based on pessimism over putting one's house on the market. Net, there were fewer new homes sitting on the market, falling to 426,000 in June from 450,000 in May. Prices rose 1.4 percent in the month to a median $230,900 and were down only 2.0 percent year-on-year -- an improvement from the mid-single digit percentage declines of prior months.
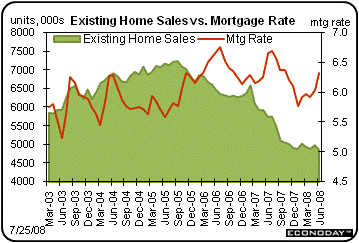 Existing home sales continued to slide in June, indicating that housing still may not have hit bottom. Sales dropped 2.6 percent to an annualized pace of 4.86 million which was down 15.5 percent from a year ago. The 4.86 million rate is the lowest in nine years of available data. Existing home sales continued to slide in June, indicating that housing still may not have hit bottom. Sales dropped 2.6 percent to an annualized pace of 4.86 million which was down 15.5 percent from a year ago. The 4.86 million rate is the lowest in nine years of available data.
As is the case with new homes, existing home supply on the market remains severely bloated and actually worsened to 11.1 months from 10.8 months in May. The median price did rise 3.5 percent in the month to $215,100 but the year-on-year rate remains very weak at minus 6.1 percent.
As others have pointed out -- including key Fed officials -- continued weakness in housing sales is having a major depressing effect on numerous other portions of the economy. Declining home values have pushed many marginal homeowners into foreclosures. Lack of healthy growth in home equity has weakened overall consumer demand. Depressed home sales specifically have cut into demand for household appliances and other housing-related products such as carpeting and renovation materials.
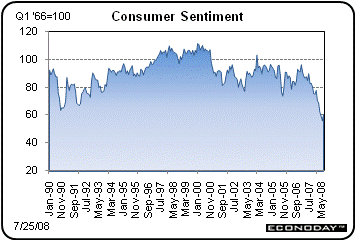 One can debate which surprise was bigger this past week – the surge in durables orders or a sizeable rebound in consumer sentiment. Regardless, a spurt upward in the Reuters/University of Michigan consumer sentiment index to 61.2 from 56.4 in June was warmly welcomed by equity markets. While still quite weak, the latest number indicates that consumers are realizing that the economy is not in free fall and that they may actually be adjusting to sharply higher gasoline prices. One can debate which surprise was bigger this past week – the surge in durables orders or a sizeable rebound in consumer sentiment. Regardless, a spurt upward in the Reuters/University of Michigan consumer sentiment index to 61.2 from 56.4 in June was warmly welcomed by equity markets. While still quite weak, the latest number indicates that consumers are realizing that the economy is not in free fall and that they may actually be adjusting to sharply higher gasoline prices.
Inflation expectations remain high but both near term and long term inflation expectations eased slightly, no doubt reflecting the very recent retreat in oil prices and gasoline prices. One-year inflation expectations dipped 2 tenths from mid-month to 5.1 percent with 5-year expectations also down 2 tenths to 3.2 percent. Nonetheless, the relatively high inflation expectations numbers will likely be a concern to at least some of the Fed’s FOMC members at their policy meeting on August 5.
The Fed is still stuck between a rock and a hard place according to the latest Beige Book from the Federal Reserve. The Beige book prepared for the August 5 FOMC meeting reported that "the pace of economic activity slowed somewhat since the last report" yet at the same time there are increased signs of rising inflation. Slower growth was due to a sluggish consumer sector, declining manufacturing, falling housing, and slowing commercial real estate activity. Exports were found to still be healthy while services activity was mixed. While growth was seen as softening, that was not the case for inflation as the Beige Book stated, "All reporting Districts characterized overall price pressures as elevated or increasing." However, wage pressures were "generally limited."
According to the latest reports from Fed District banks, the consumer is retrenching although income tax rebate checks were seen as helping sales. Consumer spending was reported as mixed, weak, or slowing in nearly all Districts. Automobile sales were almost uniformly weak across Districts. Sales were reported as picking up at discount stores while discretionary sales and housing-related sales were weak. Notably, the outlook for consumer spending was "generally downbeat."
Manufacturing "declined or remained weak" in most Districts. Notably, housing-related production was down while energy-related production was up. The outlook for capital equipment was mixed.
Residential real estate markets declined or were still weak across most of the country. Previously a source of strength, commercial real estate activity weakened or remained sluggish in a majority of Districts.
Tighter lending and deteriorating consumer balance sheets are weighing on the economy. Loan growth was generally reported to be restrained across the country, with residential real estate lending and consumer lending showing more weakness than commercial lending. Most Districts reported a further tightening of credit standards, especially for residential real estate and construction loans. Credit problems for consumers have become a significant theme over the last two Beige Books. Some deterioration in bank loan quality was reported, including increased delinquencies on consumer and residential real estate loans.
The Fed reported a worsening in inflation pressures. All Districts characterized overall price pressures as elevated or increasing. Input prices continued to rise, particularly for fuel, other petroleum-based materials, metals, food, and chemicals. Many firms indicated that they plan to try to pass along higher costs but most indicated that they are having a hard time raising prices due to soft demand. Currently, outside of food and energy, retail prices are seen as stable with some prices down due to discounting.
Most Districts reported labor markets as unchanged or slightly weaker compared with the last Beige Book. However, demand remains strong for skilled workers in most industries.
The bottom line is that the economy is mixed but moving slowly forward. In contrast, inflation pressures are rising although weak demand has restrained retail prices somewhat. The Fed's dilemma remains the same -- do they stand pat on low interest rates to boost growth or is it time to raise rates to preclude inflation. The next FOMC announcement on August 5 will likely address that issue.
The economy has been vacillating between modestly good news and modestly bad news. This is typical of economic data at turning points. While there still is turbulence ahead, we may have weathered the worst for the economy. Still, growth will be uneven for some time – with housing depressed and the consumer sector likely sluggish. Tough times are likely ongoing for the financial sector but many nonfinancial firms are doing reasonably well. Unfortunately, the problem of rising inflation pressures remains and after a few more months of relatively settled economic activity, the Fed will start being more serious about the appropriate policy move.
We get several key economic indicators just before the Fed’s August 5 FOMC meeting the following week. Two really big ones include the first estimate for second quarter GDP and the July jobs report on Friday. The other market moving indicator out during the week is the ISM manufacturing report.
The Conference Board's consumer confidence index is near historical lows after a nearly 8 point plunge in June to 50.4. The expectations component actually did set a record low of 41.0 in June, after falling more than 7 points. The present situation index came in at 64.5, down nearly 10 points from its worst reading since the early part of the ongoing expansion in 2003. Inflation expectations were severely elevated in June but unchanged from May at 7.7 percent for one year out.
Consumer confidence Consensus Forecast for July 08: 50.0
Range: 48.0 to 52.0
GDP for the first quarter ended up at an annualized 1.0 percent, keeping the economy out of the official definition of recession. Despite continued turbulence in the financial sector, marginal easing in employment, higher gasoline prices, and continued weak housing, monthly data overall actually point to possible modest improvement in GDP for the second quarter. With income tax rebate checks, consumer spending on average was a positive and the low dollar has bolstered exports. The latest durables orders report also showed healthy shipments for nondefense capital goods. However, we are not likely to see good news on the inflation front. Higher energy prices will boost headline inflation substantially. The first quarter GDP price index came in at an annualized 2.7 percent.
Real GDP Consensus Forecast for advance Q2 08: +2.4 percent annual rate
Range: +1.4 to +3.0 percent annual rate
GDP price index Consensus Forecast for advance Q2 08: +2.8 percent annual rate
Range: +0.4 to +3.5 percent annual rate
Initial jobless claims jumped sharply higher in the week ending July 19 week, rising 34,000 to 406,000 for the highest level since March. Much of the surge appears to have been due to temporary layoffs for regular, mid-summer retooling of plants by auto manufacturers. The timing of these layoffs is difficult to seasonally adjust and this year manufacturers may be engaging in more than normal retooling to shift more to gas efficient vehicles. The four-week average, especially important when seasonal adjustments become a factor, stayed in trend at 382,500 for a much more mild 4,500 gain in the week.
Jobless Claims Consensus Forecast for 7/26/08: 398,000
Range: 375,000 to 420,000
The employment cost index for civilian workers rose 0.7 percent in the first quarter showing a 3.3 percent year-on-year rate in results that show labor cost inflation essentially holding steady. The index increased 0.8 percent in the prior two quarters. Benefit payments continued a recent trend of easing, slowing to a 0.6 percent quarter-to-quarter rise from a 0.8 percent increase in the fourth quarter. Year-on-year, however, benefits were up 3.5 percent vs. the fourth quarter's 3.1 percent. Rising medical costs and employers pushing more of the burden onto employees are slowing the rise in benefits.
Employment cost index Consensus Forecast for Q2 08: +0.7 percent simple quarterly rate
Range: +0.6 to +0.8 percent simple quarterly rate
The NAPM-Chicago purchasing managers' index continued to report flat month-to-month conditions in June, showing a modest 5 tenths gain to 49.6. The latest number is the strongest since January’s 51.5 reading as the index has been below the breakeven mark of 50 for five consecutive months. Looking ahead, other components suggest little near-term improvement. New orders slowed in the latest month and barely remained in positive territory, coming in at 52.0. The backlog index fell almost 5 points to 42.3.
NAPM-Chicago Consensus Forecast for July 08: 49.0
Range: 48.0 to 50.1
Nonfarm payroll employment continued to contract in June with a 62,000 decline – the same as in the prior month. Although establishment employment has fallen for six consecutive months, the job cuts have not been large enough to pull the economy into recession. In the latest month, weakness was led by declines in construction and manufacturing with losses of 43,000 and 33,000, respectively. The civilian unemployment rate remained elevated at 5.5 percent, matching the May level. Wage inflation has not accelerated, rising 0.3 percent in both May and June with the year-ago pace holding steady at 3.5 percent.
Nonfarm payrolls Consensus Forecast for July 08: -72,000
Range: -150,000 to -10,000
Unemployment rate Consensus Forecast for July 08: 5.6 percent
Range: 5.5 to 5.6 percent
Average workweek Consensus Forecast for July 08: 33.7 hours
Range: 33.6 to 33.8 hours
Average hourly earnings Consensus Forecast for July 08: +0.3 percent
Range: +0.2 to +0.7 percent
The Institute for Supply Management's manufacturing index in June held flat but input price inflation soared. The overall composite index rose to 50.2 from 49.6 in May. The latest number is the first plus 50 reading since January. But raw material costs have been soaring in the U.S. manufacturing sector as the prices paid index in June reached a rare 91.5 reading. The June figure was not a record but has been surpassed in 60 years of data only during the oil embargo period of the mid-1970s.
ISM manufacturing index Consensus Forecast for July 08: 49.2
Range: 48.0 to 50.5
Construction spending fell in May but there are signs of strength outside of housing. Construction outlays fell 0.4 percent, following a 0.1 percent decrease in April. The May drop was led by a 1.6 percent drop in private residential outlays. However, private nonresidential spending rose 0.2 percent while public outlays advanced 0.4 percent in the latest month. While housing is still on a downtrend, the nonresidential and public sectors are helping many construction workers to hang onto their jobs and also are still adding to economic growth.
Construction spending Consensus Forecast for June 08: -0.4 percent
Range: -1.0 to -0.1 percent
Sales of domestic motor vehicles fell to a 9.9 million unit pace in June as consumers are being forced to turn away from purchasing U.S. built SUVs and autos that generally do not get as good gas mileage as many imports. Overall vehicles sales slipped to a 13.6 million combined domestic-made and import rate that's the lowest since September 1993 (total domestic rate is 9.9 million). Import cars were the only strong category, hitting a record 2.8 million rate and reflecting consumer demand for fuel efficiency.
Motor vehicle domestic sales Consensus Forecast for July 08: 9.95 million-unit rate
Range: 9.80 to 10.20 million-unit rate
Econoday Senior Writer Mark Pender contributed to this article.
|


 STOCKS