|
This past week, economic news was soft but generally surprised slightly on the upside – until Friday’s half a percentage point jump in the unemployment rate to 5.5 percent for May. The unexpected weakening in the labor market led to expectations that interest rates may not be headed up as soon as believed; the dollar dropped, oil surged, and equities swooned – all well before noon. But by Friday afternoon, the spot price for crude was up by almost $11 per barrel for the day and for a new record settle, leaving equities falling like a lead balloon.
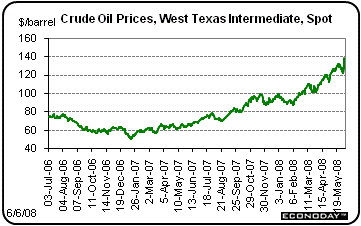 Oil prices surged over $16 per barrel the last two days of this past week and set another record high, settling at $138.54 on Friday for spot West Texas Intermediate. Net for the week, the spot price was up $10.66 per barrel. The previous record high of $132.07 per barrel was May 21. Oil prices surged over $16 per barrel the last two days of this past week and set another record high, settling at $138.54 on Friday for spot West Texas Intermediate. Net for the week, the spot price was up $10.66 per barrel. The previous record high of $132.07 per barrel was May 21.
But prices actually headed significantly in the other direction the first three days of the week. Prices were down only marginally on Monday. Crude fell over $3 per barrel on Tuesday, however, after remarks by Fed Chairman Ben Bernanke that further interest rate cuts by the Fed are unlikely, which boosted the dollar and made oil more expensive for buyers in other currencies such as the euro. Traders also started taking positions that Wednesday’s inventory data would show a significant rise in gasoline stocks. Their expectations were met and then some as gasoline stockpiles jumped 2.94 million barrels – the biggest increase in four months. Crude dropped $2 per barrel for the day.
But oil prices headed back up on Thursday after European Central Bank President Jean-Claude Trichet indicated that some of the bank’s governors favor a rate increase. This led to a drop in the dollar and nearly a $5.50 jump in oil prices for the day as traders bought oil as an inflation hedge. Friday’s half a percentage point spike in the U.S. unemployment rate led traders to believe that the Fed will not be boosting interest rates later this year or at least not by much. This led to a sharp decline in the dollar and further boosted demand for oil as an inflation hedge. Also providing heavy lift were hedge funds having to cover short positions after losing their bets for a drop in crude. Furthermore, the oil rally was boosted by an Israeli official who said an attack on Iran’s nuclear facilities was “unavoidable” and also by a warning from Morgan Stanley that oil prices may reach $150 per barrel by early July. Crude surged $11 per barrel on Friday, setting a record one-day dollar increase.
The week’s settle at $138.54 per barrel was largely due to a re-evaluation of relative interest rates in coming months between the U.S. and the EMU and, in turn, a weaker dollar. While U.S. demand for oil is seen as softening, China and other developing economies are seen as more than taking up that slack. One cannot forget that the hurricane season in the Atlantic and Gulf of Mexico also keeps oil traders jittery this time of year.
 Equities were down last week as the surge in oil prices and the negative employment report pulled stocks down at week's end. Losses on Friday offset on Thursday what was the biggest day for gains in almost two months. Equities were down last week as the surge in oil prices and the negative employment report pulled stocks down at week's end. Losses on Friday offset on Thursday what was the biggest day for gains in almost two months.
The week got off to a bad start the first two days with bad news on financials taking the spotlight. Stocks dipped notably across the board on Monday on news that Wachovia was ousting its CEO and also on an announcement by Standard & Poor’s that it had lowered its debt ratings on Morgan Stanley, Lehman Brothers, and Goldman Sachs. Stocks swooned again on Tuesday on comments by Fed Chairman Ben Bernanke suggesting that inflation is now a higher priority than recession fighting. Also, Lehman Brothers pulled financials down on speculation that the firm will report its first ever quarterly loss and will need to raise more capital. Also, a dip in oil prices weighed on the energy sector.
Wednesday found the blue chips flat while techs and small caps posted moderate gains. An early rally in the broad market ended in retreat as problems with financial firms resurfaced – notably on news that bond insurers MBIA and Ambac were being down rated by Moody’s. But techs got a sizeable lift from gains by Intel and Cisco Systems while a positive ADP employment report boosted small caps.
Thursday saw healthy gains in the 2 percent-plus vicinity as sales reported by Wal-Mart and Costco beat estimates significantly and gave investors some optimism about the consumer. A dip in initial unemployment claims also supported general gains. Higher oil prices lifted energy stocks. But all of that turned around after Friday’s half a percentage point surge in the May unemployment rate. This raised fears of recession, pulled Treasury yields and the dollar down, and led to a sharp increase in oil prices. By the end of the day, an $11 per barrel surge in oil prices had pummeled equities except in the energy sector. The Dow dropped 395 points – its largest one-day fall in 15 months. All components of the Dow declined except for Chevron which rose on the oil gains. For the week, blue chips saw the biggest declines.
Last week, major indexes were mixed as follows: the Dow, down 3.4 percent; the S&P 500, down 2.8 percent; the Nasdaq, down 1.9 percent; and the Russell 2000, down 1.1 percent.
For the year-to-date, major indexes are down from year end as follows: the Dow, down 8.0 percent; the S&P 500, down 7.3 percent; the Nasdaq, down 6.7 percent; and the Russell 2000, down 3.3 percent.

Weekly percent change column reflects percent changes for all components except interest rates. Interest rate changes are reflected in simple differences.
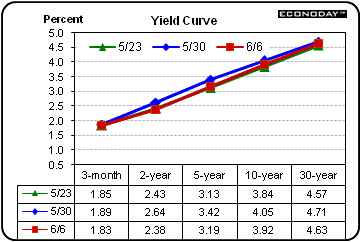 Treasury rates were down for the week, primarily on flight to safety and in reaction to a weak employment report. Worries over the health of financial firms were a key theme for the week. Treasury rates were down for the week, primarily on flight to safety and in reaction to a weak employment report. Worries over the health of financial firms were a key theme for the week.
Most rates headed down on Monday and Tuesday. Economic data were soft early in the week and data either met or came in better than expectations and were not the cause of the easing in rates. Indeed, flight to safety was spurred by news of management shakeups at Washington Mutual and Wachovia over losses. A cut in Standard & Poor’s outlook for Lehman Brothers, Merrill Lynch, and Morgan Stanley also led to flight to safety on Monday. Rates eased on Tuesday despite comments by Fed Chairman Ben Bernanke that further rate cuts are not likely. An afternoon outflow of funds from equities into Treasuries was due to continuing concerns over the health of the financial sector.
Rates firmed on Wednesday and Thursday. Rates were boosted by additional comments by Bernanke that inflation is a rising concern at the Fed. An unexpected rise in ADP employment also firmed rates. Treasury prices did recover part of the day’s losses after Moody’s announced a likely downgrade of ratings for bond insurers MBIA and Ambac. Thursday’s moderate rise in rates was due to comments by European Central Bank President Jean-Claude Trichet that the central bank is likely to raise rates in the near future and due to a dip in initial jobless claims.
 But on Friday Treasury yields generally fell by double-digit basis points on the spike in the May unemployment rate. But on Friday Treasury yields generally fell by double-digit basis points on the spike in the May unemployment rate.
On the week Treasury rates were down as follows: 3-month T-bill, down 6 basis points, the 2-year note, down 26 basis points; the 5-year note, down 23 basis points; the 10-year bond, down 13 basis points; and the 30-year bond, down 7 basis points.
The past week’s dip in rates was a mild reversal of the uptrend in rates over recent weeks.
This past week, the big news was a surge in May’s unemployment rate – the fact that payroll losses were modest and not as bad as expected was lost in the stir over the spike in unemployment. Otherwise, the economic data were soft but generally a little better than expected.
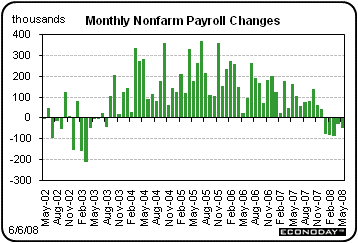 You would not know it by the market reaction to the May employment situation report - job losses actually were modest. But market attention was on the half a percentage point jump in the unemployment rate – which may have been a statistical fluke. You would not know it by the market reaction to the May employment situation report - job losses actually were modest. But market attention was on the half a percentage point jump in the unemployment rate – which may have been a statistical fluke.
Indeed, payroll losses were very moderate. Nonfarm payroll employment in May declined 49,000, following a decrease of 28,000 in April and a fall of 88,000 in March. These declines are not strong enough yet to pull the economy into recession. We will likely need to see job losses of more than 100,000 per month before the economy actually contracts.
 Nonetheless, the latest payroll numbers point to a flat economy with sluggishness widespread. The latest decrease in payroll jobs was led by declines in construction, professional & business services, retail trade, and manufacturing. Goods-producing jobs fell 57,000 with construction jobs declining 34,000 and manufacturing by 26,000. Mining edged up 3,000. Service-providing jobs were essentially flat with an 8,000 rise. Nonetheless, the latest payroll numbers point to a flat economy with sluggishness widespread. The latest decrease in payroll jobs was led by declines in construction, professional & business services, retail trade, and manufacturing. Goods-producing jobs fell 57,000 with construction jobs declining 34,000 and manufacturing by 26,000. Mining edged up 3,000. Service-providing jobs were essentially flat with an 8,000 rise.
On the inflation front, average hourly earnings advanced 0.3 percent in May, following a 0.1 percent gain the month before. Year-on-year, average hourly earnings were up 3.5 – the same as in April. The slippage in payroll jobs has led to some modest softening in wage inflation. But the trend in average hourly earnings has been slow to come down. The year-ago pace set a cycle high of 4.3 percent in December 2006.
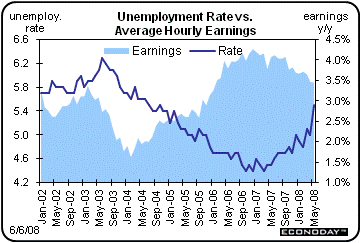 Even though the payroll survey is more reliable than the household survey due to its much larger sample size, markets focused on the household survey as the civilian unemployment rate spiked to 5.5 percent from 5.0 percent in April. The last time the unemployment rate jumped half a percentage point was February 1985 and the rate of 5.5 percent was last seen in October 2004. The latest jump in the unemployment rate reflected a 285,000 decline in household employment, a surge of 861,000 in unemployed, and a 577,000 boost in the labor force. The May spike could have been caused in part by seasonal adjustment difficulties as May is when some college students enter the labor market. If more students enter the market sooner than seasonal factors assume, that will not be fully taken into account. If this was the reason for the May jump in unemployment, we will likely see some significant reversal next month. Even though the payroll survey is more reliable than the household survey due to its much larger sample size, markets focused on the household survey as the civilian unemployment rate spiked to 5.5 percent from 5.0 percent in April. The last time the unemployment rate jumped half a percentage point was February 1985 and the rate of 5.5 percent was last seen in October 2004. The latest jump in the unemployment rate reflected a 285,000 decline in household employment, a surge of 861,000 in unemployed, and a 577,000 boost in the labor force. The May spike could have been caused in part by seasonal adjustment difficulties as May is when some college students enter the labor market. If more students enter the market sooner than seasonal factors assume, that will not be fully taken into account. If this was the reason for the May jump in unemployment, we will likely see some significant reversal next month.
The bottom line is that the jump in unemployment should be viewed with heavy skepticism – especially since jobless claims do not corroborate that spike. The more reliable payroll employment numbers indicate that the labor market is in a very mild contraction – one that currently is too mild to pull the overall economy into recession. Nonetheless, the latest jobs numbers suggest that any second half economic recovery is likely to be sluggish.
 According to the ISM manufacturing index, this sector is still flat. The composite index rose 1 point in May to a near 50 level of 49.6, indicating little change from April. New orders improved to an essentially flat stance at 49.7 from the 46.5 level in May that was well into contraction territory. Exports were the main lift for orders, which jumped 2 full points to a 59.5 level. According to the ISM manufacturing index, this sector is still flat. The composite index rose 1 point in May to a near 50 level of 49.6, indicating little change from April. New orders improved to an essentially flat stance at 49.7 from the 46.5 level in May that was well into contraction territory. Exports were the main lift for orders, which jumped 2 full points to a 59.5 level.
While overall activity is flat, the same cannot be said for prices. Prices paid have been steadily rising since this past autumn and hit 87.0 in May – the highest reading since the 88.0 mark for April 2004.
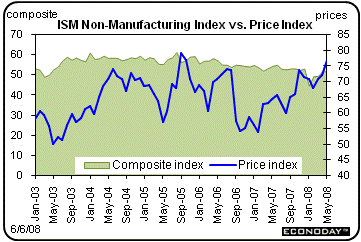 Accoring to the ISM survey, the non-manufacturing sector is barely maintaining positive growth. The ISM's composite non-manufacturing index slipped 3 tenths to 51.7 for May, just barely above the break even level of 50. The business activity index is showing a little more strength, coming in at 53.6, almost 3 points above April’s level. The business activity index is equivalent to a production index. Accoring to the ISM survey, the non-manufacturing sector is barely maintaining positive growth. The ISM's composite non-manufacturing index slipped 3 tenths to 51.7 for May, just barely above the break even level of 50. The business activity index is showing a little more strength, coming in at 53.6, almost 3 points above April’s level. The business activity index is equivalent to a production index.
As in the ISM manufacturing report, the big negative was a spike in prices paid. The prices paid index jumped to 77.0 from 72.1 in April. The surge in prices paid in both reports only adds to the Fed’s new-found concerns over rising inflation pressures.
 Construction spending continued its downtrend in April but the good news is that nonresidential construction is still providing some support for this sector. Construction outlays dropped another 0.4 percent in April, following a 0.6 percent decline the month before. The latest decrease in construction spending was led by a sharp 2.3 percent fall in private residential outlays with public spending also down 0.3 percent. However, private nonresidential construction spending advanced 1.6 percent in the latest month. Essentially, housing construction is still depressed by excess supply of unsold homes and the public sector may be seeing a slowing due to budget problems at the state government level. But businesses are optimistic enough to continue to expand in the nonresidential sector. Construction spending continued its downtrend in April but the good news is that nonresidential construction is still providing some support for this sector. Construction outlays dropped another 0.4 percent in April, following a 0.6 percent decline the month before. The latest decrease in construction spending was led by a sharp 2.3 percent fall in private residential outlays with public spending also down 0.3 percent. However, private nonresidential construction spending advanced 1.6 percent in the latest month. Essentially, housing construction is still depressed by excess supply of unsold homes and the public sector may be seeing a slowing due to budget problems at the state government level. But businesses are optimistic enough to continue to expand in the nonresidential sector.
The private nonresidential component saw a broad-based gain in April and was led by a strong gain in lodging. Other subcomponents that advanced were commercial, health care, educational, religious, transportation, power, and manufacturing. Subcomponent declines were only seen in amusement & recreation and in communication.
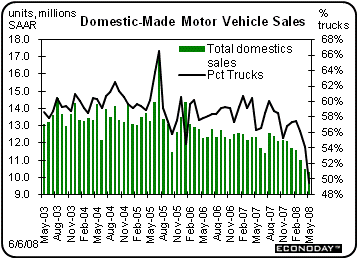 With the labor market slipping and consumer budgets being battered by higher prices for gasoline and food, the ability of the consumer to keep the economy afloat is a big question. While recent numbers from chain stores have hinted at possible resilience by the consumer, motor vehicle sales suggest otherwise. Motor vehicle sales were very weak in May, slipping to a 14.30 million annual sales rate that is down from 14.46 million in April. Weakness was in light trucks which fell to a 6.32 million rate from 7.00 million in April, underscoring GM’s conclusion for the need to close four light truck plants and to put Hummer on the sales block. Car sales actually picked up but were still sluggish at a 7.98 million unit pace, up from 7.46 million in April. With the labor market slipping and consumer budgets being battered by higher prices for gasoline and food, the ability of the consumer to keep the economy afloat is a big question. While recent numbers from chain stores have hinted at possible resilience by the consumer, motor vehicle sales suggest otherwise. Motor vehicle sales were very weak in May, slipping to a 14.30 million annual sales rate that is down from 14.46 million in April. Weakness was in light trucks which fell to a 6.32 million rate from 7.00 million in April, underscoring GM’s conclusion for the need to close four light truck plants and to put Hummer on the sales block. Car sales actually picked up but were still sluggish at a 7.98 million unit pace, up from 7.46 million in April.
The bottom line is the there is a major reorientation in the motor vehicle market as higher gasoline prices are killing demand for SUVs and heavy pickup trucks.
This past week the economy was not as weak as the markets concluded after the Friday employment report. However, if even most of the recent gains in oil prices stick, the consumer sector is likely to slow more than anticipated in recent weeks. And inflation is likely to tick higher. While there are key indicators out this coming week, whether oil prices retreat is likely to be a big question – for traders, consumers, and the Fed.
The week ahead has some key market moving indicators weighing in. These include international trade on Tuesday, retail sales on Thursday, and consumer prices on Friday. The import prices release will also likely get a lot of market scrutiny on Thursday.
The U.S. international trade gap in March shrank sharply with imports declining across the board. The overall U.S. trade gap narrowed to $58.2 billion from a $61.7 billion deficit in February. In March, exports slipped 1.7 percent while imports dropped 2.9 percent. Both the oil and the nonoil gap grew smaller. The oil trade gap shrank to $35.2 billion from $37.4 billion the month before while the nonoil deficit narrowed to $36.1 billion in March from $37.3 billion in February. Given that the decline in March exports was largely due to a fall in the volatile aircraft shipments category, there is a good chance that exports will rebound in April. Consumer spending has been softening and that could keep imports weak. Now, even the barrels of imported oil may be impacted by a sharp cutback in driving by consumers although price effects could bump up nominal imports.
International trade balance Consensus Forecast for April 08: -$59.5 billion
Range: -$62.0 billion to -$56.3 billion
The Beige Book is for the June 25 FOMC meeting. Fedspeak since the last FOMC meeting has been rather blunt that the Fed is on pause regarding further rate cuts. Even last week, Chairman Ben Bernanke stated, “For now, policy seems well positioned to promote moderate growth and price stability over time.” But the last Beige book was decidedly negative, noting that "that economic conditions have weakened" since the prior report and May unemployment jumped sharply. Clearly, FOMC members will be looking for signs that the economy has stabilized since the Fed cannot afford to let inflation expectations get out of control with further rate cuts.
The U.S. Treasury monthly budget report for April showed a surplus of $159.3 billion but was well below the April 2007 surplus of $177.7 billion. The fiscal year-to-date deficit for 2008 remains quite large compared to that for last year, a $152.2 billion deficit versus $80.8 billion. Fiscal year-to-date receipts have slowed to a 3.0 percent gain while outlays were up 7.4 percent. Individual income tax receipts are up 6.0 percent while corporate income taxes are down 14.7 percent. Looking ahead, the month of May typically shows a moderate deficit for the month. Over the past 10 years, the average deficit for May has been $47.4 billion. But we are likely to see a surge in the deficit due to the mailing of income tax rebate checks in May.
Treasury Statement Consensus Forecast for May 08: -$155.0 billion
Range: -$165.0 billion to -$96.0 billion.
Retail sales in April were strong across the board with the key exceptions of autos and gasoline. Overall retail sales fell back 0.2 percent in March, following a 0.2 percent rebound in March. But excluding motor vehicles, retail sales jumped 0.5 percent in March after rising 0.4 percent the month before. When excluding both motor vehicles and gasoline, sales actually surged 0.6 percent, after increasing 0.2 percent in March. More recently, unit new auto sales dropped significantly in May – slipping to a 14.30 million unit annual pace from 14.46 million units in April, indicating weakness in the auto dealership component of retail sales. Chain store sales have shown improvement recently – at least on a year-ago basis. Year-ago gains do not always translate into a boost for the latest monthly number due to expectations built into monthly seasonal factors. And consumers may be becoming more value conscious with one of the recent upside surprises for sales being Wal-Mart.
Retail sales Consensus Forecast for May 08: +0.5 percent
Range: -0.3 to +0.8 percent
Retail sales excluding motor vehicles Consensus Forecast for May 08: +0.7 percent
Range: +0.2 to +1.3 percent
Initial jobless claims fell a steep 18,000 in the week ending May 31 to 357,000, pushing for the four-week average down to 368,500. Continuing claims remain too high but did fall 16,000 in the May 24 week to 3.093 million. The latest report strongly suggests that the labor market is stabilizing. Additionally, we should see some positive effects on claims from American Axle strikers returning to work over this week and the next. But the relatively benign claims numbers are a sharp contrast to the jump in the unemployment rate in the May employment situation report. Markets will be watching the claims numbers for clues as to whether the May spike in the unemployment rate was a fluke or not.
Jobless Claims Consensus Forecast for 6/7/08: 365,000
Range: 360,000 to 375,000
Import prices surged once again in April, jumping 1.8 percent in the month for a year-on-year gain of 15.4 percent. Higher oil prices led the gain but price increases were strong even when excluding petroleum. Excluding this category, import prices still surged 1.1 percent for the month with the year-on-year gain up 6.2 percent -- the worst reading since the late 1980s.
Import prices Consensus Forecast for May 08: +2.0 percent
Range: -3.4 to +2.8 percent
Business inventories are being kept under control by businesses as economic growth slows. Business inventories rose only 0.1 percent in March, primarily pulled lower by a 0.5 percent drawdown at retailers. More recently, retail sales have been mixed with April sales moderately strong but May auto sales slipped. Newer inventory numbers include a flat reading for manufacturers’ inventories in April and a 1.3 percent jump in wholesale inventories for the same month. Odds are that retail inventories will be a little on the high side – especially for motor vehicles – and will boost overall inventory stocks for the month.
Business inventories Consensus Forecast for April 08: +0.3 percent
Range: +0.1 to +0.5 percent
The consumer price index surprisingly showed an easing in inflation in April as the overall CPI posted a 0.2 percent increase, after a 0.3 percent boost the month before. The core rate also eased, to a 0.1 percent rise after a 0.2 percent advance the month before. The question for the May release is whether the April improvement was just a fluke or reflected a softening in demand. Indeed, weaker spending may have undercut inflation for motor vehicles, lodging away from home, and household furnishings in the April report. But energy was flat and that likely was just due to mismatches in unadjusted (seasonal) data and assumed seasonal changes in energy components. Also, higher commodity prices and import prices boosted food and apparel. There is lots of uncertainty over the true direction of consumer inflation but the Fed has now made inflation fighting job number one over recession prevention and this report is an almost guaranteed market mover.
CPI Consensus Forecast for May 08: +0.5 percent
Range: +0.2 to +0.7 percent
CPI ex food & energy Consensus Forecast for May 08: +0.2 percent
Range: +0.1 to +0.3 percent
The Reuter's/University of Michigan's Consumer sentiment index fell in May to 59.8 from April’s 62.6. April’s reading is at the series’ lowest since the early 1980s. The latest report had bad news especially for the inflation sensitive Fed as the one-year inflation expectations reading came in at a high 5.2 percent -- a 4 tenths gain from April.
Consumer sentiment Consensus Forecast for preliminary May 08: 59.8
Range: 55.0 to 63.0
Econoday Senior Writer Mark Pender contributed to this article.
|

