|
Economic data were quite mixed this past week and with negatives arguably outweighing the positives by quite a bit. But equities chose to focus on the positives and on the hoped for rebound in activity in the second half. Probably the biggest positive was a moderate retreat of oil prices, although they remain in the stratosphere.
The trading week in the U.S. was shortened by the Memorial Day holiday.
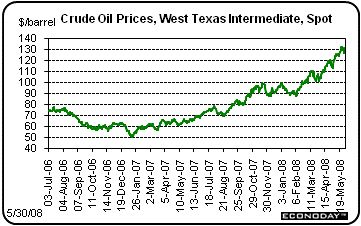 Oil prices retreated somewhat last week but remain extraordinarily high, with rising price pressures on refined products probably still in the pipeline. Net for the week, the spot price for West Texas Intermediate was down $3.71 per barrel to end the week at $127.88 per barrel, down $4.19 cents from the record high of $132.07 per barrel set on May 21. Oil prices retreated somewhat last week but remain extraordinarily high, with rising price pressures on refined products probably still in the pipeline. Net for the week, the spot price for West Texas Intermediate was down $3.71 per barrel to end the week at $127.88 per barrel, down $4.19 cents from the record high of $132.07 per barrel set on May 21.
Prices fell about $3 per barrel on Tuesday as trading saw demand easing on high prices and a slow economy. The dollar dropped consumer confidence dropped to its lowest level in 15 years, adding to price weakness. Prices rebounded by over $2 per barrel on Wednesday on comments by a Morgan Stanley analyst that crude oil prices could hit $150 per barrel by year end. But the biggest movement during the week was a sharp drop of almost $4.50 per barrel on Thursday after the Commodity Futures Trading Commission announced that it had initiated an investigation into trading practices in oil futures, including possible price manipulation. The announcement led to a sharp drop in spot prices for West Texas Intermediate to $126.62 per barrel – the lowest close in eight trading days. But prices ended the week with a daily gain of $1.26 per barrel as traders saw Thursday’s settle as oversold and a bargain price. Yes, Toto, you aren’t in Kansas anymore.
Last week’s settle at $127.88 per barrel still reflects the general view of traders in the oil markets that a weakening in demand in the U.S. will be more than offset by growing demand in the rest of the world.
 Equities ended the month of May on a positive note as all major indexes posted net gains for the week. The biggest contributing factor behind the advances was a net decline in oil prices, which helped investors overlook mostly negative economic data. Equities ended the month of May on a positive note as all major indexes posted net gains for the week. The biggest contributing factor behind the advances was a net decline in oil prices, which helped investors overlook mostly negative economic data.
At the start of the week, an almost $3 per barrel drop in oil prices on Tuesday helped traders forget about a sharp drop in consumer confidence for May, giving stocks their biggest gains for the week. Stocks were boosted on Wednesday by better-than-expected durables orders – especially after discounting the volatile transportation component. Key beneficiaries were Caterpillar and Alcoa. Higher oil prices also lifted energy shares. In contrast, downgrades weighed on financials.
On Thursday, the $4-plus drop in oil prices was the big factor for the day’s equity gains. Also contributing were an upward revision to first quarter GDP and a stronger dollar. Financials led the markets for the day - notably Citigroup, Bank of America, MasterCard, and JP Morgan. As almost an aside, the JP Morgan-Bear Stearns deal was brought to a close as a majority of Bear Stearns stockholders approved the takeover. After close on Thursday, Dell announced quarterly sales and earnings that beat estimates. Dell’s good news carried over to techs on Friday but the Dow ended the week down slightly for the day even though the day’s boost in oil prices lifted the energy sector.
Last week, major indexes were up as follows: the Dow, up 1.3 percent; the S&P 500, up 1.8 percent; the Nasdaq, up 3.2 percent; and the Russell 2000, up 3.3 percent.
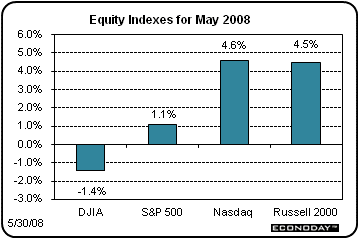 For the month of May, major indexes were mixed but mostly up as follows: the Dow, down 1.4 percent; the S&P 500, up 1.1 percent; the Nasdaq, up 4.6 percent; and the Russell 2000, up 4.5 percent. For the month of May, major indexes were mixed but mostly up as follows: the Dow, down 1.4 percent; the S&P 500, up 1.1 percent; the Nasdaq, up 4.6 percent; and the Russell 2000, up 4.5 percent.
For the year-to-date, major indexes are still down from year end as follows: the Dow, down 4.7 percent; the S&P 500, down 4.6 percent; the Nasdaq, down 4.9 percent; and the Russell 2000, down 2.3 percent.
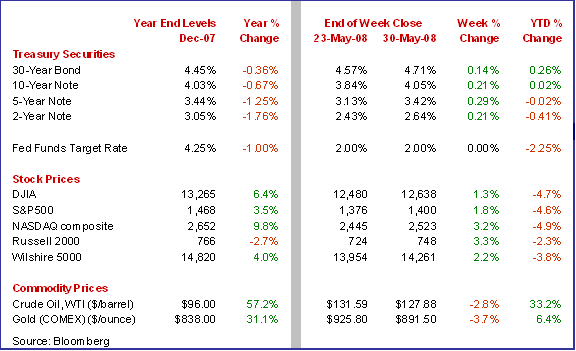
Weekly percent change column reflects percent changes for all components except interest rates. Interest rate changes are reflected in simple differences.
 Treasury rates were up moderately for the week. Rising inflation fears continued to weigh on Treasury prices as did outflow of funds into equities. Treasury rates were up moderately for the week. Rising inflation fears continued to weigh on Treasury prices as did outflow of funds into equities.
Rates firmed the first three days of the shortened week before easing slightly on Friday. Rates rose on Tuesday despite a drop in consumer confidence as lower oil prices led money into equities. A favorable durable goods report on Wednesday also resulted in traders moving funds from fixed income into stocks. Also, a rebound in oil prices lifted inflation worries. On Thursday, an upward revision to first quarter GDP growth caused rates to firm.
The week ended with some slippage in rates on Friday as personal consumption price index inflation eased.
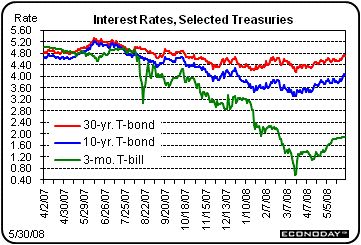 Despite Friday’s improvement in PCE inflation for the month of April, the bond market still sees inflation as a looming problem, given still high oil prices, extensive Fed easing, fiscal stimulus, and a weak dollar. Despite Friday’s improvement in PCE inflation for the month of April, the bond market still sees inflation as a looming problem, given still high oil prices, extensive Fed easing, fiscal stimulus, and a weak dollar.
On the week Treasury rates were up as follows: 3-month T-bill, up 4 basis points, the 2-year note, up 21 basis points; the 5-year note, up 29 basis points; the 10-year bond, up 21 basis points; and the 30-year bond, up 14 basis points.
Long-term rates have been rising steadily since mid-March over both inflation concerns and a reversal of flight to safety as credit markets have stabilized somewhat and equities look more attractive.
This past week, economic data were more negative than not. The good news, however, is that inflation eased even though it might be temporary and there are signs that manufacturing is holding steady rather than contracting. The bad news is that the consumer sector is softening notably with consumer confidence eroding while housing remains depressed.
 We got a second reading on first quarter GDP this past week and an upward revision made equity traders happy. The economy still stayed out of recession in the first quarter as GDP growth was revised up to an annualized 0.9 percent, compared to the initial first quarter estimate of 0.6 percent. There were no notable changes in the detail other than the cumulative effect of modestly higher overall growth. The first quarter gain is slightly stronger than the 0.6 percent rise seen for the fourth quarter. But the bottom line is that the economy is still basically flat. We got a second reading on first quarter GDP this past week and an upward revision made equity traders happy. The economy still stayed out of recession in the first quarter as GDP growth was revised up to an annualized 0.9 percent, compared to the initial first quarter estimate of 0.6 percent. There were no notable changes in the detail other than the cumulative effect of modestly higher overall growth. The first quarter gain is slightly stronger than the 0.6 percent rise seen for the fourth quarter. But the bottom line is that the economy is still basically flat.
The upward revision to the percent change in real GDP primarily reflected a downward revision to imports and upward revisions to nonresidential structures and to PCEs for nondurable goods that were partly offset by downward revisions to private inventory investment, to exports, and to PCE for services.
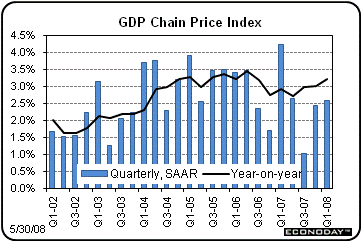
On the inflation front, first quarter numbers were either unrevised or little changed with headline inflation still on the strong side. The GDP price index was unrevised an annualized 2.6 percent, following the fourth quarter's 2.4 percent. Headline PCE inflation also was unrevised from the initial estimate of 3.5 percent. Meanwhile core PCE inflation was revised down incrementally to 2.1 percent from the advance estimate of 2.2 percent.
The bottom line is that the economy is still essentially flat with inflation that is too high. But with no outright proof of recession, the Fed certainly is starting to focus more on fighting inflation than preventing too weak growth.
 Traders in equity markets must have had their rose colored glasses on when the personal income report was released. There was a little good news on the inflation front and market expectations were met on the overall income and spending numbers. But the details in the report show a consumer sector that is weaker than generally acknowledged. Traders in equity markets must have had their rose colored glasses on when the personal income report was released. There was a little good news on the inflation front and market expectations were met on the overall income and spending numbers. But the details in the report show a consumer sector that is weaker than generally acknowledged.
 Personal income in April slowed to a 0.2 percent increase, following a 0.4 percent advance in March. April's gain equaled the consensus forecast for a 0.2 percent rise. But the average worker appears to be bearing the brunt of the economic slowdown as the wages and salaries component actually fell 0.2 percent, following a 0.5 percent boost the month before. The strength in personal income was gains in rental income and especially a jump in government benefits. The surge in benefits reflected the start of the income tax rebates intended to boost the economy. The April change in personal current transfer receipts was boosted $7.8 billion at an annual rate to reflect payments under the Economic Stimulus Act of 2008 and compares to the total increase in personal income of $20.1 billion for April. Personal income in April slowed to a 0.2 percent increase, following a 0.4 percent advance in March. April's gain equaled the consensus forecast for a 0.2 percent rise. But the average worker appears to be bearing the brunt of the economic slowdown as the wages and salaries component actually fell 0.2 percent, following a 0.5 percent boost the month before. The strength in personal income was gains in rental income and especially a jump in government benefits. The surge in benefits reflected the start of the income tax rebates intended to boost the economy. The April change in personal current transfer receipts was boosted $7.8 billion at an annual rate to reflect payments under the Economic Stimulus Act of 2008 and compares to the total increase in personal income of $20.1 billion for April.
On the spending side, personal consumption rose a modest 0.2 percent in April after jumping 0.4 percent in March.
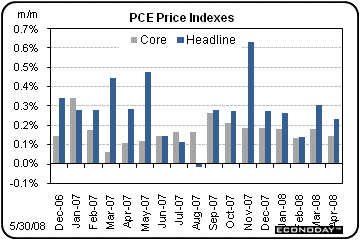
On the inflation front, the headline PCE price index came in with a 0.2 percent increase, following a 0.3 percent gain in March. The core PCE price index slowed to 0.1 percent in April, following a 0.2 percent increase the prior month. On a year-ago basis, headline PCE inflation held steady at 3.2 percent year-on-year while core PCE inflation was unchanged at up to 2.1 percent.
 While April’s inflation numbers were a little more favorable than the prior month, they were still strong enough to cut into real income and real spending. Real after-tax income was flat in both March and April while real personal spending also was flat in April after a 0.1 percent up tick the month before. Real spending has been very anemic since the fourth quarter and is showing no sign of improvement heading into the second quarter. While April’s inflation numbers were a little more favorable than the prior month, they were still strong enough to cut into real income and real spending. Real after-tax income was flat in both March and April while real personal spending also was flat in April after a 0.1 percent up tick the month before. Real spending has been very anemic since the fourth quarter and is showing no sign of improvement heading into the second quarter.
While the latest personal income report essentially essentially met market expectations for key numbers, there was a clear slowing in the consumer sector - and the decline in wages and salary income should be disconcerting. The markets shrugged off the numbers but the detail suggests that weakness in the consumer sector may be more than many are willing to see. This is especially the case since April income and spending were supported by income tax rebate checks with no discernable impact other than keeping the numbers from being negative. The income tax rebates certainly were important in April - but they may well have been eaten up by higher prices at the gasoline pump.
Consumers remain in a sour mood, due in large part to rising food and gasoline prices. The Conference Board's consumer confidence index fell nearly 5 points to 57.2, the lowest reading since 1992. But more importantly, 12-month inflation expectations jumped to 7.7 percent, up 9 tenths from May. Consumers are not expecting improvement in the economy soon. The expectations index, one of two main components that make up the headline index, is at an all-time low of 45.7, down from 50.0 in April.
The Reuters/University of Michigan consumer sentiment report corroborated trends in the Conference Board’s data. Consumer sentiment at the end of May was little changed from mid-month, edging up 3 tenths to 59.8 but was still lower than the end of April reading of 62.6. The current conditions index rose 1.6 points from mid-month to 73.3. But consumers see conditions worsening in the coming months as the expectations component fell 6 tenths to a dismal 51.1. With income growth slowing and confidence declining, this is not a combination that supports a healthy rebound in economic growth in the second half.
This report corroborates the view that consumers are increasingly concerned about rising inflation as the Reuters/University of Michigan's 1-year inflation expectations reading did not retreat from a mid-month jump to 5.2 percent - a sharp 4 tenths gain from April. Five-year expectations, at 3.4 percent, were up 1 tenth from mid-month and were 2 tenths higher from April. The increase in inflation expectations is bad news for the Fed as officials there have repeatedly stated that it is more difficult to bring inflation down when inflation expectations are up.
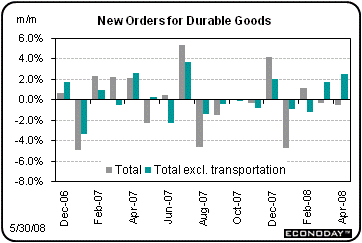 The one report this past week that actually did have good news in the detail was the durable goods report. For the headline, durable goods orders slipped another 0.5 percent in April, following a 0.3 percent decline in March. However, excluding the transportation component, new orders advanced a strong 2.5 percent in April, following a 1.7 percent gain the prior month. The rebound was primarily in electrical equipment but other industries also showed gains. The one report this past week that actually did have good news in the detail was the durable goods report. For the headline, durable goods orders slipped another 0.5 percent in April, following a 0.3 percent decline in March. However, excluding the transportation component, new orders advanced a strong 2.5 percent in April, following a 1.7 percent gain the prior month. The rebound was primarily in electrical equipment but other industries also showed gains.
Weakness in overall new orders in April was led by an 8.0 percent fall in transportation, which included a monthly 24.4 percent drop in nondefense aircraft. Motor vehicles and defense aircraft also declined, by 3.3 percent and 4.9 percent, respectively. Also, losing ground for the month were fabricated metals and computers & electronics.
The large 2.5 percent surge in new orders excluding transportation was led by a monthly 27.8 percent rebound in electrical equipment after an 18.9 percent fall the prior month. Also posting gains were primary metals, machinery, communications equipment, and “other.”
The April durables report is actually quite encouraging despite the overall dip. Many industries showed gains for the month. The bottom line is that manufacturing may be more flat than in contraction but if in recession it appears to be mild.
 Despite marginally positive numbers for April, new home sales remain severely depressed. New home sales pulled up slightly from the recent low set in March, partially rebounding 3.3 percent but against a downwardly revised March level. Sales dropped a sharp 11.0 percent that month. The current annual rate of 526,000, next only to March's 509,000, is the lowest since the early 1990s with the year-on-year percentage decline of 42.0 percent the worst since the early 1980s. Supply remains heavy at 10.6 months vs. 11.1 months in March. Despite marginally positive numbers for April, new home sales remain severely depressed. New home sales pulled up slightly from the recent low set in March, partially rebounding 3.3 percent but against a downwardly revised March level. Sales dropped a sharp 11.0 percent that month. The current annual rate of 526,000, next only to March's 509,000, is the lowest since the early 1990s with the year-on-year percentage decline of 42.0 percent the worst since the early 1980s. Supply remains heavy at 10.6 months vs. 11.1 months in March.
But prices steadied in the month, rising 9.1 percent to a median $246,100 for an actual year-on-year increase of 1.5 percent and the best level since November. The year-on-year rate had been declining in prior reports, down 13.3 percent as recently as March. However, the recent improvement in the median price is likely due to a tightening of credit for potential purchasers of lower priced housing, resulting in a smaller share of sales in this segment.
This past week the economy headed more toward continued flatness instead of planting the seeds of recovery. The latest numbers indicate that a second half rebound is likely to be sluggish.
The week ahead has the big market movers bracketing the week with the ISM manufacturing report out on Monday and the all important employment report on Friday.
The Institute for Supply Management's manufacturing index will give us a key update on the manufacturing sector for May. For April, the composite reading was steady and flat, coming in unchanged at 48.6 and just under the breakeven 50 level. However, new orders were contracting at a steeper rate, unchanged at 46.5 in the month but further below breakeven. Backlog orders were a positive in the report, ending six straight months of contraction with a 51.5 reading that was up 4 points in the month. Price pressures remain a problem as the prices paid index rose 1 point to 84.5, the worst reading since the peak of the expansion in 2004. More recently, manufacturing indicators have been mixed as overall industrial production fell 0.7 percent in April while new durables orders excluding transportation jumped 2.5 percent for the same month.
ISM manufacturing index Consensus Forecast for May 08: 48.5
Range: 47.0 to 50.4
Construction spending remains weak but with softness still primarily in the residential component. Nonetheless, other components have been showing slowing trends overall. Construction outlays in March fell 1.1 percent, following a 0.4 percent rebound in February. The latest decline in construction spending was led by a 4.6 percent drop in private residential outlays. On a year-on-year basis, overall construction outlays were down 3.4 percent in March, compared to down 2.2 percent the month before.
Construction spending Consensus Forecast for April 08: -0.6 percent
Range: -1.5 to -0.2 percent
Sales of domestic motor vehicles have been hard hit recently as consumer budgets have been squeezed by higher prices for food and gasoline. Sales of domestic light vehicles weakened further in April to a 10.4 million annual rate from 11.0 million in March. Sales of trucks continued to decline, falling to a 5.5 million rate for domestics from 6.2 million in March. The big question for May is whether stimulus package income tax rebate checks will provide some lift after initial deliveries of the checks during April.
Motor vehicle domestic sales Consensus Forecast for May 08: 10.8 million-unit rate
Range: 10.2 to 11.0 million-unit rate
Factory orders showed less weakness than expected in March, with the headline reading jumping 1.4 percent in March. However, much of the boost reflected an inflation-related 2.6 percent spike in the nondurable goods component which includes fuels. The durable goods component rose a modest 0.1 percent in the month in the latest full factory orders report. More recently, in the advance durables report for April, durable goods orders in April fell 0.5 percent but with most of the weakness in the volatile transportation component. April durables excluding transportation jumped 2.5 percent. Even though the consensus is calling for a small dip in orders, a rebound in energy prices may boost nondurables orders for April, likely resulting in an overall gain for the month.
Factory orders Consensus Forecast for April 08: -0.1 percent
Range: -0.6 to +0.4 percent
Nonfarm productivity in the first quarter improved to an annualized 2.2 percent increase, following a 1.8 percent gain in the fourth quarter. Unit labor costs moderated with a 2.2 percent annualized increase, following a 2.8 percent gain in the fourth quarter. There is a lot of overlap in source data for the output component of productivity and real GDP, and first quarter GDP has been revised up to an annualized 0.9 percent and is somewhat higher than fourth quarter GDP growth of 0.6 percent. This suggests slight improvement for productivity in the first quarter.
Nonfarm Productivity Consensus Forecast for final Q1 08: +2.5 percent
Range: +1.8 to +2.7 percent
Unit Labor Costs Consensus Forecast for final Q1 08: +1.9 percent rate
Range: +1.8 to +2.7 percent rate
The business activity index from the ISM non-manufacturing survey improved in April but remained essentially flat. The headline composite index rose 2.4 points from March to 52.0, ending three straight months in the 48 range. The business activity index, equivalent to a production index, slipped more than 1 point to 50.9. There is not much good news looking ahead as new orders slipped 1 tenth to 50.1, indicating no change. But prices continue upward with prices paid rising more than 1 point to 72.1 to indicate severe pressure. The good news is that the ISM non-manufacturing index is not signaling recession. The bad news is that no growth is being paired up with rising inflation pressures.
Composite index Consensus Forecast for May 08: +51.0
Range: +49.0 to +52.5
Initial jobless claims were little changed in the week ending May 24 week, rising 4,000 to a 372,000 level and pointing to continued but not deepening weakness in the labor market. But continuing claims may be pointing to greater weakness, jumping 36,000 for the week ending May 17 to 3.104 million for a level that is about 100,000 higher than April.
Jobless Claims Consensus Forecast for 5/31/08: 374,000
Range: 368,000 to 385,000
Nonfarm payroll employment has been on a mild downtrend in recent months but has not yet reached a pace consistent with recession. The small declines in employment are more consistent with flat growth rather than contraction as modest productivity gains still allow flat growth with slight decreases in employment. Nonfarm payroll employment in April slipped a slight 20,000, following a decline of 81,000 in March. The latest overall decrease was led by declines in construction, manufacturing, and retail trade, with decreases of 61,000, 46,000, and 27,000, respectively. On the inflation front, average hourly earnings rose a very modest 0.1 percent April while the average workweek edged down 0.1 hour to 33.7 hours in April. According to the household survey, the civilian unemployment rate slipped to 5.0 percent from 5.1 percent in March.
Nonfarm payrolls Consensus Forecast for May 08: -60,000
Range: -150,000 to -10,000
Unemployment rate Consensus Forecast for May 08: 5.1 percent
Range: 5.1 to 5.2 percent
Average workweek Consensus Forecast for May 08: 33.7 hours
Range: 33.6 to 33.8 hours
Average hourly earnings Consensus Forecast for May 08: +0.2 percent
Range: +0.1 to +0.4 percent
Consumer credit growth accelerated recently – and likely for reasons that reflect a worsening consumer sector rather than one purchasing with confidence. Consumers borrowed heavily in March, as consumer credit outstanding rose $15.3 billion in March, split between $6.3 billion for revolving credit and $9.0 billion for non-revolving credit. The rise in non-revolving credit was steep but is almost certain to slow in April given the month's unusually weak vehicle sales. The gain in revolving credit was the largest gain since November and suggests that payments for gasoline and groceries are stacking up on credit cards. Revolving credit rose at an annual rate of 6.7 percent in the first quarter, down from an even higher 8.6 percent in the fourth quarter. High interest rates on credit cards, which have not come down despite Federal Reserve rate cuts, also point to rising credit burdens in future months.
Consumer credit Consensus Forecast for April 08: +$7.4 billion
Range: $5.0 billion to +$10.5 billion
|

