|
Economic data were scarce last week but pointed to a troubling trend – emerging stagflation. And the Fed added to that possibility with its quarterly economic forecast where economic growth was cutback and inflation increased. Dominating the week, however, were oil prices which set dramatically higher records.
Oil prices continued their romp into record territory last week with little slowing in sight. New record settlement prices for spot West Texas Intermediate were set during each of the first three days of this past week. Recent demand factors creating the lift continued to include strong economic growth overseas and an expected spike in demand from China due to the recent massive earthquake.
Prices started the week up on Monday on comments by OPEC officials that supply was sufficient. On Tuesday, comments by investor T. Boone Pickens that oil would reach $150 per barrel by year end led to a $2 per barrel jump to just over $129 per barrel. Prices hit a record settle again on Wednesday with a $3 jump to over $132 per barrel on news that U.S. inventories had fallen significantly while markets had expected a modest increase. Part of the Wednesday spike in prices was due to short covering as a notable minority of traders had taken short positions, betting on a rise in oil inventories.
Crude prices eased somewhat on Thursday after oil topped a record $135 per barrel in intraday trading on a report that the International Energy Agency is concerned about oil companies not investing enough to replace and expand again oil fields. But by the end of the day, traders decided that supplies are adequate for now – plus there was not the previous day’s lift from short covering. But on Friday, fallout from the foreign exchange market boosted crude back up. The dollar fell sharply during the day and had its largest weekly decline since March. Traders bought oil and other commodities as a hedge against the declining dollar.
Net for the week, the spot price for West Texas Intermediate was up sharply at $131.59 per barrel, down 48 cents from the Wednesday’s record high of $132.07 per barrel.
 Equities fell sharply this past week as the Dow had its worst week since early February. Stocks started the week mixed despite a better-than-expected leading indicators report that led investors to believe outright recession might be avoided. This cheerier mood lifted the blue chips. However, techs were pulled down by comments from Sandisk’s CEO that consumers are pulling back due to the impact of higher gasoline prices on household budgets. Stocks on Tuesday were pummeled by inflation concerns as the core PPI came in notably stronger than expected and crude oil prices topped $129 per barrel. Also, comments by an Oppenheimer analyst that the worst of the credit market problems may not be over pushed financials down. Oil and the Fed were the big issues on Wednesday. Crude oil prices topped $133 per barrel, creating worries over costs for businesses in general and over the health of the consumer sector specifically. The Fed released FOMC minutes of the April 29-30 meeting and their quarterly economic forecasts. The minutes confirmed that the FOMC is not inclined to cut rates further and the forecast was downgraded notably for economic growth while inflation numbers were boosted significantly for 2008. Both oil and Fed news pushed equities down sharply. Equities fell sharply this past week as the Dow had its worst week since early February. Stocks started the week mixed despite a better-than-expected leading indicators report that led investors to believe outright recession might be avoided. This cheerier mood lifted the blue chips. However, techs were pulled down by comments from Sandisk’s CEO that consumers are pulling back due to the impact of higher gasoline prices on household budgets. Stocks on Tuesday were pummeled by inflation concerns as the core PPI came in notably stronger than expected and crude oil prices topped $129 per barrel. Also, comments by an Oppenheimer analyst that the worst of the credit market problems may not be over pushed financials down. Oil and the Fed were the big issues on Wednesday. Crude oil prices topped $133 per barrel, creating worries over costs for businesses in general and over the health of the consumer sector specifically. The Fed released FOMC minutes of the April 29-30 meeting and their quarterly economic forecasts. The minutes confirmed that the FOMC is not inclined to cut rates further and the forecast was downgraded notably for economic growth while inflation numbers were boosted significantly for 2008. Both oil and Fed news pushed equities down sharply.
Stocks ended a two-session losing streak on Thursday with modest gains. Equities were lifted by a dip in initial unemployment claims and later in the day by a decline in oil prices. But equities were back down Friday on worries over high oil prices slowing the economy and on continued declines for existing home sales as the housing sector pulls the economy down further. However, trading was light on Friday, heading into the Memorial Day weekend.
Last week, major indexes were down as follows: the Dow, down 3.8 percent; the S&P 500, down 3.4 percent; the Nasdaq, down 3.3 percent; and the Russell 2000, down 2.3 percent.
For the year-to-date, major indexes are still down from year end as follows: the Dow, down 5.9 percent; the S&P 500, down 6.3 percent; the Nasdaq, down 7.8 percent; and the Russell 2000, down 5.5 percent.

Weekly percent change column reflects percent changes for all components except interest rates. Interest rate changes are reflected in simple differences.
Treasury rates were little changed net for the week despite upward pressure mid-week. But the week started with downward pressure on rates.
Rates eased Monday after warnings by chip maker SanDisk led to an outflow of funds from equities to Treasuries. Flight to safety increased on Tuesday after comments by an Oppenheimer analyst that the worst of credit market losses may not yet be behind us. The 200 point drop in the Dow for the day – and other equity declines – sent funds scurrying into Treasuries. Rates firmed on Wednesday after the Fed’s minutes of the April 29-30 FOMC meeting indicated that the Fed is not likely to cut rates further due to increased concern over building inflation pressures.
Rates firmed for the second consecutive day on Thursday as intraday record oil prices boosted fears that the Fed will have to start fighting inflation with higher interest rates later this year. This view – that the Fed will raise rates later this year – is still a minority opinion but the trading has been strong enough to boost Treasury rates.
Rates dipped on Friday on news of another decline in existing home sales – with traders particularly noting another rise in supply.

On the week rates were little changed as follows: 3-month T-bill, up 1 basis point, the 2-year note, down 1 basis point; the 5-year note, up 2 basis points; the 10-year bond, down 1 basis point; and the 30-year bond, down 1 basis point.
This past week, most traders were resigned to the belief that the Fed will not cut rates further, leaving the 3-month T-bill notably higher than just two months ago.
This past week, economic data showed rising inflation pressures, a further decline in housing, and a bleaker economic outlook from the Fed.
While many economists, market analysts, and politicians have proclaimed that the U.S. economy is in recession, the Conference Board's leading indicators report suggests that we are not there yet. The index of leading economic indicators inched 0.1 percent forward in April, the second straight 0.1 percent gain. For the latest month, stock prices, the interest rate spread, and housing permits made large positive contributions to the leading index, more than offsetting declines in average weekly hours and consumer expectations.
For defining whether or not the economy is in recession, the report's coincident indicator is closely watched by the National Bureau of Economic Research. This index was flat for a second month in a row. With the economy on the edge of recession, flat results are definitely positive and indicate that we are not yet in recession.
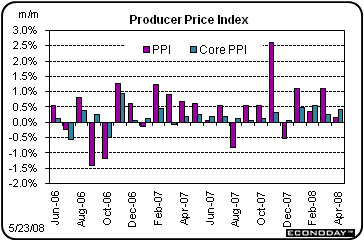
 The April producer prices report included some surprise movement in some components but the bottom line is that inflation at the producrer level is still strong. The headline number got some unexpected help from softness in the food and energy components. The overall PPI posted a 0.2 percent increase, following a sharp 1.1 percent surge in March. In contrast, the core PPI rate strengthened with a 0.4 percent boost, following a 0.2 percent rise in March. The April producer prices report included some surprise movement in some components but the bottom line is that inflation at the producrer level is still strong. The headline number got some unexpected help from softness in the food and energy components. The overall PPI posted a 0.2 percent increase, following a sharp 1.1 percent surge in March. In contrast, the core PPI rate strengthened with a 0.4 percent boost, following a 0.2 percent rise in March.
 Headline inflation was kept soft by flat food prices and a dip in energy. Food prices were unchanged in April after a 1.2 percent jump the month before. Food was weakened by declines in fresh fruit, eggs, and beef & veal. High production costs may have led to lower beef & veal prices if slaughter rates are up due to herders not being able to afford the high cost of grain. Headline inflation was kept soft by flat food prices and a dip in energy. Food prices were unchanged in April after a 1.2 percent jump the month before. Food was weakened by declines in fresh fruit, eggs, and beef & veal. High production costs may have led to lower beef & veal prices if slaughter rates are up due to herders not being able to afford the high cost of grain.
Energy slipped 0.2 percent, following a 2.9 percent surge in March. Most recently, gasoline fell 4.6 percent, after a 1.3 percent rise in March. It is important to remember that the drop in gasoline prices was on a seasonally adjusted basis. While gasoline prices continue to rise on an unadjusted basis, the April increase was less than the percentage assumed in the seasonal adjustment factors.
Motor vehicle prices played key roles in boosting April’s core number. Passenger cars rose 0.4 percent while light trucks gained 1.3 percent.
Producer price inflation remains elevated despite the quirks of the April numbers. For the overall PPI, the year-on-year gain stood at 6.4 percent, compared to 6.9 percent in March (seasonally adjusted). The core rate rose to up 3.0 percent from up 2.8 percent in March on a year-ago basis.
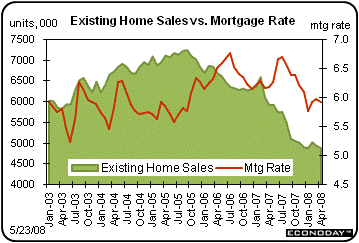
 There are still no signs of improvement in housing and - according to existing home sales – this sector actually worsened in April. Existing home sales fell 1.0 percent April to an annual unit rate of 4.890 million, matching January as the lowest in nine years of available data. There are still no signs of improvement in housing and - according to existing home sales – this sector actually worsened in April. Existing home sales fell 1.0 percent April to an annual unit rate of 4.890 million, matching January as the lowest in nine years of available data.
Supply on the market continues to balloon, at 11.2 months vs. 10.0 months in March for the worst reading since 1985. The median sales price did rise 1.1 percent from the prior month to $202,300 but is nevertheless down 8.0 percent from a year ago, the second worst on the books next to February.

Regionally, the West showed strength in the month with a 6.4 percent gain. The South was flat in April with the Northeast and Midwest showing declines of 4.4 percent and 6.0 percent, respectively.
Year-on-year, sales in April were down 17.5 percent. By Census region, year ago sales were down as follows: Northeast, down 14.7 percent; Midwest, down 19.7 percent; South, down 18.6 percent; and West, down 15.3 percent.
Today's report is dismal and indicates that housing has not yet bottomed. While the sales pace is disheartening to realtors, the excess supply numbers are outright depressing to homebuilders. The excess inventory will keep starts down for some time and will weigh on overall economic growth.
 The FOMC minutes of the April 29-30 meeting gave stronger evidence that the Fed is pausing in cutting interest rates. However, the Fed’s economic outlook worsened on both economic growth and inflation. The Fed lowered its forecast for economic growth but also raised its forecast for inflation. The FOMC minutes of the April 29-30 meeting gave stronger evidence that the Fed is pausing in cutting interest rates. However, the Fed’s economic outlook worsened on both economic growth and inflation. The Fed lowered its forecast for economic growth but also raised its forecast for inflation.
But first, reviewing the Fed’s decision to cut the fed funds target rate, the minutes indicate that it was a close call – the FOMC almost paused at the April 29-30 meeting.
“However, most members viewed the decision to reduce interest rates at this meeting as a close call. The substantial easing of monetary policy since last September, the ongoing steps taken by the Federal Reserve to provide liquidity and support market functioning, and the imminent fiscal stimulus would help to support economic activity. Moreover, although downside risks to growth remained, members were also concerned about the upside risks to the inflation outlook, given the continued increases in oil and commodity prices and the fact that some indicators suggested that inflation expectations had risen in recent months.”
This language has led markets to believe that the Fed is now pausing on further rate cuts. Essentially, the Fed now sees the risk of too low economic growth and the risk of too high inflation as balanced.
But what rattled the markets was the Fed lowering its 2008 forecast for GDP growth and substantially raising its overall inflation projections. The Fed, however, is sticking with its story of expecting recovery in the second half of this year.
“Economic activity was anticipated to be weakest over the next few months, with many participants judging that real GDP was likely to contract slightly in the first half of 2008. GDP growth was expected to begin to recover in the second half of this year, supported by accommodative monetary policy and fiscal stimulus, and to increase further in 2009 and 2010. Views varied about the likely pace and vigor of the recovery through 2009, although all participants projected GDP growth to be at or above trend in 2010.”
“Total PCE inflation was projected to moderate from its current elevated level to between 1-1/2 percent and 2 percent in 2010, although participants stressed that this expected moderation was dependent on food and energy prices flattening out and critically on inflation expectations remaining reasonably well anchored.”
Additionally, the Fed raised its forecast for the unemployment rate significantly for 2008 through 2010.

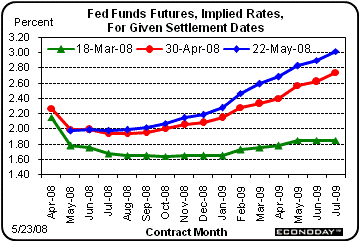
 Since earlier this year, traders in the fed funds futures market have sharply changed their views on the medium term trend in the fed funds rate. Right after the JP Morgan rescue of Bear Stearns – with Fed assistance – traders generally believed the Fed would keep cutting the fed funds rate down to 1.75 percent and keep it there until early 2009 or longer. Since earlier this year, traders in the fed funds futures market have sharply changed their views on the medium term trend in the fed funds rate. Right after the JP Morgan rescue of Bear Stearns – with Fed assistance – traders generally believed the Fed would keep cutting the fed funds rate down to 1.75 percent and keep it there until early 2009 or longer.
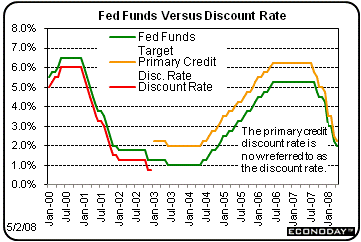
Since the runup in oil prices accelerated and financial markets have calmed, there is now the view that the Fed is already worrying about inflation and will not cut rates further from the current fed funds target rate of 2.00 percent. Additionally, the fed funds futures market sees the Fed boosting rates a lot faster than expected previously – to 3.00 percent by mid-2009.
Economic data are pointing to a flat economy – and possibly with a second half rebound that is not as robust as the Fed has been projecting. Unfortunately, higher inflation is likely to be more stubborn than the Fed has been predicting, too.
The week ahead starts off with the Monday Memorial Day holiday. The market moving indicators are durable orders on Wednesday, GDP on Thursday, and personal income on Friday.
Memorial Day holiday. All markets closed in the U.S.
The Conference Board's consumer confidence index has been quite gloomy lately as this index fell nearly 4 points in April to 62.3 -- the worst reading since the early 1990s. The present situation component, which makes up 40 percent of the headline index, fell more than 10 points to 80.7 for its worst reading since 2003 when the unemployment rate had peaked at 6.3 percent.
But the worst news in the report was a spike in inflation expectations, which were up 7 tenths for the month to 6.8 percent -- a record level matched only after Hurricane Katrina in 2005. Unless consumer confidence picks up, the rebound that many economists have been predicting for the second half may be rather flat.
Consumer confidence Consensus Forecast for May 08: 60.0
Range: 58.0 to 62.5
New home sales have yet to show signs of recovery and even continued in free fall in the latest report with March sales dropping 8.5 percent from February to an annual rate of 526,000 -- the lowest rate since 1991. The year-on-year decline of 36.6 percent was the worst since 1981. The big problem is still inventory overhang as months of supply jumped to 11.0 months from 10.2 months in February for the most bloated reading since 1981. The excess supply on the market has pushed down prices, which plunged 6.8 percent in the latest month for a 13.3 percent year-on-year decrease -- the steepest decline since 1970.
New home sales Consensus Forecast for April 08: 522 thousand-unit annual rate
Range: 500 thousand to 560 thousand-unit annual rate
Durable goods orders in March slipped 0.3 percent but the February decline of 0.9 percent has now been revised upward to a gain of 1.1 percent with the benchmark revisions released on May 16. Excluding the volatile transportation component, durables rebounded 0.9 percent, following a 1.2 percent drop in February. Despite moderate upward revisions to annual data for 2005-2007, new orders are showing some softening on the margin. Year-on-year, new orders are now down 0.9 percent. There is still some forward momentum with unfilled orders which are up 16.9 percent on a year-ago basis.
New orders for durable goods Consensus Forecast for April 08: -1.1 percent
Range: -4.0 percent to +1.0 percent
Real GDP growth for the first quarter shows the economy just barely staying out of recession with an initial estimate of 0.6 percent annualized growth. The modest rise in real GDP reflected continued strong exports, a small rise in inventories, and continued healthy personal consumption of services. Weakness was seen in declines in durables and nondurables PCEs, nonresidential fixed investment, and in residential investment. The first quarter GDP price index firmed to an annualized 2.6 percent boost from the prior quarter's 2.4 percent. The headline PCE price index was still rather hot, rising an annualized 3.5 percent in the first quarter, while the core PCE price index growth rate eased to up 2.2 percent.
Real GDP Consensus Forecast for preliminary Q1 08: +1.0 percent annual rate
Range: +0.8 to +1.2 percent annual rate
GDP price index Consensus Forecast for preliminary Q1 08: +2.6 percent annual rate
Range: +2.2 to +2.6 percent annual rate
Initial jobless claims in the latest report pointed to steady conditions in the labor market. Initial claims for the week ending May 17 fell 9,000 to 365,000. A look at the comparable four-week averages also showed mild improvement, edging down to 372,250 from 376,750 in the April 12 week. Continuing claims data, the most recent for the May 10 week, are elevated but steady, at 3.073 million and unchanged in the week.
Jobless Claims Consensus Forecast for 5/23/08: 370,000
Range: 360,000 to 380,000
Personal income in March came in moderately healthy. Spending was up but largely due to higher costs. Personal income in March advanced with a 0.3 percent increase, following a 0.5 percent gain in February. Within personal income, the wages and salaries component posted a robust 0.5 percent gain, following a moderate 0.3 percent gain the month before. On the spending side, personal consumption rose 0.4 in March after edging up 0.1 percent in February. Spending was led by a jump in services with nondurables also boosted by higher gasoline prices. Durables fell in the latest month. On the inflation front, the headline PCE price index firmed to a 0.3 percent increase, while the core PCE price index also firmed but to a more moderate 0.2 percent.
Personal income Consensus Forecast for April 08: +0.2 percent
Range: -0.4 to +0.3 percent
Personal consumption expenditures Consensus Forecast for April 08: +0.2 percent
Range: +0.1 to +0.4 percent
Core PCE price index Consensus Forecast for April 08: +0.1 percent
Range: +0.1 to +0.2 percent
The NAPM-Chicago purchasing managers' index continued to reflect flat conditions in April, coming in at just below the break-even 50 level, at 48.3 for a 1 tenth gain from March. New orders showed a mild but steady rate of month-to-month increase, at 53.0 vs. 53.9 in March. As has been the case with other regional surveys, cost pressures for raw materials remain severe, largely the result of high energy costs. The prices paid index for April came in at 82.9, down 1 point in the month but still indicating that the vast majority of respondents are reporting month-to-month increases in costs.
NAPM-Chicago Consensus Forecast for May 08: 48.5
Range: 47.2 to 51.4
The Reuter's/University of Michigan's Consumer sentiment index hit a 28 year low in the preliminary report for May, dropping from 62.6 in April 59.5. Weakness was centered in the current conditions component which sank more than 6 points to 71.7. The expectations component slipped 1.6 points to 51.7, a low last seen in 1979. But of serious concern to Fed officials are inflation expectations, which spiked 4 tenths to 5.2 percent for the one-year outlook. The latest reading indicates that inflation expectations are starting to come unmoored – something that Fed officials indicate could make bringing inflation down difficult.
Consumer sentiment Consensus Forecast for final May 08: 59.5
Range: 58.5 to 61.2
|

