|
This past week oil prices continued to rocket to new record highs which, in turn, weighed on equities. There was not much economic data but most of those released pointed toward continuing weakness in the consumer sector. Much of the action in many markets focused on record highs again being set for crude oil prices.
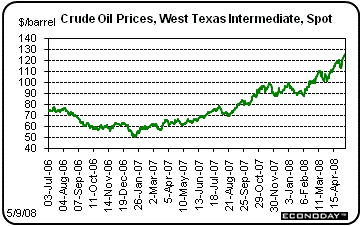 Indeed, oil took center stage this past week, settling at a record high of $125.96 per barrel for West Texas Intermediate spot on Friday. While a new record high was set every day last week, the big jump was on Monday with prices bumped up $3.65 per barrel by a weekend attack by militants on Nigerian oil facilities. Comments from an Iranian official that the country would not give up its nuclear program added to upward pressure. Furthermore, a better-than-expected ISM non-manufacturing was seen to show the U.S. economy as healthier than believed. Prices were boosted again on Tuesday by a forecast for higher oil prices by the Energy Department and by comments from a Goldman Sachs analyst that oil could hit $150 to $200 per barrel within two years. Indeed, oil took center stage this past week, settling at a record high of $125.96 per barrel for West Texas Intermediate spot on Friday. While a new record high was set every day last week, the big jump was on Monday with prices bumped up $3.65 per barrel by a weekend attack by militants on Nigerian oil facilities. Comments from an Iranian official that the country would not give up its nuclear program added to upward pressure. Furthermore, a better-than-expected ISM non-manufacturing was seen to show the U.S. economy as healthier than believed. Prices were boosted again on Tuesday by a forecast for higher oil prices by the Energy Department and by comments from a Goldman Sachs analyst that oil could hit $150 to $200 per barrel within two years.
Prices rose again on Wednesday despite somewhat higher inventories than expected. Supply was seen as tight heading into the summer driving season. Additionally, an earthquake off the coast of Japan raised fears that country might have to shut down some nuclear plants for safety reasons and burn fuel oil to generate electricity. Oil was almost unchanged on Thursday, rising only a few cents per barrel. But prices heated up again on Friday with intraday trading topping $126 per barrel. Prices were bumped up by a lower dollar, which made oil an attractive commodity for those holding euros. The euro had strengthened on the increased belief that the European Central Bank would not be cutting interest rates in order to fight inflation.
Net for the week, the spot price for West Texas Intermediate jumped a whopping $9.64 per barrel to $125.96 per barrel.
 This past week, equities were pulled down primarily by higher oil prices, which raised greater concern for oil refiners, airlines, the consumer sector, and the profit outlook overall. Stocks were down net for the week for the first time following three consecutive weekly gains. This past week, equities were pulled down primarily by higher oil prices, which raised greater concern for oil refiners, airlines, the consumer sector, and the profit outlook overall. Stocks were down net for the week for the first time following three consecutive weekly gains.
The week started on the wrong foot as crude oil closed in on a record $120 per barrel. The higher oil prices were a concern across the board but notably weighed on chain stores with Macy’s leading the way down. Techs were pulled down by the collapse of acquisition talks regarding Microsoft’s hoped for takeover of Yahoo! Another big mover was GM, which fell notably after the start of a strike at its Chevy Malibu plant in Kansas. Stocks rebounded Tuesday despite oil topping $122 per barrel. Essentially, market sentiment was positive for almost no apparent reason. Investors did jump back in Yahoo! stock, believing that Microsoft eventually will come back with another offer. Additionally, Fannie Mae led financials up after regulators said they would ease restrictions on Fannie Mae’s capital after it boosts new funding.
The biggest drop of the week was on Wednesday as crude oil prices topped $123 per barrel. The fear was that consumers will be even more budget strapped. But a number of other factors came into play. A spike in consumer credit was reported during the day and also fueled concern that consumers are tapped out and are using credit cards to fill the gas tank and to buy groceries. The jump in oil prices notably weighed on transports with United Parcel Service leading the way down. An announcement by the Securities and Exchange Commission that brokerage firms would have to disclose capital and liquidity levels dropped stocks of brokerage firms. Also, a further decline in pending home sales pulled homebuilder stocks down.
Thursday was an up day with market optimism boosted by better-than expected sales by retailers, notably Wal-Mart and Costco. But another record high for oil prices on Friday led most equities down for the day and week as crude topped $126 per barrel on intraday trading. Financials also were hard hit by the after close announcement on Thursday of losses by insurer AIG.
Last week, major indexes were down as follows: the Dow, down 2.4 percent; the S&P 500, down 1.8 percent; the Nasdaq, down 1.3 percent; and the Russell 2000, down 0.8 percent.
For the year-to-date, major indexes are still down from year end as follows: the Dow, down 3.9 percent; the S&P 500, down 5.5 percent; the Nasdaq, down 7.8 percent; and the Russell 2000, down 6.0 percent.

Weekly percent change column reflects percent changes for all components except interest rates. Interest rate changes are reflected in simple differences.
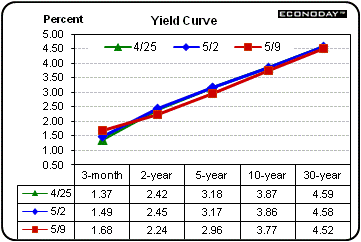 Treasury rates were down slightly last week except for a modest rise in the 3-month T-bill rate. The story last week was mostly about flight to quality as record oil prices were set each day of the week, creating fears of worsening an economic downturn due to the impact on the consumer and on costs in general for companies. The limited economic data of last week had little impact, being overwhelmed by the effects of higher oil prices. Flight to quality was seen in better-than-expected 10-year and 30-year auctions last week. But rates dipped the most for the mid-range maturities. Treasury rates were down slightly last week except for a modest rise in the 3-month T-bill rate. The story last week was mostly about flight to quality as record oil prices were set each day of the week, creating fears of worsening an economic downturn due to the impact on the consumer and on costs in general for companies. The limited economic data of last week had little impact, being overwhelmed by the effects of higher oil prices. Flight to quality was seen in better-than-expected 10-year and 30-year auctions last week. But rates dipped the most for the mid-range maturities.

On the week rates were as follows: 3-month T-bill, up 19 basis points, the 2-year note, down 21 basis points; the 5-year note, down 21 basis points; the 10-year bond, down 9 basis points; and the 30-year bond, down 6 basis points.
Nonetheless, long rates have been slowly firming over the last several weeks over rising inflation concerns while the bump up in short rates reflects an increasing belief that the Fed cannot cut rates further.
This past week the only market moving indicator was monthly international trade, which narrowed more sharply than expected. But the details in this report and others indicate that the economy remains flat with the consumer sector notably sluggish.
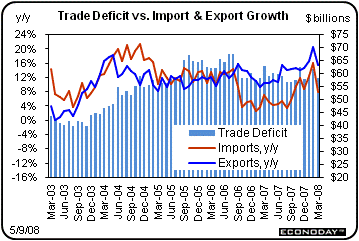 The headline for this report is that the U.S. trade gap shrank sharply. But details in the report indicate that the consumer sector is weak. Although exports also slipped, there are reasons to believe that the general uptrend will continue. The headline for this report is that the U.S. trade gap shrank sharply. But details in the report indicate that the consumer sector is weak. Although exports also slipped, there are reasons to believe that the general uptrend will continue.
The overall U.S. trade gap narrowed in March to $58.2 billion from a revised $61.7 billion deficit in February. In March, exports slipped 1.7 percent while imports dropped 2.9 percent. The dip in exports was broad-based but led by the volatile capital goods component with swings typically reflecting changes in when aircraft are shipped. A rebound in exports in April is likely based on this component detail and a continued weak dollar. The drop in imports was led by autos and industrial supplies with capital goods and consumer goods also showing sizeable declines.
Both the oil and the nonoil gap grew smaller. The oil trade gap shrank to $35.2 billion from $37.4 billion the month before while the nonoil deficit narrowed to $36.1 billion in March from $37.3 billion in February. The oil gap narrowed despite the price of oil rising to $89.85 per barrel in March from $84.76 per barrel the month before.
Where do the latest numbers fit in for GDP' The March drop in the trade gap should narrow the net exports deficit within first quarter GDP but there are likely some offsetting effects, too. We will likely see lower estimates for expenditures on producers durable equipment due to the drop in imports of capital goods. Also, the overall drop in imports will likely help lower inventories on business shelves. But looking ahead, the drop in imports suggests that businesses are recognizing that the economy is weak. Imports will likely remain sluggish along with the rest of the U.S. economy.
Year-on-year, overall exports were up 15.5 percent in March after 20.6 percent in February while imports were up 7.1 percent, following being up 16.4 percent in February.
 First quarter productivity and labor costs came in better than expected. There is good news and bad news in the numbers. The good news is that the Fed will see the numbers as supporting an easing in inflation down the road. The bad news is that the improvement was due to the effects of a weak economy, notably pointing toward a softening in the consumer sector. First quarter productivity and labor costs came in better than expected. There is good news and bad news in the numbers. The good news is that the Fed will see the numbers as supporting an easing in inflation down the road. The bad news is that the improvement was due to the effects of a weak economy, notably pointing toward a softening in the consumer sector.
First quarter productivity improved to an annualized 2.2 percent increase, following a 1.8 percent gain in the fourth quarter. Unit labor costs moderated with a 2.2 percent annualized increase, following a 2.8 percent gain in the fourth quarter. But the improvement in productivity and labor costs was directly tied to hours worked, which fell an annualized 1.8 percent, following a 1.6 percent drop in the fourth quarter. Worker hours dropped as businesses cut back due to softer demand for their products. This drop in hours eventually will translate into slower income growth for the consumer.
While hours worked fell, compensation per hour only moderated slightly with a 4.4 percent annualized boost in the first quarter, following a 4.6 percent boost the prior quarter. Compensation is a “unit” measure (per hour) rather than an aggregate measure (such as for total earnings).
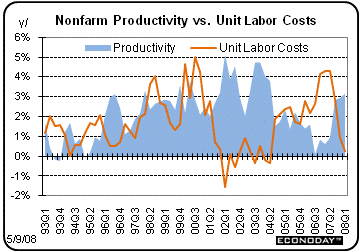 Overall, the first quarter productivity report was favorable toward an improvement in inflation down the road if these trends continue. But the report also suggests sluggishness in aggregate earnings for consumers since hours worked have been slipping. But this is the scenario that the Fed has envisioned and the Fed for now appears to be on track for its forecasts of sluggish growth, productivity gains, and hopefully improvement in inflation.
Year-on-year, productivity was up 3.2 percent in the first quarter, compared to up 2.9 percent the previous quarter. Year-on-year, unit labor costs in the first quarter stood at up 0.2 percent, down from up 0.9 percent in the prior quarter. Year-on-year, compensation per hour in the first quarter was up 3.4 percent, compared to up 3.9 percent in the fourth quarter.
 The latest non-manufacturing report from the Institute For Supply Management indicates that the U.S. economy is holding steady rather than worsening. In April, the headline composite index rose 2.4 points to 52.0, ending three straight months in negative territory. The business activity index, equivalent to a production index, slipped more than 1 point to 50.9 but remained slightly positive. New orders slipped 1 tenth to 50.1 with backlogs up 2.5 points to the break-even 50 level. In sum, key indicators were just above 50, suggesting that non-manufacturing is remaining steady. The latest non-manufacturing report from the Institute For Supply Management indicates that the U.S. economy is holding steady rather than worsening. In April, the headline composite index rose 2.4 points to 52.0, ending three straight months in negative territory. The business activity index, equivalent to a production index, slipped more than 1 point to 50.9 but remained slightly positive. New orders slipped 1 tenth to 50.1 with backlogs up 2.5 points to the break-even 50 level. In sum, key indicators were just above 50, suggesting that non-manufacturing is remaining steady.
But higher oil and other commodity prices continue to boost inflation measures. The prices paid index rose more than 1 point to 72.1 to indicate severe pressure.
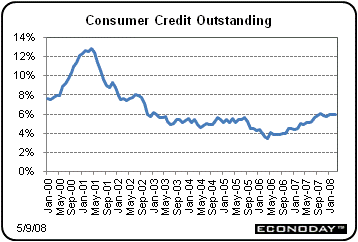 With rising gasoline and food prices and sluggish real income growth, consumers may be resorting to credit cards more and more just to meet daily needs. Consumers borrowed heavily in March as consumer credit outstanding rose $15.3 billion, split between $6.3 billion for revolving credit and $9.0 billion for non-revolving credit. The rise in non-revolving credit is steep and reflects a spurt in auto financing but is certain to slow in April given the month's unusually weak vehicle sales. The gain in revolving credit is the largest gain since November and suggests that fuel payments and grocery payments are stacking up on credit cards. Revolving credit rose at an annual rate of 6.7 percent in the first quarter, down from an even higher 8.6 percent in the fourth quarter. While keeping spending up currently, the boost in credit card use may haunt the consumer sector in coming months as required monthly credit payments rise and crimp discretionary income. High interest rates on credit cards, which have not come down despite Federal Reserve rate cuts, also point to rising credit burdens in future months. With rising gasoline and food prices and sluggish real income growth, consumers may be resorting to credit cards more and more just to meet daily needs. Consumers borrowed heavily in March as consumer credit outstanding rose $15.3 billion, split between $6.3 billion for revolving credit and $9.0 billion for non-revolving credit. The rise in non-revolving credit is steep and reflects a spurt in auto financing but is certain to slow in April given the month's unusually weak vehicle sales. The gain in revolving credit is the largest gain since November and suggests that fuel payments and grocery payments are stacking up on credit cards. Revolving credit rose at an annual rate of 6.7 percent in the first quarter, down from an even higher 8.6 percent in the fourth quarter. While keeping spending up currently, the boost in credit card use may haunt the consumer sector in coming months as required monthly credit payments rise and crimp discretionary income. High interest rates on credit cards, which have not come down despite Federal Reserve rate cuts, also point to rising credit burdens in future months.
While the unexpected improvement in the international trade deficit and in productivity is good, the further signs of weakening in the consumer sector are not. Imports of consumer goods retrenched and the gain in productivity was based on a drop in worker hours. Also, the March jump in revolving credit (credit card debt) is disconcerting. While this past week saw minimal economic reports, they generally point to a weak consumer sector and flat economy – at least for coming months.
This coming week has some of the marquee economic indicators being posted. Retail sales for April are out on Tuesday; the consumer price index gives us an update on the inflation picture on Wednesday; we get an update on the manufacturing sector with the industrial production release on Thursday; and on Friday we get a key check on the pulse of the housing sector with the housing starts report.
The U.S. Treasury monthly budget report showed a deficit of $48.1 billion for March. Looking ahead, the month of April typically shows a moderate surplus for the month. However, we are likely to see a larger-than-average bump up in the surplus that typically occurs in April when income tax returns are due. The tax rebate program probably encouraged more filers to mail in their returns on time and this should boost the surplus for April. Over the last ten years, the April surplus has averaged $107.7 billion.
Treasury Statement Consensus Forecast for April 08: +$160.0 billion
Range: +$120.0 billion to +$170.0 billion.
Retail sales in March surprised the markets on the upside but strength was mostly in the essentials, including higher priced gasoline. Retail sales rebounded a partial 0.2 percent in March, following a 0.4 percent fall in February. Excluding motor vehicles, retail sales ticked back up 0.1 percent after declining 0.1 percent the month before. When excluding both motor vehicles and gasoline, sales were flat, after losing 0.1 percent in February. More recent data have been mixed on the strength of consumer spending. Domestic motor vehicle sales in April fell to a 10.5 million unit annualized pace from 11.0 million the month before. However, some retailers have reported modest improvement in year-ago sales for April but it is not yet a widespread trend. Once again, one should watch to see if higher gasoline prices boost nominal retail sales but cut into other categories because of less money left over for the consumer after filling the gas tank.
Retail sales Consensus Forecast for April 08: -0.1 percent
Range: -0.7 to +0.3 percent
Retail sales excluding motor vehicles Consensus Forecast for April 08: +0.3 percent
Range: -0.4 to +0.6 percent
Import prices increasingly are fueling U.S inflation from both higher oil prices and a weaker dollar. The import price index surged 2.8 percent in March, pushing the year-on-year rate to 14.8 percent and its worst level in more than 25 years. And it was not just oil prices as non-petroleum import prices up a record 1.1 percent. The year-on-year rate for the non-petroleum category is up 5.4 percent - the worst reading since the mid 1990s. Petroleum import prices jumped 9.1 percent in the month, more than reversing a 1.9 percent decline in February. Due to the continued rise in oil prices and a continued weak dollar, import prices are likely to be on the high side in April.
Import prices Consensus Forecast for April 08: +1.7 percent
Range: -0.2 to +2.0 percent
Business inventories jumped 0.6 percent in February. This unwanted gain combined with a 1.1 percent decline in total sales and pushed the stock-to-sales ratio up to 1.28 from January's 1.26. Unless businesses slow the growth in inventories, there will likely be a notable inventory correction, paid in part by U.S. manufacturers. The overhang is not yet substantial but it could be headed there. More recently, manufacturers’ inventories posted a 0.9 percent surge in March after rising 0.7 percent the month before. Fortunately, a notable share of the durables gain was either export related or defense related. For nondurables, much was price related with oil and grain commodities behind part of the boost.
Business inventories Consensus Forecast for March 08: +0.5 percent
Range: +0.2 to +0.8 percent
The consumer price index may be back on an upward track after some brief improvement earlier this year. The March CPI rose 0.3 percent, after no change in February. The core rate also firmed after a flat reading the month before. The latest gain in the headline CPI was led by energy components, including gasoline and heating oil. The trend in headline inflation clearly is worrisome for the Fed despite the recent string of interest rate cuts. On a year-on-year basis, the overall CPI came in at up 4.0 percent in March. Higher gasoline prices, food prices, and air fares will likely lead the way for another sizeable gain in headline CPI inflation.
CPI Consensus Forecast for April 08: +0.3 percent
Range: +0.1 to +0.4 percent
CPI ex food & energy Consensus Forecast for April 08: +0.2 percent
Range: +0.1 to +0.4 percent
Initial jobless claims swung back lower in the week ending May, falling 18,000 to 365,000 but still indicate a soft labor market. Week-to-week data have been very choppy since March, making the four-week average a more important reading and the average came in right at the level of the latest week, at 367,000 for a 2,500 week-to-week rise. The latest four-week average is still well above the cycle low of about 285,000 in 2006 but still well below the 2001 recession peak of about 490,000.
Jobless Claims Consensus Forecast for 5/10/08: 370,000
Range: 360,000 to 380,000
The April Empire State manufacturing index indicated that manufacturing may be stabilizing in the New York State area. The general business conditions index improved to 0.6 in April from a severe contraction reading of minus 22.2 in March. Also, shipments soared to 17.5 from minus 5.2 in March with new orders stabilizing, at zero versus minus 4.7 the prior month. While output and the outlook for production stabilized, inflation numbers did not. Input prices jumped another 7 points to 57.3 in April with greater pressure appearing for final goods which jumped 5 points to 20.8.
Empire State Manufacturing Survey Consensus Forecast for May 08: 0.00
Range: -10.00 to 5.00
Industrial production appeared to stabilize in March but this sector is likely to lose ground in April. With help from utilities and mining, overall industrial production rebounded 0.3 percent in March, following a 0.7 percent drop the prior month. But the manufacturing component was not as strong with only a modest 0.1 percent rise in the latest month. March strength was in utilities and in mining which jumped 1.9 and 0.9 percent, respectively. More recently, the latest employment report showed a 1.2 percent drop in aggregate hours for manufacturing, which strongly suggests a drop in manufacturing output for the month.
Industrial production Consensus Forecast for April: -0.3 percent
Range: -0.7 to +0.2 percent
Capacity utilization Consensus Forecast for April 08: 80.1 percent
Range: 79.8 to 80.4 percent
The general business conditions component of the Philadelphia Fed's business outlook survey index showed alarming weakness in April as the headline business activity index fell to minus 24.9 from minus 17.4 in March. The new orders index suggests that this weakness is going to carry forward into May as it worsened to minus 18.8 in April from minus 9.3 in March.
Philadelphia Fed survey Consensus Forecast for May 08: -20.0
Range: -28.0 to -14.1
Housing starts have yet to show any sustained sign of improvement and overall conditions in this sector give little reason to expect anything other than depressed levels of activity for some time. Starts plunged 11.9 percent in March for a year-on-year decrease of 36.5 percent, a rate exceeded only twice during the current contraction for the third worst rate since the 1991 recession. Permits, which are forward looking, fell 5.8 percent in the month for a 40.9 percent year-on-year decrease for the worst rate since 1991. A tight credit market, a weak jobs market, and bloated supply of unsold homes continue to depress the housing sector with no sign yet of improvement.
Housing starts Consensus Forecast for April 08: 0.940 million-unit rate
Range: 0.890 million to 0.985 million-unit rate
The Reuter's/University of Michigan's Consumer sentiment index in April came in at its lowest point since the early 1980s, falling to 62.6 from a reading of 69.5 in March. Weakness was led by the current conditions index while the expectations component also slipped. The high cost of gasoline, milk, and bread is very much on consumers’ minds as inflation expectations have been edging up. One year out inflation expectations rose to 4.8 percent in April, up 5 tenths from March.
Consumer sentiment Consensus Forecast for preliminary May 08: 62.5
Range: 60.0 to 66.4
|

