|
Global economic data continue to outperform expectations, a trend that keeps policy bias toward tightening and pushes back any prospect for now of lower interest rates. Underscoring this trend was another strong retail sales from the US, results that Federal Reserve Jerome Powell cited in his comments to the Economic Club of New York. Saying “economic growth has consistently surprised to the upside this year,” Powell’s comments confirm that Fed policy remains hawkish. Yet with the Fed still patient to wait for the effects of prior tightening to take hold. a resumption of rate hikes at the Fed’s approaching meeting is uncertain. The Bank of Korea, back in the summer of 2021, was the first major central bank to begin tightening this cycle but has since kept rates steady so far this year.
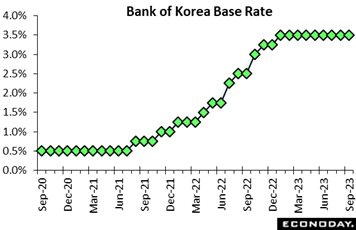 The Bank of Korea left its main policy rate unchanged at 3.50 percent, in line with the consensus forecast. Officials have now left this rate on hold for six consecutive meetings after increasing it by a cumulative 275 basis points since late 2021, as part of efforts to return headline inflation to its target level of two percent. The Bank of Korea left its main policy rate unchanged at 3.50 percent, in line with the consensus forecast. Officials have now left this rate on hold for six consecutive meetings after increasing it by a cumulative 275 basis points since late 2021, as part of efforts to return headline inflation to its target level of two percent.
Since the previous BoK meeting in late August, data have shown headline inflation rising from 2.3 percent in July to 3.4 percent in August and 3.7 percent in September. Core CPI inflation, however, has been steady at 3.3 percent over that period. In the statement accompanying the bank’s decision, however, officials noted that the recent increase in headline inflation largely reflects higher energy and food prices and advised that they expect it to fall over the rest of the year and in 2024. Nevertheless, they noted that upside risks to the inflation outlook have increased in response to the recent increase in global oil prices and currency depreciation.
The statement also noted that "domestic economic growth has continued to improve at a modest pace" in response to better export performance. Officials also expect further improvement but noted uncertainties associated with geopolitical risks and the continuation of restrictive policy stances in major economies.
Reflecting their uncertainty about the outlook for both inflation and growth, officials concluded that it remains appropriate to leave policy rates on hold and that their policy stance should remain "restrictive" for "a considerable time". The impact of external risks on domestic inflation and growth will likely be the major focus for policy decisions in coming months.
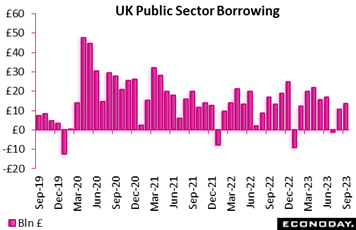 UK’s public finances deteriorated in September but by less than expected. Overall public sector net borrowing (PSNB) was £13.53 billion, up from August's £10.58 billion but nearly £5 billion less than the market consensus. It was also well short of the £15.08 billion posted a year ago. Excluding public sector banks (PSNB-X), the deficit stood at £14.35 billion versus £11.40 billion in August and £15.90 billion in September 2022. This was the sixth highest September borrowing since monthly records began in 1993. UK’s public finances deteriorated in September but by less than expected. Overall public sector net borrowing (PSNB) was £13.53 billion, up from August's £10.58 billion but nearly £5 billion less than the market consensus. It was also well short of the £15.08 billion posted a year ago. Excluding public sector banks (PSNB-X), the deficit stood at £14.35 billion versus £11.40 billion in August and £15.90 billion in September 2022. This was the sixth highest September borrowing since monthly records began in 1993.
The interest payable on central government debt was only £0.7 billion, some £7.2 billion less than in September 2022 and the third lowest on record. The drop was largely because of a sharp fall in debt service on index-linked gilts.
At £81.7 billion, the PSNB-X over the financial year to date was £15.3 billion larger than over the same period in FY2022/23 but still easily less than the £101.5 billion forecast made by the Office for Budget Responsibility (OBR) in March. Even so, public sector net debt (PSND-X) was £2.599 trillion or around 97.8 percent of UK GDP. This was 2.1 percentage points higher than in September 2022 and sustains levels last seen in the early 1960s.
September's update suggests that the government will have some wiggle room on spending ahead of the next general election but not much. Major fiscal giveaways remain unlikely.
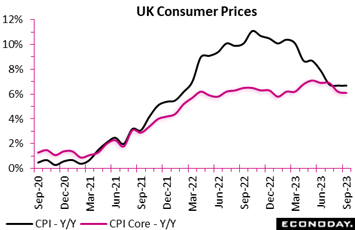 UK inflation was stronger than expected in September. A 0.5 percent monthly rise in prices was a tick higher than Econoday’s consensus and large enough to hold the annual inflation rate steady at August's 6.7 percent. This was still 4.4 percentage points below last October's 11.1 percent peak but also fully 4.7 percentage points above the Bank of England’s medium-term target. The yearly rate matches its lowest mark since February 2022. UK inflation was stronger than expected in September. A 0.5 percent monthly rise in prices was a tick higher than Econoday’s consensus and large enough to hold the annual inflation rate steady at August's 6.7 percent. This was still 4.4 percentage points below last October's 11.1 percent peak but also fully 4.7 percentage points above the Bank of England’s medium-term target. The yearly rate matches its lowest mark since February 2022.
However, core prices were slightly better behaved with a 0.5 percent monthly gain that trimmed the annual underlying rate from 6.2 percent to 6.1 percent, its weakest print since January.
The main downward contribution to the change in the annual headline rate again came from food and non-alcoholic drink where prices fell 0.2 percent on the month, their first drop since September 2021, versus a 1.1 percent spike in in the same period in 2022. Furniture and household goods (0.1 percent after 1.5 percent) also had a sizeable negative impact. However, there were offsetting rises in alcohol and tobacco (0.9 percent after 0.4 percent), education (1.8 percent after 0.8 percent) and restaurants and hotels (0.8 percent after 0.6 percent). Overall goods inflation dipped from 6.3 percent to 6.1 percent but the rate in services edged up from 6.8 percent to 6.9 percent.
September’s CPI update will probably not go down well with the BoE's hawks. The deceleration in the core rate will be welcome but the uptick in services will be a worry and the flat headline rate leaves an unacceptably large overshoot versus the 2 percent target. November's vote could again be very close.
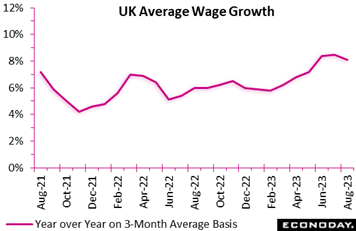 Wage growth in the UK slowed in the three months to August, and by slightly more than expected. At 8.1 percent, the annual headline rate was down from 8.5 percent, making for the first deceleration since February and a 3-month low. However, it remains historically very high. Moreover, regular earnings held up rather better, dipping just a tenth to 7.8 percent but still just a tick below the record high. Wage growth in the UK slowed in the three months to August, and by slightly more than expected. At 8.1 percent, the annual headline rate was down from 8.5 percent, making for the first deceleration since February and a 3-month low. However, it remains historically very high. Moreover, regular earnings held up rather better, dipping just a tenth to 7.8 percent but still just a tick below the record high.
August’s update will boost hopes that a loosening labour market is now beginning to apply some downside pressure on wage deals which can only be good news for getting inflation back to target. The result increases the chances of a steady vote at next month's Bank of England meeting.
Note that remaining labour market data, including claimant count and the claimant and ILO unemployment rates, were delayed due to lack of responses and have been re-scheduled for release on October 24.
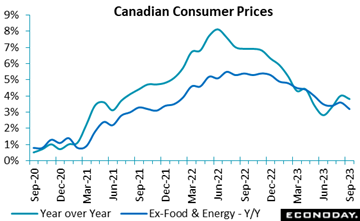 Consumer prices in Canada unexpectedly contracted in September, edging down 0.1 percent on the month and bringing down the 12-month rate to 3.8 percent from 4.0 percent, both below Econoday's consensus estimates of 0.3 percent and 4.1 percent. Excluding food and energy, prices were also down 0.1 percent on the month, and increased 3.2 percent from a year earlier. Consumer prices in Canada unexpectedly contracted in September, edging down 0.1 percent on the month and bringing down the 12-month rate to 3.8 percent from 4.0 percent, both below Econoday's consensus estimates of 0.3 percent and 4.1 percent. Excluding food and energy, prices were also down 0.1 percent on the month, and increased 3.2 percent from a year earlier.
Adding to the good news for the Bank of Canada, its own core measures all reflected easing inflationary pressures in September, with the average 12-month rate coming down to 4.0 percent in September from 4.3 percent in August.
Nevertheless, the 12-month CPI rate averaged 3.7 percent in the third quarter, up from 3.5 percent in the second quarter and above the 3.3 percent projected by the Bank of Canada in its July monetary policy report. Looking ahead, the third quarter business outlook survey also released in the week showed firms still planning "larger and more frequent price increases" than prior to the pandemic. The consumer expectations sister survey showed "persistently high" inflation expectations for the next 12 months.
Goods prices fell 0.3 percent on the month, for a 12-month increase of 3.6 percent, while services were flat, leading to a year-over-year rate of 3.9 percent.
A 14.6 percent drop in air transportation and a 1.3 percent decrease in gasoline prices were the main contributors to lower monthly prices. On a 12-month basis, telephone services, natural gas and air transportation were the top three downward contributors.
On the upside, mortgage interest costs, up 2.6 percent on the month and 30.6 percent year-over-year, were the main upward contributors to both the monthly and 12-month CPI. The second largest upward contributor was rent, up 0.8 percent on the month and 7.3 percent from a year earlier.
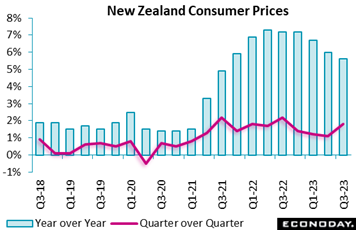 New Zealand consumer prices rose 5.6 percent on the year in the three months to September, down from 6.0 percent in the three months to June and also below the consensus forecast for an increase of 5.9 percent. Headline inflation has now been above the Reserve Bank of New Zealand's target range of one percent to three percent for ten consecutive quarters but is at its lowest level since late 2021. The index advanced 1.8 percent on the quarter after increasing 1.1 previously, just below the consensus forecast of 1.9 percent. New Zealand consumer prices rose 5.6 percent on the year in the three months to September, down from 6.0 percent in the three months to June and also below the consensus forecast for an increase of 5.9 percent. Headline inflation has now been above the Reserve Bank of New Zealand's target range of one percent to three percent for ten consecutive quarters but is at its lowest level since late 2021. The index advanced 1.8 percent on the quarter after increasing 1.1 previously, just below the consensus forecast of 1.9 percent.
The fall in headline inflation reflects smaller increases in food prices, housing costs, and household goods prices, partly offset by a sharp rebound in transport costs and a bigger increase in household energy prices. Petrol prices rose 16.5 percent on the year after a previous decline of 15.0 percent, largely reflecting the expiration of a temporary reduction in fuel taxes.
At the RBNZ's latest policy meeting, held earlier in the month, officials left policy rates on hold at 5.50 percent after having increased them by 525 basis points since late 2021. Officials still expected inflation would decline back to the target range in the second half of 2024, but the statement accompanying their decision highlighted the risk that price pressures would not slow as much as expected. The decision to keep rates on hold suggests officials remain confident for now that current policy settings are sufficiently restrictive to return inflation to their target range but it also appears that they retain a bias to tighten further if inflation does not fall as quickly as they anticipate.
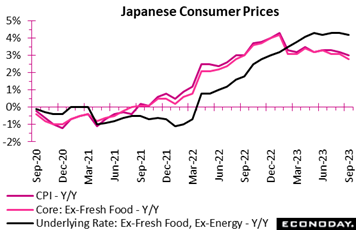 Consumer inflation in Japan eased in all three key measures in September as energy subsidies continued to push down electricity and natural gas utility costs and markups in processed food prices are showing signs of peaking. The core measure (excluding fresh food prices), which is closely watched by Bank of Japan policymakers, indicated clear cooling, with its year-over-year rise declining to a 13-month low of 2.8 percent in September from 3.1 percent in August. The prices for food excluding perishables were 8.8 percent above year-earlier levels, down from 9.2 percent in August. Consumer inflation in Japan eased in all three key measures in September as energy subsidies continued to push down electricity and natural gas utility costs and markups in processed food prices are showing signs of peaking. The core measure (excluding fresh food prices), which is closely watched by Bank of Japan policymakers, indicated clear cooling, with its year-over-year rise declining to a 13-month low of 2.8 percent in September from 3.1 percent in August. The prices for food excluding perishables were 8.8 percent above year-earlier levels, down from 9.2 percent in August.
Underlying inflation measured by the core-core CPI (excluding fresh food and energy) moderated to 4.2 percent from a 42-year high of 4.3 percent seen in August, July and May while the total CPI's annual rate also eased to a 12-month low of 3.0 percent from 3.2 percent.
Service prices in Japan have been on the rise in recent months as more firms are raising wages to secure workers, although average cash earnings per employee are still below year-earlier levels after adjusted for inflation. Service prices excluding owners' equivalent rent rose 2.9 percent on the year in September, little changed from 3.0 percent in August and 2.9 percent in July. Goods prices excluding fresh food gained 3.5 percent, showing a clear slowdown from 4.1 percent the previous month.
The BoJ will update its medium-term economic projections and risk analysis in its quarterly outlook report due on Oct. 31 after its two-day policy meeting. The BoJ board may revise up its median forecast for consumer inflation for fiscal 2023 ending next March closer to 3 percent from 2.5 percent projected in July and 1.8 percent in April while making little change to 1.9 percent forecast for fiscal 2024 and 1.6 percent for fiscal 2025.
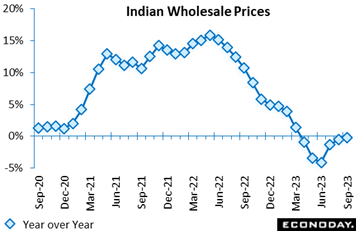 India's wholesale price index fell 0.26 percent on the year in September, after falling 0.52 percent in August. This is the sixth consecutive month of deflation in producer prices. Consumer price data for September published in the prior week showed a fall in headline inflation from 6.83 percent in August to 5.02 percent in September, back within the Reserve Bank of India's target range of two percent to six percent after a spike in food prices had pushed it above that range in the two previous months. India's wholesale price index fell 0.26 percent on the year in September, after falling 0.52 percent in August. This is the sixth consecutive month of deflation in producer prices. Consumer price data for September published in the prior week showed a fall in headline inflation from 6.83 percent in August to 5.02 percent in September, back within the Reserve Bank of India's target range of two percent to six percent after a spike in food prices had pushed it above that range in the two previous months.
The smaller year-over-year decline in wholesale prices in September was driven by smaller declines in manufacturing and fuel prices. Manufacturing prices, which account for around 64 percent of the index, fell 1.34 percent on the year after a previous decline of 2.37 percent, while fuel prices, around 13 percent of the index, fell 3.34 percent after dropping 6.03 percent previously. Food prices, which account for around 15 percent of the index, rose 1.54 percent on the year, slowing sharply from a previous increase of 5.62 percent.
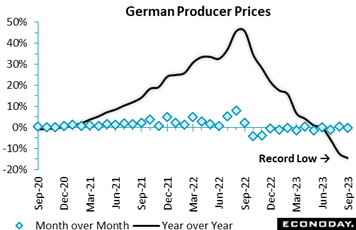 Producer prices in Germany fell 0.2 percent on the month in September. This was much weaker than the market consensus and the fourth drop in the last five months. It was also sharp enough to reduce the annual inflation rate from minus 12.6 percent to minus 14.7 percent, yet another record low. Producer prices in Germany fell 0.2 percent on the month in September. This was much weaker than the market consensus and the fourth drop in the last five months. It was also sharp enough to reduce the annual inflation rate from minus 12.6 percent to minus 14.7 percent, yet another record low.
Energy prices decreased 0.4 percent versus August but even excluding this category the PPI fell dipped 0.1 percent, trimming the yearly core rate from 1.2 percent to just 0.8 percent. Elsewhere, capital goods edged 0.1 percent higher on the month but consumer durables were down 0.1 percent, intermediates 0.2 percent and non-durable consumer goods 0.3 percent.
Another decline in core producer prices reinforces the clear downward trend in underlying pipeline inflation pressures in German manufacturing. It also provides further evidence of the weakness of the sector as a whole.
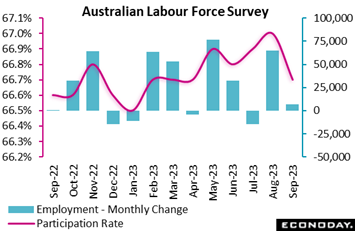 Australian labour market data for September showed a weaker-than-expected increase in employment, a small increase in the unemployment rate, and a drop in participation. Conditions in the labour market have been volatile since the Reserve Bank of Australia began a pause in policy tightening four months ago, but they remain relatively tight and will likely keep officials' focus on upside risks to the inflation outlook. Australian labour market data for September showed a weaker-than-expected increase in employment, a small increase in the unemployment rate, and a drop in participation. Conditions in the labour market have been volatile since the Reserve Bank of Australia began a pause in policy tightening four months ago, but they remain relatively tight and will likely keep officials' focus on upside risks to the inflation outlook.
The number of employed persons in Australia rose by 6,700 in September after increasing by 64,900 in August, well below the consensus forecast for an increase of 20,000. Full-time employment fell by 39,900 after increasing by 2,800, while part-time employment rose by 46,500 after increasing by 62,100 previously. Hours worked fell 0.4 percent on the month after falling 0.5 percent previously.
September’s unemployment rate fell from 3.7 percent in August to 3.6 percent in September, just below the consensus forecast of 3.7 percent. The participation rate fell from 67.0 percent to 66.7 percent.
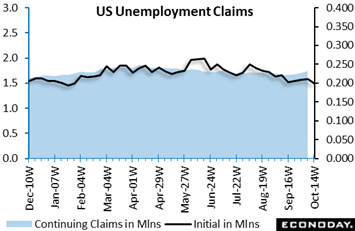 New filings for unemployment benefits in the US, down 13,000 to 198,000 in the October 14 week, have been exceptionally low for the past month. If the labor market is cooler in terms of job openings and hiring, businesses are avoiding laying off skilled workers wherever possible. New filings for unemployment benefits in the US, down 13,000 to 198,000 in the October 14 week, have been exceptionally low for the past month. If the labor market is cooler in terms of job openings and hiring, businesses are avoiding laying off skilled workers wherever possible.
Continuing claims in lagging data for the October 7 week rose 29,000 to 1.734 million, an increase that may reflect a mismatch in seasonal adjustment factors as unadjusted insured jobless claims fell 6,466 in the week to 1.549 million. The underlying trend for insured claims is fairly stable as unemployed workers find new jobs or time out of benefits. The insured rate of unemployment is unchanged at 1.2 percent which is not materially different than 1.1 percent in the prior five weeks. For those eligible for unemployment benefits, the labor market remains tight.
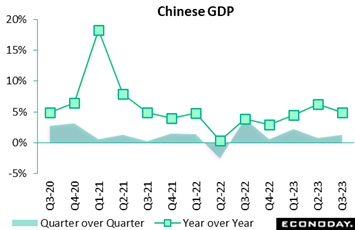 Chinese GDP rose 1.3 percent on the quarter in the three months to September, picking up from the increase of 0.8 percent recorded in the three months to June, with year-over-year growth slowing from 6.3 percent to 4.9 percent which compared with Econoday’s consensus for 4.5 percent. Official PMI survey data over the same period showed stronger conditions in the manufacturing sector but weaker conditions in non-manufacturing. Monthly data also published on Wednesday showed stronger growth in industrial production and retail sales and slightly weaker growth in investment in September. Chinese GDP rose 1.3 percent on the quarter in the three months to September, picking up from the increase of 0.8 percent recorded in the three months to June, with year-over-year growth slowing from 6.3 percent to 4.9 percent which compared with Econoday’s consensus for 4.5 percent. Official PMI survey data over the same period showed stronger conditions in the manufacturing sector but weaker conditions in non-manufacturing. Monthly data also published on Wednesday showed stronger growth in industrial production and retail sales and slightly weaker growth in investment in September.
In a statement accompanying Wednesday’s data, officials described China's economy as having "sustained the momentum of recovery and improvement" with both demand and production increasing. The statement provided little guidance, however, about whether officials consider that further policy support will be required, merely noting that policy is continuing to be implemented "in a precise and robust way" to expand domestic demand and boost confidence. At week’s end the People’s Bank of China, having eased its one-year loan prime rate as recently as August, kept both the one-year and five-year rates unchanged.
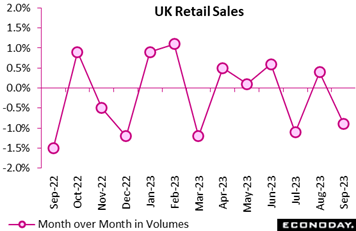 UK retail sales fell for the second time in three months in September. A 0.9 percent monthly slide was much steeper than the market consensus and easily more than enough to reverse August's 0.4 percent gain. Positive base effects ensured that annual growth still rose from minus 1.3 percent to minus 1.0 percent but volumes stood at their lowest level since last December. UK retail sales fell for the second time in three months in September. A 0.9 percent monthly slide was much steeper than the market consensus and easily more than enough to reverse August's 0.4 percent gain. Positive base effects ensured that annual growth still rose from minus 1.3 percent to minus 1.0 percent but volumes stood at their lowest level since last December.
Excluding auto fuel, the picture was much the same with purchases down 1.0 percent versus August and 1.2 percent on the year.
September's monthly setback was largely attributable to the non-food sector where sales declined 1.9 percent, their worst performance so far in 2023. Within this, all of the main subsectors posted losses, notably household goods (minus 2.3 percent) and other stores (minus 2.0 percent). Elsewhere, food edged up a further 0.2 percent and auto fuel increased 0.8 percent but non-store retailing was off 2.2 percent.
The latest data mean that overall volumes fell 0.8 percent over the quarter. This means that the sector subtracted from third quarter GDP growth which is now all the more likely to carry a negative handle. Inflation is key to the BoE's November interest rate decision but the surprising weakness of September’s report boosts the case for those arguing for no change in Bank Rate.
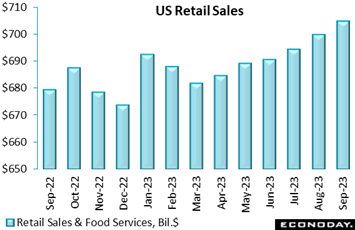 The dollar value of US retail and food services sales rose a higher-than-expected 0.7 percent in September after upward revisions to 0.8 percent in August and 0.6 percent in July. The September reading and the higher numbers for August and July put personal consumption expenditures on a solid footing for third quarter 2023, data to be posted later this month. The accompanying graph tracks retail sales in dollar terms, totaling a seasonally adjusted $704.9 billion in September versus $699.9 billion in August. The dollar value of US retail and food services sales rose a higher-than-expected 0.7 percent in September after upward revisions to 0.8 percent in August and 0.6 percent in July. The September reading and the higher numbers for August and July put personal consumption expenditures on a solid footing for third quarter 2023, data to be posted later this month. The accompanying graph tracks retail sales in dollar terms, totaling a seasonally adjusted $704.9 billion in September versus $699.9 billion in August.
Sales of motor vehicles rose 1.0 percent in September, providing support to the overall number. Sales excluding motor vehicles rose 0.6 percent in September, which was also above expectations.
Sales of gasoline saw price increases in September that boosted the dollar value by 0.9 percent in the month. Nonetheless, sales were strong over all in September. Retail sales excluding gasoline climbed 0.7 percent in September, while sales excluding motor vehicles and gasoline rose 0.6 percent. Details included a 1.1 percent gain for nonstore retailers and a 0.9 percent rise for food services.
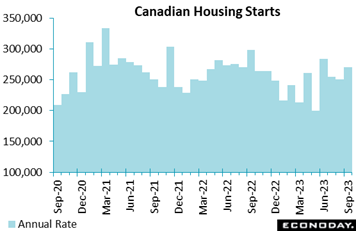 Defying the higher interest rate environment, housing starts in Canada topped expectations in September with an 8 percent rebound to an annual rate of 270,466 after declining 2.4 percent in August. Econoday's consensus was 250,000. The six-month trend increased 3.9 percent to an annual rate of 254,006 after advancing 0.6 percent in August. Defying the higher interest rate environment, housing starts in Canada topped expectations in September with an 8 percent rebound to an annual rate of 270,466 after declining 2.4 percent in August. Econoday's consensus was 250,000. The six-month trend increased 3.9 percent to an annual rate of 254,006 after advancing 0.6 percent in August.
Urban starts increased 9 percent in September to an annual rate of 250,766, led by a 10 percent rebound in multi-unit starts. Single-detached urban starts were up 3 percent. Regionally, Montreal starts surged 98 percent, while Toronto was up 20 percent. Single-detached activity declined 17 percent in Vancouver.
Canada Mortgage and Housing Corporation's chief economist said "it seems the current higher interest rate environment has not yet had the expected negative impact on multi-unit construction activity so far in 2023," not a welcome state for the Bank of Canada. In its minutes of the September meeting, the central bank had pointed out the dampening effect of higher interest rates on home builders "who reported difficulties in funding construction projects." It remains to be seen how the BoC will respond to this latest report.
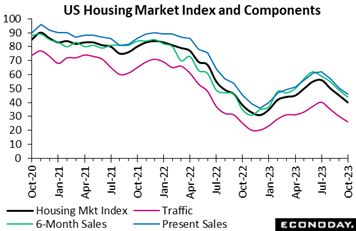 In contrast to Canada, the housing sector in the US is in fact showing the effects of high interest rates. Starts have been swinging wildly in recent reports; they did rebound 7.0 percent in September to a 1.358 million annual rate which nevertheless was much lower than expected following a steep drop in August to 1.260 million. Permits, a leading indicator for starts, declined 4.4 percent to 1.473 million. In contrast to Canada, the housing sector in the US is in fact showing the effects of high interest rates. Starts have been swinging wildly in recent reports; they did rebound 7.0 percent in September to a 1.358 million annual rate which nevertheless was much lower than expected following a steep drop in August to 1.260 million. Permits, a leading indicator for starts, declined 4.4 percent to 1.473 million.
Like Canada, multi-unit starts rose in September to a 0.395 million rate from 0.336 million which, however, are well down from 0.571 million in May before rates stated to climb. Single-family starts climbed to 0.963 million in September versus their May high of 1.012 million.
Anecdotal data from the National Association of Home Builders as tracked in the accompanying graph is very clear: substantial deterioration is underway with their main index falling 5 points to a depressed 40 that was also lower than expected. US mortgage rates continue to climb to multi-decade highs, up 3 basis points in the October 13 week to 7.70 percent as tracked by the Mortgage Bankers Association. High rates together with high home prices are pushing out first-time in the resales market, at 26 percent of total buyers in September for the lowest share on record as tracked by the National Association of Realtors.
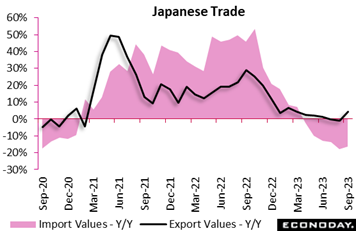 Japan/s trade balance came to an unexpected surplus of ¥62.4 billion in September after a ¥937.8 billion deficit in August. Japanese export values, up 4.3 percent on the year, posted their first year-over-year rise in three months to a record high in September, thanks to solid demand for automobiles from the US and Europe. Shipments to China, one of the key export markets for Japanese goods, posted their 10th straight year-over-year decline in September, led by declines in semiconductors and food, although shipments of chip-making equipment and mineral fuels rebounded. Import values, down 16.3 percent, fell on the year for the sixth straight month. Japan/s trade balance came to an unexpected surplus of ¥62.4 billion in September after a ¥937.8 billion deficit in August. Japanese export values, up 4.3 percent on the year, posted their first year-over-year rise in three months to a record high in September, thanks to solid demand for automobiles from the US and Europe. Shipments to China, one of the key export markets for Japanese goods, posted their 10th straight year-over-year decline in September, led by declines in semiconductors and food, although shipments of chip-making equipment and mineral fuels rebounded. Import values, down 16.3 percent, fell on the year for the sixth straight month.
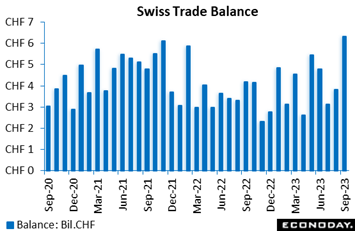 Switzerland’s merchandise trade surplus widened from August's CHF3.81 billion to CHF6.32 billion in September, a multi-year high. The latest reading was well above the CHF4.38 billion posted in the same month in 2022 but mainly reflected a 9.0 percent yearly slump in imports. Exports were up just 0.4 percent, although this was their first positive print in three months. Switzerland’s merchandise trade surplus widened from August's CHF3.81 billion to CHF6.32 billion in September, a multi-year high. The latest reading was well above the CHF4.38 billion posted in the same month in 2022 but mainly reflected a 9.0 percent yearly slump in imports. Exports were up just 0.4 percent, although this was their first positive print in three months.
Seasonally adjusted, the surplus stood at CHF5.03 billion, up from August’s CHF3.13 billion. Exports climbed 8.9 percent on the month, building on August's 7.7 percent bounce, while imports edged 0.3 percent higher after a 4.3 percent gain. The real trade balance also improved as export volumes increased 3.6 percent and their import counterpart fell 1.0 percent.
The September update puts real exports up 0.8 percent in the third quarter versus the previous period and imports down 0.6 percent. This follows contractions in both sides of the balance sheet in the second quarter and means that merchandise trade will have added slightly to Switzerland’s GDP growth in the third quarter.
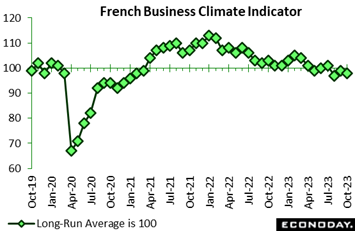 Sentiment in French manufacturing unexpectedly deteriorated in October. At 98, the headline index slipped a point versus its unrevised September mark, dipping below the market consensus and moving slightly further beneath its 100 long-run average. This is the third straight month that the headline measure has been short of its historic norm. Sentiment in French manufacturing unexpectedly deteriorated in October. At 98, the headline index slipped a point versus its unrevised September mark, dipping below the market consensus and moving slightly further beneath its 100 long-run average. This is the third straight month that the headline measure has been short of its historic norm.
October's setback reflected a hefty fall in past output (minus 11 percent after minus 6 percent) but masked an improvement in overall order books (minus 17 percent after minus 22 percent). However, personal production expectations (5 percent after 17 percent) declined sharply and general production expectations (minus 10 percent after minus 6 percent) were also marked down. Expected selling prices (0 percent after 4 percent) hit a 5-month low.
Elsewhere, sentiment similarly worsened in services (100 after 101), construction (103 after 105) and, more noticeably, in retail trade (98 after 103). As a result, the economy-wide index shed a couple of points to 98, its second-weakest reading since February 2021.
October's update points to another soft flash PMI survey next week. It also warns of a potentially steep fall in manufacturing output.
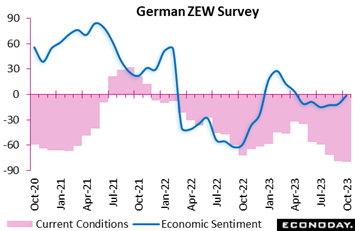 This month analysts have again marked down their assessment of the current state of the German economy but continued to raise their expectations for future growth. Both measures were on the firm side of the market consensus. Economic sentiment (expectations) rose a solid 10.2 points to minus 1.1 for the highest reading since April. This was the third successive increase. By contrast, the current conditions index dipped a further 0.5 points to minus 79.9. This was its sixth successive fall and its weakest outturn since August 2020. The gauge has shed more than 47 points since its 2023 peak in April. This month analysts have again marked down their assessment of the current state of the German economy but continued to raise their expectations for future growth. Both measures were on the firm side of the market consensus. Economic sentiment (expectations) rose a solid 10.2 points to minus 1.1 for the highest reading since April. This was the third successive increase. By contrast, the current conditions index dipped a further 0.5 points to minus 79.9. This was its sixth successive fall and its weakest outturn since August 2020. The gauge has shed more than 47 points since its 2023 peak in April.
The deterioration in current conditions is consistent with growing expectations that German GDP will turn negative over the second half of the year. However, the improvement in sentiment is large enough to suggest that analysts believe that signs that the ECB may have finished its tightening cycle will provide a boost to the economic outlook.
Any lingering hopes for early interest rate cuts took a knock last week as the global Relative Performance Index (RPI) rose to 16, indicating a clear, albeit still limited, upside bias to surprises in the economic data.
In the Eurozone, a limited supply of fresh data left the RPI at minus 1 and, when excluding prices (RPI-P), at minus 7; both close to zero to indicate that economic activity in general is performing much as forecasters expected. Coming just ahead of the European Central Bank’s policy announcement on Thursday, current levels should boost speculation that key interest rates will be left on hold.
At minus 9, the UK RPI similarly shows no major surprises in the overall economic picture. However, a minus 29 reading on the RPI-P means that unexpectedly weak real economy data are helping to offset upside shocks in inflation. This will probably be reflected in another very close vote at the Bank of England’s policy announcement on November 2nd.
In Japan, both the RPI (36) and RPI-P (51) moved further above zero, prompting fresh speculation about when the Bank of Japan might tighten and helping to lift the yield on the 10-year JGB above 0.8 percent, a 10-year high.
China’s surprisingly strong suite of reports encompassing both output and demand raised this country’s RPI to 16 and the RPI-P to a very solid 50. However, more of the same will likely be needed if the local currency is to stabilize and the government achieve its 5 percent full year growth forecast.
Data in the US continue to exceed expectations, at 30 on the RPI in a reading that could justify, at least for the policy hawks, a rate hike at the Federal Reserve’s November 1st announcement. Canada’s 15 score hints at overperformance but the RPI-P score of 34, which excludes September’s surprisingly soft CPI report, reveals tangible underlying strength that could raise doubts over the Bank of Canada’s expected decision on Wednesday to leave rates unchanged.
**Contributing to this article were Jeremy Hawkins, Brian Jackson, Laurie Laird, Mace News, Max Sato, and Theresa Sheehan
The Bank of Canada will make a policy announcement on Wednesday and the European Central Bank on Thursday. With the effects of prior hikes still said to be playing out, neither bank is expected to change rates. The key economic report will be third-quarter GDP from the US where a very strong 4.1 percent annual rate, lifted by consumer spending, is Econoday’s consensus.
Australia’s CPI updates on Wednesday are expected to rise slightly on the month and also on the quarter. Steady to lower annual readings are expected for Tokyo’s CPI data on Thursday, as they are for both monthly and annual showings for US PCE price indexes on Friday.
Other key data to watch include the EC’s consumer confidence flash on Monday, where a decline is expected, and October’s run of PMI flashes on Tuesday that are expected to extend a run of subdued to depressed results especially for manufacturing.
Singapore CPI for September (Mon 0500 GMT; Mon 1300 SGT; Mon 0100 EDT)
Consensus Forecast, Year over Year: 4.2%
Consumer prices in September, which in August slowed only a tenth to 4.0 percent, are expected to rise 2 tenths to 4.2 percent.
Eurozone: EC Consumer Confidence Flash for October (Mon 1400 GMT; Mon 1600 CEST; Mon 1000 EDT)
Consensus Forecast: -18.2
Consumer confidence in October is expected to fall to minus 18.2 versus September’s minus 17.8 which was nearly 2 points below expectations. September’s level was the lowest in half a year and the month’s drop was the steepest since last November.
Germany: GfK Consumer Climate for November (Tue 0600 GMT; Tue 0800 CEST; Tue 0200 EDT)
Consensus Forecast: -26.8
Consumer climate is expected to edge lower to minus 26.8 in November’s report after minus 26.5 October. This reading has been steady at historically weak levels.
UK Labour Market Report (Tue 0700 GMT; Tue 0200 EST)
Consensus Forecast, ILO Unemployment Rate for three months to September: 4.3%
The ILO unemployment rate for the three months to September is expected to hold steady at 4.3 percent. Note that Tuesday's data will complete the labour market report that was released in only partial form in the prior week due to an inadequate initial response to the survey.
German PMI Flashes for October (Tue 0730 GMT; Tue 0930 CEST; Tue 0330 EDT)
Consensus Forecast, Composite: 46.7
Consensus Forecast, Manufacturing: 40.0
Consensus Forecast, Services: 50.1
Manufacturing has contracted for 15 months in a row and very deeply so once again in September at 39.6. No significant improvement is expected for October where the consensus is 40.0. Services, at 50.3 in September, is seen at 50.1. Consensus for October’s composite is 46.7 following September’s 46.4.
Eurozone PMI Flashes for October (Tue 0800 GMT; Tue 1000 CEST; Tue 0400 EDT)
Consensus Forecast, Composite: 47.4
Consensus Forecast, Manufacturing: 43.7
Consensus Forecast, Services: 48.7
After September's 43.4 for manufacturing and 48.7 for services, the consensus estimates for October’s readings are 43.7 and 48.7 respectively. Manufacturing has been in contraction for the last 15 months straight while services in September held in contraction for a second straight month.
UK PMI Flashes for October (Tue 0830 GMT; Tue 0930 BST; Tue 0430 EDT)
Consensus Forecast, Composite: 48.8
Consensus Forecast, Manufacturing: 44.8
Consensus Forecast, Services: 49.5
Services, at 49.3 in September, sank into sub-50 contraction for the second straight month and is not expected to emerge in October where the consensus is 49.5. Manufacturing, which has been in sub-50 contraction for 14 months in a row, is seen at 44.8 versus 44.3. The composite is expected to edge higher to 48.8 from September’s 48.5.
US PMI Flashes for October (Tue 1345 GMT; Tue 0945 EDT)
Consensus Forecast, Manufacturing: 49.5
Consensus Forecast, Services: 49.4
Services have held in the 50 column the last eight reports but have been noticeably slowing with the consensus for October at 49.4 versus September’s 50.1. Manufacturing, at 49.8 in September, is expected to edge lower to 49.5 in August.
Australian CPI (Wed 0130 GMT; Wed 1130 AEST; Tue 2030 EDT)
Consensus Forecast, Year over Year for September: 5.3%
Consensus Forecast, Quarter over Quarter for the Third Quarter: 1.1%
Consumer prices in September are expected to edge higher, at a consensus 5.3 percent versus 5.2 percent in August and against 4.9 percent in July. The quarter-over-quarter rate is seen at 1.1 percent versus 0.8 percent in the second quarter; the third-quarter year-over-year rate is seen at 5.3 percent versus the second quarter’s 6.0 percent.
German Ifo for October (Wed 0800 GMT; Wed 10:00 CEST; Wed 0400 EDT)
Consensus Forecast, Business Climate: 85.9
Consensus Forecast, Current Conditions: 88.5
Consensus Forecast, Business Expectations: 83.3
The business climate index, at 85.7, held steady in September and, at a consensus 85.9, is expected to once gain in October.
Eurozone M3 Money Supply for September (Wed 0800 GMT; Wed 1000 CEST; Wed 0400 EDT)
Consensus Forecast, Year-over-Year: -1.7%
Broad money growth (on a 3-month basis) is expected to extend its downward path to 1.7 percent annual contraction in September versus 0.4 percent contraction in August.
Bank of Canada Announcement (Wed 1400 GMT; Wed 1000 EDT)
Consensus Forecast, Change: 0 basis points
Consensus Forecast, Level: 5.0%
Holding rates steady at its September meeting, which followed a 25-basis-point rate hike in July, the Bank of Canada is expected to keep rates steady once again. Consumer inflation eased 2 tenths in September to a still very high 3.8 percent.
US New Home Sales for September (Wed 1400 GMT; Wed 1000 EDT)
Consensus Forecast, Annual Rate: 685,000
New home sales fell sharply from 739,000 in July to a 675,000 annual rate in August with forecasters for September calling for a slight rebound to 685,000 despite the steep surge in interest rates.
Korean Third-Quarter GDP, First Estimate (Wed 2300 GMT; Thu 0800 KST; Wed 1900 EDT)
Consensus Forecast, Quarter over Quarter: 0.7%
Consensus Forecast, Year over Year: 1.1%
Third-quarter GDP is expected to rise 0.7 percent on the quarter and rise 1.1 percent on the year. These would compare respectively with growth of 0.6 and 0.9 percent in the second quarter.
European Central Bank Announcement (Thu 1215 GMT; Thu 1415 CEST; Thu 0815 EDT)
Consensus Forecast, Change: 0 basis points
Consensus Forecast, Refi Rate: 4.50%
After hiking rates ten straight rate times, the European Central Bank is expected to hold rates steady at 4.50 percent.
US Durable Goods Orders for October (Thu 1230 GMT; Thu 0830 EDT)
Consensus Forecast: Month over Month: 1.0%
Consensus Forecast: Ex-Transportation - M/M: 0.2%
Forecasters see durable goods orders rising 1.0 percent in October following September’s 0.1 percent increase. Ex-transportation orders are seen up 0.2 percent.
US International Trade in Goods (Advance) for September (Thu 1230 GMT; Thu 0830 EDT)
Consensus Forecast, Balance: -$85.4 billion
The US goods deficit (Census basis) is expected to hold steady at $85.4 billion in September after narrowing by $6.3 billion in August to $84.6 billion.
US Third-Quarter GDP, First Estimate (Thu 1330 GMT; Thu 0830 EST)
Consensus Forecast, Annualized Rate: 4.1%
Third-quarter GDP, supported by consumer spending, is expected to accelerate sharply to 4.1 percent annualized growth versus second-quarter growth of 2.1 percent.
Tokyo Consumer Price Index for October (Thu 2330 GMT; Fri 0830 JST; Thu 1930 EDT)
Consensus Forecast, Year over Year: 2.8%
Ex-Fresh Food, Consensus Forecast: 2.5%
Ex-Fresh Food & Energy, Consensus Forecast: 3.6%
Consumer inflation in Tokyo is expected to come in unchanged at a year-over-year 2.8 percent in October. The ex-fresh food reading is also seen unchanged, at 2.5 percent. Ex-fresh food & energy is seen at 3.6 percent, down from September’s 3.8 percent which was 2 tenths below Econoday’s consensus.
US Personal Income for September (Fri 1230 GMT; Fri 0830 EDT)
Consensus Forecast, Month over Month: 0.4%
US Consumption Expenditures
Consensus Forecast, Month over Month: 0.5%
US PCE Price Index
Consensus Forecast, Month over Month: 0.3%
Consensus Forecast, Year over Year: 3.4%
US Core PCE Price Index
Consensus Forecast, Month over Month: 0.3%
Consensus Forecast, Year over Year: 3.7%
Personal income is expected to rise 0.4 percent in September with consumption expenditures expected to increase 0.5 percent. These would compare with August’s 0.4 percent creases for both. Inflation readings for September are expected at monthly increases of 0.3 percent both overall and for the core (versus August’s increases of 0.4 and 0.1 percent). Annual rates are expected at 3.4 percent overall and 3.7 percent for the core (versus August’s 3.5 and 3.9 percent).
|
