|
With both the Bank of England and especially the European Central Bank seemingly on the path for further rate hikes, the central question for the global economy is whether the US Federal Reserve is also walking down that path. The week’s favorable, if not very favorable, consumer price data from the US are feeding expectations that the Fed will once again skip a meeting and keep rates steady. Though US inflation is moving in the right direction, pressures remain highly elevated at the same time that inflation expectations haven’t shown the same kind of improvement. And what may also be improving is the US jobs market which will give the Fed the cover it needs to raise rates once again. Global policy is in fact in flux, with some banks pausing but others not.
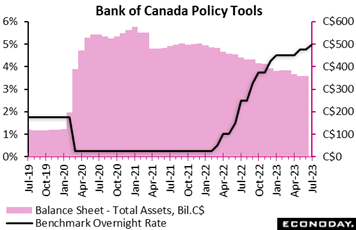 The Bank of Canada raised its benchmark overnight rate by another 25 basis points to a fresh 22-year high of 5.0 percent. The move was widely expected and reflected what the bank said is "the accumulation of evidence that excess demand and elevated core inflation are both proving more persistent". In its quarterly Monetary Policy Report for July, the bank forecasts consumer inflation to hover around 3 percent for the next year before gradually declining to 2 percent in the middle of 2025. "This is a slower return to target than was forecast in the January and April projections," the bank said, adding it remains concerned that progress toward the 2 percent target could stall, jeopardizing the return to price stability." The Bank of Canada raised its benchmark overnight rate by another 25 basis points to a fresh 22-year high of 5.0 percent. The move was widely expected and reflected what the bank said is "the accumulation of evidence that excess demand and elevated core inflation are both proving more persistent". In its quarterly Monetary Policy Report for July, the bank forecasts consumer inflation to hover around 3 percent for the next year before gradually declining to 2 percent in the middle of 2025. "This is a slower return to target than was forecast in the January and April projections," the bank said, adding it remains concerned that progress toward the 2 percent target could stall, jeopardizing the return to price stability."
May’s CPI did slow a full percentage point to 3.4 percent due mainly, however, to lower energy costs in a base-year effect. Core rates eased less dramatically as the bank’s statement noted, including ex-food and energy which fell 4 tenths to 4.0 percent (June data will be posted on Tuesday of the coming week).
"Governing Council will continue to assess the dynamics of core inflation and the outlook for CPI inflation," the bank said. "In particular, we will be evaluating whether the evolution of excess demand, inflation expectations, wage growth and corporate pricing behaviour are consistent with achieving the 2 percent inflation target."
The BoC described household spending as “robust” supported by strong demand for labour, population growth and accumulated household savings. The bank does expect consumer spending to slow in response to the cumulative effect of prior rate hikes, though it noted that “recent retail trade and other data suggest more persistent excess demand in the economy." The housing market has also “seen some pickup”, the bank said noting that “new construction and real estate listings are lagging demand, which is adding pressure to prices."
July’s hike follows a surprise 25-basis point rate hike last month and a "conditional" pause in April and March. In January, the bank raised the policy rate for the eighth consecutive time with a 25-basis point hike, slowing the pace from 50 points in December and October, 75 points in September and 100 points in July last year. With the latest hike, the bank has tightened rates by a total of 475 basis points over 10 moves. The BoC noted that quantitative tightening is complementing the restrictive stance of monetary policy and normalizing the bank's balance sheet.
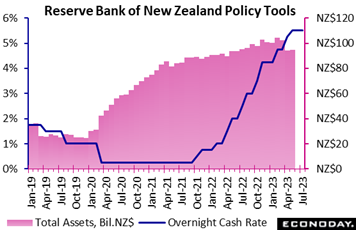 Like the BoC, the Reserve Bank of New Zealand has also aggressively tightened policy but in this case, left its overnight cash rate unchanged at 5.50 percent to end twelve straight rate hikes. With GDP in contraction for two quarters in a row, the result was no surprise. Officials expect weakness in economic activity to persist in the near term including easing demand in the labour market. Consumer inflation did slow to 6.7 percent in the first quarter from 7.2 percent in the fourth quarter, but core inflation eased only marginally from 7.4 to 7.3 percent. Nevertheless, officials expect inflation will continue to decline and return to the 1.0 to 3.0 percent target range in the second half of next year. Like the BoC, the Reserve Bank of New Zealand has also aggressively tightened policy but in this case, left its overnight cash rate unchanged at 5.50 percent to end twelve straight rate hikes. With GDP in contraction for two quarters in a row, the result was no surprise. Officials expect weakness in economic activity to persist in the near term including easing demand in the labour market. Consumer inflation did slow to 6.7 percent in the first quarter from 7.2 percent in the fourth quarter, but core inflation eased only marginally from 7.4 to 7.3 percent. Nevertheless, officials expect inflation will continue to decline and return to the 1.0 to 3.0 percent target range in the second half of next year.
The statement said previous policy tightening is continuing to weigh on consumer spending and residential construction, with businesses also reporting weaker demand and investment plans. Prior to the latest meeting, the bank had increased policy by a cumulative 525 basis points since October 2021.
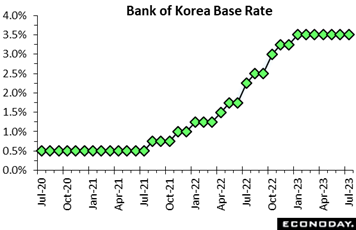 Back in August 2021 the Bank of Korea was the first major central bank to begin raising rates this cycle. Having been well ahead of the curve, the BoK has had the luxury to keep policy unchanged since early this year, extending the pause as expected to its July meeting with its base rate on hold at 3.50 percent. The BoK appears confident that previous policy tightening will help lower inflation toward its target level of 2.0 percent. Since the previous BoK meeting in May, inflation has fallen from 3.7 percent in April to 3.3 percent in May and 2.7 percent in June. Core CPI inflation has also moderated in recent months to 3.5 percent in June. Back in August 2021 the Bank of Korea was the first major central bank to begin raising rates this cycle. Having been well ahead of the curve, the BoK has had the luxury to keep policy unchanged since early this year, extending the pause as expected to its July meeting with its base rate on hold at 3.50 percent. The BoK appears confident that previous policy tightening will help lower inflation toward its target level of 2.0 percent. Since the previous BoK meeting in May, inflation has fallen from 3.7 percent in April to 3.3 percent in May and 2.7 percent in June. Core CPI inflation has also moderated in recent months to 3.5 percent in June.
The bank’s statement noted that the recent fall in inflation partly reflects the base effects of previous increases in global oil prices. Officials expect headline inflation to fall to around 3.0 percent in coming months and then fluctuate around that level for the rest of the year, but revised up their forecast for near-term core inflation from 3.3 percent to 3.5 percent.
The statement also noted that domestic growth has shown signs of picking up from recent weakness, with officials expressing optimism that private consumption and exports will improve further in coming months. They continue to forecast that South Korea's economy will grow 1.4 percent in 2023.
Officials are non-committal about the policy outlook, noting that policy uncertainty remains "high". Nevertheless, they advise that they will "maintain a restrictive policy stance for a considerable time" and indicate that further policy tightening may yet be required. Incoming inflation data will likely remain the key factor driving policy decisions in coming months.
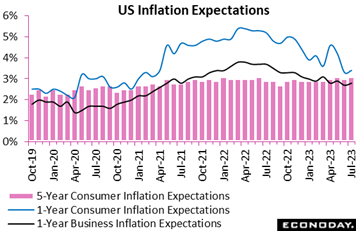 Moderation in US consumer prices grabbed the week’s headlines and are understandably cooling expectations for the Federal Reserve’s July 26th policy announcement, from a hike to a pause. But also released during the week were July estimates for inflation expectations which is the foundation of the Fed’s inflation structure. These did not move lower, in fact all moved higher though only a bit: year-ahead business expectations up 1 tenth to 2.8 percent, year-ahead consumer expectations up 1 tenth to 3.4 percent, 5-year consumer expectations up 1 tenth to 3.3 percent. As visible in the graph, both year-ahead readings (blue and black lines) are below where they were early last year and moving nicely in the right direction. Not moving in the right direction, however, is the 5-year reading (red columns) which, by the way, is the most important of the three, tracking the Fed’s longer-term concerns. In fact the 5-year reading is retouching its highs of the post-Covid and early Ukraine period. Yes, the Fed has made substantial progress since the spring of last year, but to return expectations back to where they were 3-1/2 years ago, more progress and perhaps more rate hikes are required (lagging effects of prior hikes of course notwithstanding). Moderation in US consumer prices grabbed the week’s headlines and are understandably cooling expectations for the Federal Reserve’s July 26th policy announcement, from a hike to a pause. But also released during the week were July estimates for inflation expectations which is the foundation of the Fed’s inflation structure. These did not move lower, in fact all moved higher though only a bit: year-ahead business expectations up 1 tenth to 2.8 percent, year-ahead consumer expectations up 1 tenth to 3.4 percent, 5-year consumer expectations up 1 tenth to 3.3 percent. As visible in the graph, both year-ahead readings (blue and black lines) are below where they were early last year and moving nicely in the right direction. Not moving in the right direction, however, is the 5-year reading (red columns) which, by the way, is the most important of the three, tracking the Fed’s longer-term concerns. In fact the 5-year reading is retouching its highs of the post-Covid and early Ukraine period. Yes, the Fed has made substantial progress since the spring of last year, but to return expectations back to where they were 3-1/2 years ago, more progress and perhaps more rate hikes are required (lagging effects of prior hikes of course notwithstanding).
Turning to the June CPI, the headline rose 0.2 percent on the month and 3.0 percent year-over-year, while the ex-food ex-energy core also rose 0.2 percent from May -- which is the report’s most favorable showing -- and increased 4.8 percent on the year. All of these results came in under expectations. Yet housing costs remain very steep, up 0.5 percent for rents on the month and up 0.4 percent for the equivalent measure for homeowners; year-over-year rates are 8.3 and 7.8 percent respectively, both off highs but extremely elevated.
Food prices were up 0.1 percent on the month and 5.7 percent on the year, both slowing down from May. Energy did rise 0.6 percent on the month but after falling 3.6 percent in May and was down 16.7 percent year-over-year after May’s 11.7 percent decrease. On the downside, prices for airline fares, communication, housing furnishings and operations all decreased on the month.
Another positive to note is deceleration on a half-year basis. The headline CPI fell 3.4 percentage points from the end of last year to the half way mark this year. That’s faster than the 2.5 percentage points from the half way mark last year to the beginning of this year. The core comparisons are also favorable: 0.9 points versus only 0.2 points. Yes, the direction is increasingly positive, but has there been enough progress especially with the core?
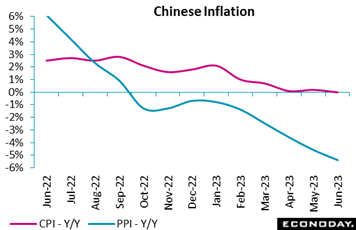 China's total consumer price index was unchanged on the year in June after rising 0.2 percent in May, reflecting slow recovery in domestic demand. It was weaker than the consensus forecast of a 0.3 rise. Transportation and communication prices continued to post a sharp drop, which was offset by higher costs for food, health care and education. The index fell 0.2 percent on the month for the fifth consecutive monthly drop after dipping 0.2 percent previously. China's total consumer price index was unchanged on the year in June after rising 0.2 percent in May, reflecting slow recovery in domestic demand. It was weaker than the consensus forecast of a 0.3 rise. Transportation and communication prices continued to post a sharp drop, which was offset by higher costs for food, health care and education. The index fell 0.2 percent on the month for the fifth consecutive monthly drop after dipping 0.2 percent previously.
The pace of increase in consumer prices in the first six months of the year decelerated slightly to 0.7 percent from 0.8 percent for the January-May period. China has set a CPI growth target at 3 percent for 2023.
China's producer price index fell 5.4 percent on the year in June for the ninth straight drop after falling 4.6 percent in May in light of easing global commodities markets and slowing domestic demand. The decline is sharper than the consensus forecast for a decline of 5.0 percent. The index dipped 0.8 percent on the month for the third consecutive drop, after falling 0.9 percent previously.
Production materials fell at a faster pace of 6.8 percent on the year in June after a 5.9 percent fall in May with mining costs down 16.2 percent versus a 11.5 percent drop. Food costs slipped 0.6 percent after a 0.2 percent rise and durable goods prices slumped 1.5 percent after shrinking 1.1 percent.
 India's consumer price index rose 4.81 percent on the year in June, picking up from an increase of 4.25 percent in May and above the consensus forecast of 4.60 percent. Despite increase, the CPI remains within the Reserve Bank of India's target range of 2.0 percent to 6.0 percent after persisting around 7.0 percent for several months in mid-2022. The index advanced 1.01 percent on the month, after increasing 0.51 percent previously. India's consumer price index rose 4.81 percent on the year in June, picking up from an increase of 4.25 percent in May and above the consensus forecast of 4.60 percent. Despite increase, the CPI remains within the Reserve Bank of India's target range of 2.0 percent to 6.0 percent after persisting around 7.0 percent for several months in mid-2022. The index advanced 1.01 percent on the month, after increasing 0.51 percent previously.
Food and beverage prices, which account for more than half the weight of the CPI index, were the major factor driving headline inflation higher in June. These prices rose 4.63 percent on the year after increasing 3.29 percent previously. Fuel and light charges, around 8 percent of the index, rose 3.92 percent on the year after increasing 4.64 percent previously. Inflation in urban areas picked up from 4.33 percent in May to 4.96 percent in June, while inflation in rural areas increased from 4.23 percent to 4.72 percent.
The RBI left its policy rate on hold for the second meeting in a row at their most recent meeting held last month, after increasing the rate by a cumulative 250 basis points since May 2022. Officials noted that risks to the inflation outlook were evenly balanced, and the increase in June suggests they will remain vigilant about inflation risks in upcoming policy meetings.
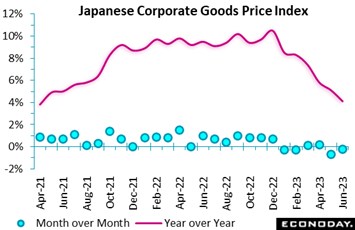 Producer inflation in Japan eased for the sixth straight month in June, hitting a fresh two-year low, as the government's utilities subsidies capped energy costs and many commodities markets softened on slowing global growth. The corporate goods price index was 4.1 percent higher on the year in June, below the median forecast of 4.4 percent and the lowest since 3.8 percent in April 2021. The decrease was led by lower costs for utilities (electricity, city gas), chemical products, farm produce and lumber. On the month, the domestic CGPI dipped 0.2 percent in June after falling 0.7 percent in May. Producer inflation in Japan eased for the sixth straight month in June, hitting a fresh two-year low, as the government's utilities subsidies capped energy costs and many commodities markets softened on slowing global growth. The corporate goods price index was 4.1 percent higher on the year in June, below the median forecast of 4.4 percent and the lowest since 3.8 percent in April 2021. The decrease was led by lower costs for utilities (electricity, city gas), chemical products, farm produce and lumber. On the month, the domestic CGPI dipped 0.2 percent in June after falling 0.7 percent in May.
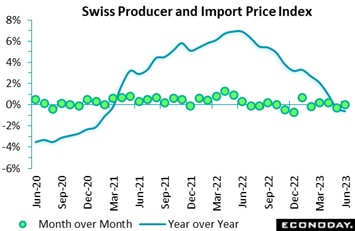 The combined producer and import price index was unchanged on the month in June. The flat reading, which was softer than the market consensus, trimmed the annual inflation rate by 0.3 percentage points to minus 0.6 percent, its fifth straight decline and its weakest print since February 2021. The combined producer and import price index was unchanged on the month in June. The flat reading, which was softer than the market consensus, trimmed the annual inflation rate by 0.3 percentage points to minus 0.6 percent, its fifth straight decline and its weakest print since February 2021.
Domestic producer prices were also steady at their May level, reducing their yearly rate from 2.0 percent to 1.7 percent. Import prices edged a tick firmer but this still cut their annual change from minus 4.6 percent to minus 5.0 percent, the lowest outturn since November 2020.
Within the PPI, monthly changes were generally around zero, the main exceptions being timber products (4.1 percent) and water treatment and distribution, waste collection, recovery (minus 4.6 percent). Import prices were boosted by a 14.5 percent bounce in mining and quarrying products. As a result, the underlying composite index dipped 0.1 percent on the month, reducing the annual core inflation rate from 1.8 percent to 1.5 percent, its lowest outturn since July 2021.
June’s update provides further evidence of softening pipeline inflation pressures although this still may not be enough to prevent the Swiss National Bank from tightening again in September.
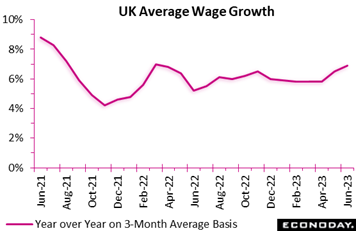 Overall wage growth in the UK was again stronger than expected. A 6.9 percent yearly rate for the three months to May was 2 tenths above the consensus and followed an upwardly revised 6.7 percent rate in the three months to April. Regular earnings were even stronger, albeit stable, at 7.3 percent, matching the record high seen outside of the Covid period. Overall wage growth in the UK was again stronger than expected. A 6.9 percent yearly rate for the three months to May was 2 tenths above the consensus and followed an upwardly revised 6.7 percent rate in the three months to April. Regular earnings were even stronger, albeit stable, at 7.3 percent, matching the record high seen outside of the Covid period.
The May/June labour market report showed some easing in overall conditions but not to the extent needed to accommodate any fall in wage pressures. As such, it will not sit well with the Bank of England.
Claimant count unemployment surprisingly rose 25,700 to 1.552 million in June, more than unwinding a steeper revised 22,500 drop in May. This was the largest increase since March and lifted the jobless rate by a tick to 4.0 percent from an upwardly amended 3.9 percent in mid-quarter. However, the rate remains historically low.
Meanwhile, the ILO data also showed unemployment rising a further 77,000 to 1.370 million in the three months to May. This was its sharpest increase since the market began turning in the third quarter of last year and large enough to boost the jobless rate from 3.8 percent in December-February to 4.0 percent. This was above the market consensus and matched its highest mark since September-November 2021. Even so, employment growth remained robust, with jobs climbing a solid 102,000 to 33.053 million, a new record high. The employment rate (76.0 percent) was also up 2 tenths from the previous quarter.
That said, the more timely estimate of payrolled employees showed a 9,261 drop in June, its first decline since February 2021. Although only provisional, this could point to a moderation in labour demand. This would certainly be consistent with vacancies which fell again, this time by 85,000 to 1.034 million in the second quarter. The latest drop was the steepest since the unbroken trend decline began back in the May-July 2022 period.
In sum, the latest update shows signs that the labour market is beginning to respond to what is a stagnating, if not contracting, real economy. However, it remains tight enough to sustain wage growth at far too high a level to make the 2.0 CPI target attainable. Accordingly, Bank Rate still looks very likely to be hiked again next month.
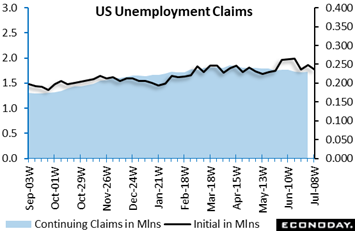 Expectations in the US may be building for a second straight rate pause at month end, but job growth, at a nonfarm average of 244,000 over the past three months, still probably qualifies as “robust” which will give cover for what many FOMC policy makers may well believe is their most responsible move, that is to raise rates further. Weekly jobless claims data had been signaling some loosening in the labor market, hitting a peak of 265,000, but that was back in the first half of June. Since then claims have been coming down to signal renewed strength in labor demand. Initial jobless claims in the July 8 fell 12,000 to 237,000 which was well below expectations. The four-week moving average also fell, down 6,750 to 246,750; the underlying trend appears to be returning to the pre-June trend. Expectations in the US may be building for a second straight rate pause at month end, but job growth, at a nonfarm average of 244,000 over the past three months, still probably qualifies as “robust” which will give cover for what many FOMC policy makers may well believe is their most responsible move, that is to raise rates further. Weekly jobless claims data had been signaling some loosening in the labor market, hitting a peak of 265,000, but that was back in the first half of June. Since then claims have been coming down to signal renewed strength in labor demand. Initial jobless claims in the July 8 fell 12,000 to 237,000 which was well below expectations. The four-week moving average also fell, down 6,750 to 246,750; the underlying trend appears to be returning to the pre-June trend.
Continuing claims in lagging data for the July 1 week edged 11,000 higher to 1.729 million with this four-week moving average not materially different at 1.735 million. Most beneficiaries are not staying on the rolls for extended periods. The insured rate of unemployment remains at 1.2 percent for the 11th straight week and is consistent with a tight labor market, at least for those eligible for benefits.
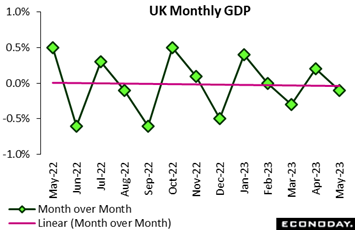 The economy contracted in May but was still stronger than expected. Following an unrevised 0.2 percent monthly rise in April, GDP dipped 0.1 percent, some 0.3 percentage points less than the market consensus albeit its second decline in the last three months. The drop reduced quarterly growth to zero from 0.1 percent in the three months to April and the annual change from 0.5 percent to minus 0.4 percent. Total output was just 0.2 percent above its pre-Covid level in February 2020. The economy contracted in May but was still stronger than expected. Following an unrevised 0.2 percent monthly rise in April, GDP dipped 0.1 percent, some 0.3 percentage points less than the market consensus albeit its second decline in the last three months. The drop reduced quarterly growth to zero from 0.1 percent in the three months to April and the annual change from 0.5 percent to minus 0.4 percent. Total output was just 0.2 percent above its pre-Covid level in February 2020.
Weakness was broad-based but led by the goods producing sector where output was down a monthly 0.6 percent. Within this, manufacturing declined 0.2 percent. Elsewhere, construction also decreased 0.2 percent while services were flat with output in consumer-facing services falling 0.2 percent following a 1.1 percent rise in April.
May's data put average GDP in the first two months of the second quarter unchanged from its mean level in the first quarter. The additional bank holiday for the Coronation of King Charles III on May 8th probably had some impact although any resulting hit to goods production needs to be weighed against a reported boost to the arts and entertainment and recreation sectors. Net the impact was probably only small. In sum, GDP has been essentially flat-lining since the start of the year which will be enough to support expectations for another BoE interest rate hike next month.
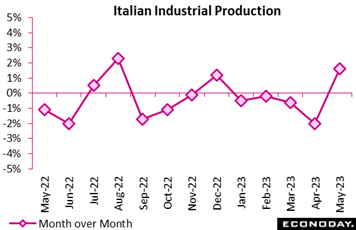 Industrial production rebounded more strongly than expected in May. However, while a 1.6 percent monthly increase was double the market consensus, it failed to reverse a slightly steeper revised 2.0 percent fall in April and constituted only the first advance so far in 2023. Annual growth climbed from minus 7.4 percent to minus 3.7 percent. Industrial production rebounded more strongly than expected in May. However, while a 1.6 percent monthly increase was double the market consensus, it failed to reverse a slightly steeper revised 2.0 percent fall in April and constituted only the first advance so far in 2023. Annual growth climbed from minus 7.4 percent to minus 3.7 percent.
The monthly gain was led by capital goods which were up 1.4 percent. Intermediates (1.2 percent) and consumer goods (1.1 percent) were not far behind and energy (0.1 percent) also edged firmer.
Despite May’s stronger-than-anticipated report, industrial production remains mired in recession and should again subtract from second quarter GDP growth. Indeed, output is still at its second lowest level since January 2022.
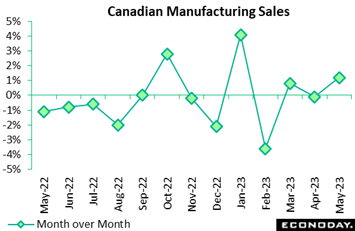 Canada's manufacturing sales surprised on the upside once again with a 1.2 percent advance in May topping the 0.8 percent consensus, following 0.1 percent contraction in April. Sales edged up 0.2 percent from a year earlier after a 2.0 percent year-over-year drop in April. Higher activity was behind May's increase, as volumes rose 2.2 percent from April. Industrial prices were down 1.0 percent on the month. Canada's manufacturing sales surprised on the upside once again with a 1.2 percent advance in May topping the 0.8 percent consensus, following 0.1 percent contraction in April. Sales edged up 0.2 percent from a year earlier after a 2.0 percent year-over-year drop in April. Higher activity was behind May's increase, as volumes rose 2.2 percent from April. Industrial prices were down 1.0 percent on the month.
Overall, 14 of 21 categories recorded higher sales on the month, led by chemical products, motor vehicles, and machinery, with sales increases of 4.8 percent, 4.8 percent, and 4.2 percent, respectively. The increase in machinery is a positive sign for investment activity. Sales excluding motor vehicles and parts were up 0.7 percent. Petroleum and coal was up 0.2 percent. Among the seven categories with lower sales, primary metals, down 6.9 percent, posted the largest decline.
The largest monthly sales increase since October 2022 was accompanied by a 0.6 percent decline in inventories, bringing down the inventory-to-sales ratio to 1.69 from 1.72, the lowest level since January. But looking ahead, data are not encouraging, as new orders fell 1.3 percent and unfilled orders 1.5 percent.
The unadjusted manufacturing capacity utilization rate rebounded to 80.3 percent from 77.5 percent, making inflationary pressures more likely to continue than not. The utilization rate has been trending up since a low of 75.9 percent in December 2022.
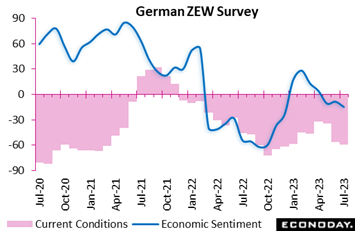 ZEW's July survey found analysts increasingly negative about the current and prospective state of the German economy. Following a 21.7 point slump in June, the current conditions index dropped a further 3.0 points to minus 59.5. This was broadly in line with the consensus but the third straight fall and a 7-month low. Economic sentiment (expectations), which rose 2.2 points in June, declined a surprisingly steep 6.2 points to minus 14.7, also its worst reading so far in 2023. ZEW's July survey found analysts increasingly negative about the current and prospective state of the German economy. Following a 21.7 point slump in June, the current conditions index dropped a further 3.0 points to minus 59.5. This was broadly in line with the consensus but the third straight fall and a 7-month low. Economic sentiment (expectations), which rose 2.2 points in June, declined a surprisingly steep 6.2 points to minus 14.7, also its worst reading so far in 2023.
The German economy remains one of the weakest in the Eurozone but with annual local wage growth on some measures in excess of 6.0 percent, this will not trouble the ECB. Indeed, the Bundesbank is likely to be among the most vocal of Eurozone central banks calling for additional rate hikes at this month's policy meeting.
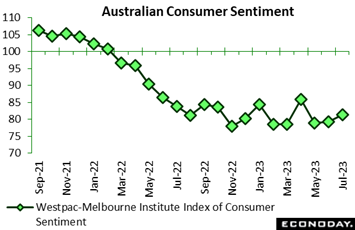 Australia's Westpac-Melbourne Institute index of consumer sentiment moved off deep lows to 81.3 in July from 79.2 in June, in line with the latest CPI data that showed easing to 5.6 percent in May from 6.8 percent in April. The Reserve Bank of Australia left its policy rate unchanged at 4.10 percent at its July 4 meeting after raising the rate by 25 basis points in June. The index at 81.3 is well below 85.8 seen in April when the central bank stood pat on rates for the first time during the ongoing tightening cycle. Australia's Westpac-Melbourne Institute index of consumer sentiment moved off deep lows to 81.3 in July from 79.2 in June, in line with the latest CPI data that showed easing to 5.6 percent in May from 6.8 percent in April. The Reserve Bank of Australia left its policy rate unchanged at 4.10 percent at its July 4 meeting after raising the rate by 25 basis points in June. The index at 81.3 is well below 85.8 seen in April when the central bank stood pat on rates for the first time during the ongoing tightening cycle.
Compared to the RBA’s April pause, consumers are slightly more hawkish on the rate outlook believing the bank’s most recent decision is a temporary pause and that rates will once again move higher over the next year. The report said, “responses suggest consumers are still clearly very nervous about the outlook for interest rates, particularly with the previous pause in April having been a ‘false dawn,'" The key message, according to the report, “is that sentiment is probably not going to stage a sustained lift from current deeply pessimistic levels until inflation is much lower and interest rates are firmly on hold."
At week’s end the Australian government announced that Michele Bullock, Deputy Governor at the Reserve Bank of Australia, will replace Governor Philip Lowe when his seven-year term expires in September. Although Lowe could have been re-appointed when his term expires, it is not unusual for a governor to serve only one term. The RBA has faced heavy criticism for its performance since it began tightening policy aggressively last year after Lowe had previously advised that he expected rates would remain at historically low levels until 2024.
Bullock has had a long career at the RBA and was appointed deputy governor just over a year ago. As governor, she will be responsible for overseeing changes to the RBA's procedures and operations that were recommended in a external review earlier in the year. Some of these changes relating to the timing and frequency of policy meetings have already been accepted by the RBA and will be introduced in 2024, while others will be finalised once the government secures changes to the relevant legislation.
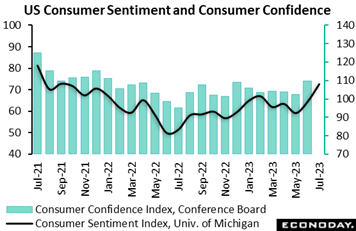 A big surprise came at week’s end in what may be another factor keeping the Fed from pausing at month end. The University of Michigan’s consumer sentiment index jumped to 72.6 in the preliminary July report, up 8.2 points from the prior month for the best reading since 72.8 in September 2021. July’s result was well above Econoday’s consensus of 65.5 and reflected stronger perceptions for both current conditions and the near future. The gains suggest that fears of a recession and concern over possible labor market weakening are easing, attitudes supported by the ongoing rise in the stock market where the Dow is at the highest point in a year. Inflation expectations, as discussed earlier in this article, are up a bit so far this month but well below where they were earlier in the year. The graph tracks sentiment index against the rival consumer confidence index which will be posted at month end. A big surprise came at week’s end in what may be another factor keeping the Fed from pausing at month end. The University of Michigan’s consumer sentiment index jumped to 72.6 in the preliminary July report, up 8.2 points from the prior month for the best reading since 72.8 in September 2021. July’s result was well above Econoday’s consensus of 65.5 and reflected stronger perceptions for both current conditions and the near future. The gains suggest that fears of a recession and concern over possible labor market weakening are easing, attitudes supported by the ongoing rise in the stock market where the Dow is at the highest point in a year. Inflation expectations, as discussed earlier in this article, are up a bit so far this month but well below where they were earlier in the year. The graph tracks sentiment index against the rival consumer confidence index which will be posted at month end.
The degree to which US inflation expectations have been much more favorable than expected can be seen in Econoday’s Consensus Divergence Index less Prices (ECDI-P) which stands at plus 26 to indicate that real economy indicators are coming in sizably above expectations. When including inflation indicators, which have been coming in below Econoday’s consensus forecasts, the ECDI falls to plus 9 to indicate that US indicators in total are exceeding expectations by a less noticeable degree. Given the strength of the real economy, the hawks on the Federal Reserve can confidently argue at the coming FOMC meeting that the US can withstand more rate hikes, a resumption aimed at accelerating the decline in inflation, at bringing the core rate into the target zone, and capping a definitive end to the inflation scare. Canada’s ECDI score of plus 11 (plus 7 excluding prices) is also indicative of outperformance and also suggests that risks to monetary policy are tilted toward tightening.
In the Eurozone, the recent run of disappointingly soft data continues. Both the ECDI (minus 36) and the ECDI-P (minus 40) show economic activity remaining well short of expectations. However, for now, with inflation effectively the only input into monetary policy decisions, the ECB is still very likely to hike key interest rates again later this month.
UK economic news has been much more mixed and, on balance, slightly stronger than forecast. With both the ECDI and ECDI-P now at 18, the economy is running hot enough versus forecasts to leave speculators fairly convinced that the Bank of England will also be voting to tighten again at its next policy meeting in August.
By contrast, the Swiss economy has still not surprised on the upside since the middle of March and second quarter GDP growth now looks all the more likely to fall short of earlier forecasts. SNB talk remains hawkish but further negative readings would surely ease pressure on the central bank to tighten any further. Either way, it would seem that the top of the interest rate cycle is not far off.
Japanese data have been notably weak and have pushed this country’s ECDI (minus 38) and ECDI-P (minus 44) deep into negative surprise territory. Ahead of the upcoming BoJ meeting, there has been some speculation about possible tinkering with the current yield curve control policy but such readings argue otherwise.
In China, economic news has been fairly consistently below consensus since early May, and weak enough to prompt a clear policy response from the authorities. However, at minus 57 and minus 60 respectively, the ECDI and ECDI-P warn that additional measures may well be needed sooner rather than later including perhaps a second straight cut in the coming week in loan prime rates.
**Contributing to this article were Jeremy Hawkins, Brian Jackson, Mace News, Max Sato, and Theresa Sheehan
Chinese GDP on Monday will open and possibly dominate the week. Second-quarter expectations are quarter-over-quarter growth of 0.9 percent which would be down noticeably from 2.2 percent growth in the first quarter. Also released Monday will be Chinese industrial production and retail sales, both of which are expected to weaken, with China’s loan prime rate expected to be updated on Thursday.
Consumer price updates will open Tuesday with Canada where pressures are expected to further cool followed by New Zealand and the UK on Wednesday, two economies where pressures have yet to cool. Japan’s CPI will be posted on Friday for an economy where price pressures have been mixed.
Consumer updates will include US retail sales on Tuesday, UK retail sales on Wednesday, and EC consumer confidence on Thursday. Australia’s labour force survey on Thursday will offer clues on Reserve Bank of Australia policy while Japanese merchandise trade, also on Thursday, will offer for whether global trade is beginning to improve.
Chinese Fixed Asset Investment for June (Mon 0200 GMT; Mon 1000 CST; Sun 2200 EDT)
Consensus Forecast, Year-to-Date on Y/Y Basis: 3.5%
Fixed asset investment in June is expected to rise 3.5 percent. This would compare with 4.0 percent growth in May against expectations for 4.4 percent and against 4.7 percent growth in April.
Chinese Second-Quarter GDP (Mon 0200 GMT; Mon 1000 CST; Sun 2200 EDT)
Consensus Forecast, Quarter over Quarter: 0.9%
Consensus Forecast, Year over Year: 7.1%
Second-quarter GDP is expected to rise 0.9 percent versus the first quarter which would compare with 2.2 percent sequential growth from the fourth quarter. The year-over-year expectation in the first quarter is growth of 7.1 percent which would compare with 4.5 percent growth in the first quarter.
Chinese Industrial Production for June (Mon 0200 GMT; Mon 1000 CST; Sun 2200 EDT)
Consensus Forecast, Year over Year: 2.6%
Year-over-year growth in industrial production is expected to slow to 2.6 percent in June versus growth of 3.5 percent in May which was very close to expectations but noticeably slower than April’s growth of 5.6 percent.
Chinese Retail Sales for June (Mon 0200 GMT; Mon 1000 CST; Sun 2200 EDT)
Consensus Forecast, Year over Year: 3.3%
After slowing to 12.7 percent in May, year-over-year sales in June are expected to slow substantially to 3.3 percent. Last year’s lockdowns have been greatly distorting sales comparisons.
US Retail Sales for June (Tue 1230 GMT; Tue 0830 EDT)
Consensus Forecast, Month over Month: 0.5%
Consensus Forecast, Ex-Vehicles - M/M: 0.3%
Consensus Forecast, Ex-Vehicles, Ex-Gas - M/M: 0.3%
June sales are expected to rise 0.5 percent versus May’s modest 0.3 percent rise in a report, despite the soft headline, that mostly showed broad and welcome strength.
Canadian CPI for June (Tue 1230 GMT; Tue 0830 EDT)
Consensus Forecast, Month over Month: 0.3%
Consensus Forecast, Year over Year: 3.0%
Canadian CPI Core, Less Food & Energy
Consensus Forecast, Month over Month: 0.3%
Consensus Forecast, Year over Year: 3.7%
After May’s as-expected 3.4 percent rate, which was down a full percentage point from April, consumer prices in June are expected to slow further to 3.0 percent. The core rate, after gains of 0.4 and 4.0 percent, is expected at 0.3 and 3.7 percent.
US Industrial Production for June (Tue 1315 GMT; Tue 0915 EDT)
Consensus Forecast, Month over Month: 0.0%
Consensus Forecast, Manufacturing Output - M/M: 0.0%
Consensus Forecast, Capacity Utilization Rate: 79.5%
Industrial production is expected to be unchanged in June after May’s 0.2 percent decline that was pulled down by mining, specifically energy production. Manufacturing output is expected to be unchanged for a second month in a row.
New Zealand Second-Quarter CPI (Tue 2245 GMT; Wed 1045 NZST; Tue 1845 EDT)
Consensus Forecast, Quarter over Quarter: 0.9%
Consensus Forecast, Year over Year: 5.9%
Consumer prices are expected to rise a quarterly 0.9 percent in the second quarter for a year-over-year rate of plus 5.9 percent. These would compare with respective first-quarter rates of 1.2 and 6.7 percent.
UK CPI for June (Wed 0600 GMT; Wed 0700 BST; Wed 0200 EDT)
Consensus Forecast, Month over Month: 0.4%
Consensus Forecast, Year over Year: 8.2%
Unchanged at 8.7 percent in May, consumer prices in June are expected to ease to 8.2 percent. The monthly rate is seen rising 0.4 percent after May’s 0.7 percent.
UK Retail Sales for June (Wed 0600 GMT; Wed 0700 BST; Wed 0200 EDT)
Consensus Forecast, Year over Year: -1.7%
Retail sales in June are expected to fall 1.7 percent on the year following a 2.1 percent fall in May.
Canadian Housing Starts for June (Wed 1215 GMT; Wed 0815 EDT)
Consensus Forecast, Annual Rate: 216,000
Housing starts are expected to rebound to a 216,000 rate in June versus May’s lower-than-expected 202,494.
US Housing Starts for June (Wed 1230 GMT; Wed 0830 EDT)
Consensus Forecast, Annual Rate: 1.480 million
US Building Permits
Consensus Forecast: 1.489 million
After surging by more than 20 percent in May to 1.631 million, housing starts in June are expected to fall back to a 1.480 million annualized rate that would, nevertheless, be far above April’s 1.340 million rate. Permits, which jumped by more than 5 percent in May to 1.491 million, are expected to hold steady at 1.489 million.
China Loan Prime Rate (Estimated for Thursday, July 20, time not set)
Consensus Change: One-Year Rate: 0 basis points
Consensus Level: 3.55%
Consensus Change: Five-Year Rate: 0 basis points
Consensus Level: 4.20%
The People's Bank of China is not expected to change its loan prime rates, at 3.55 percent for the 1-year rate and 4.20 percent for the 5-year. These rates were last lowered last month, by 10 basis points each.
Japanese Merchandise Trade for June (Wed 2350 GMT; Thu 0850 JST; Wed 1950 EDT)
Consensus Forecast: -¥47.1 billion
Consensus Forecast, Imports Y/Y: -11.3%
Consensus Forecast, Exports Y/Y: 2.0%
A deficit of ¥47.1 billion is the consensus for June’s trade balance versus an as-expected deficit of ¥1,381.9 billion in May. The narrowing reflects expectations for a 2.0 percent year-over-year rise in exports relative to an 11.3 percent decline for imports. Some forecasters expect a small trade surplus.
Australian Labour Force Survey for June (Thu 0130 GMT; Thu 1130 AEST; Wed 2130 EDT)
Consensus Forecast, Employment: 17,000
Consensus Forecast, Unemployment Rate: 3.6
At a consensus rise of 17,000, employment in June is expected to fall back versus May’s much larger-than-expected rise of 75,900. Unemployment is expected to hold at May’s lower-than-expected rate of 3.6 percent.
German PPI for June (Thu 0600 GMT; Thu 0800 CEST; Thu 0200 EDT)
Consensus Forecast, Month over Month: -0.4%
Consensus Forecast, Year over Year: 0.8%
After May’s 1.4 percent monthly fall, June’s PPI is seen falling a further 0.4 percent. Year-over-year, the PPI has cooled for eight consecutive months and is seen edging lower from plus 1.0 percent to plus 0.8 percent.
French Business Climate Indicator for July (Thu 0645 GMT; Thu 0845 CEST; Thu 0245 EDT)
Consensus Forecast: 100
Forecasters see the business climate indicator dipping a further 1 point to 100 in July.
Eurozone: EC Consumer Confidence Flash for July (Thu 1400 GMT; Thu 1600 CEST; Thu 1000 EDT)
Consensus Forecast: -16.3
Consumer confidence in July is expected to fall back 2 tenths to minus 16.3 versus June’s 1.3-point improvement to minus 16.1. This index has been steadily recovering from record lows hit during the third quarter last year.
Japanese Consumer Price Index for June (Thu 2330 GMT; Fri 0830 JST; Thu 1930 EDT)
Consensus Forecast, Year over Year: 3.3%
Consensus Forecast, Ex-Fresh Food; Y/Y: 3.3%
Consensus Forecast, Ex-Fresh Food Ex-Energy; Y/Y: 4.2%
Consumer inflation in June is expected to edge higher to a year-over-year 3.3 percent rate versus an as-expected 3.2 percent in May. Excluding fresh food, the rate is also seen at 3.3 percent and also versus 3.2 percent for May, which was 1 tenth above expectations. When also excluding energy, the rate is seen at 4.2 percent versus May’s 4.3 percent which was also 1 tenth above expectations.
Canadian Retail Sales for May (Fri 1230 GMT; Fri 0830 EDT)
Consensus Forecast, Month over Month: 0.5%
Retail sales in May are expected to rise 0.5 percent following a much stronger-than-expected 1.1 percent increase in April.
|
