|
There are clear trends shared by many economies: strong employment but also weak consumer demand and slowing production. Global inflation data have been moderating but still remain far too high for most – but not all – economies. Another shared trend is monetary policy as central banks, given latitude by the strength of employment, continue to raise rates.
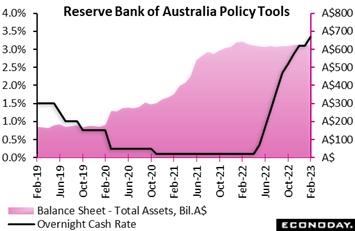 The Reserve Bank of Australia increased its main policy rate, the cash rate, by 25 basis points from 3.10 percent to 3.35 percent, in line with the consensus forecast. What was not expected was a change in the statement which omits that officials are not on a pre-set course. This could suggest that they in fact are, that they wish to strengthen the message that further rate hikes are likely. Australia’s labour market has been strong, especially labor participation at 66.6 percent, reinforcing the bank’s view for further rate increases. The Reserve Bank of Australia increased its main policy rate, the cash rate, by 25 basis points from 3.10 percent to 3.35 percent, in line with the consensus forecast. What was not expected was a change in the statement which omits that officials are not on a pre-set course. This could suggest that they in fact are, that they wish to strengthen the message that further rate hikes are likely. Australia’s labour market has been strong, especially labor participation at 66.6 percent, reinforcing the bank’s view for further rate increases.
Since beginning to normalise policy settings last May the RBA has raised rates at nine consecutive meetings, with the cumulative increase over this period now at 325 basis points. Headline quarterly inflation accelerated to 7.8 percent in the three months to December, its highest level since 1990 and even further above the RBA's target range of 2.0 percent to 3.0 percent.
The statement attributes inflationary pressures to both domestic and global factors. Officials continue to expect headline inflation to moderate over 2023 and to fall to around the top of their target range by mid-2025. They also again note that tighter monetary policy will likely weigh on consumer spending in coming months, with GDP growth expected to slow to around 1.5 percent in both 2023 and 2024. They also caution, however, that household finances are likely to come under further pressure, that the outlook for the global economy is uncertain, and that domestic wage growth is likely to pick up as the labour market remains tight, creating upside risk for the inflation outlook.
Officials have reaffirmed their determination to return inflation to the target range and have again promised they "will do what is necessary to achieve that". They warn, however, that this determination to subdue inflationary pressures will present risks to the growth outlook, reiterating that the "the path to achieving a soft landing remains a narrow one".
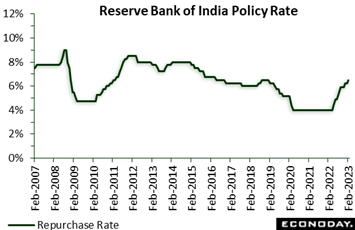 The Reserve Bank of India also increased its policy rate by 25 basis points, from 6.25 percent to 6.50 percent also in line with the consensus forecast. This rate has now been increased by a cumulative 250 basis points since the initial rate hike last April as part of efforts to subdue inflationary pressures. A majority of committee members again pledged to focus on the "withdrawal of accommodation to ensure that inflation remains within the target going forward, while supporting growth." The Reserve Bank of India also increased its policy rate by 25 basis points, from 6.25 percent to 6.50 percent also in line with the consensus forecast. This rate has now been increased by a cumulative 250 basis points since the initial rate hike last April as part of efforts to subdue inflationary pressures. A majority of committee members again pledged to focus on the "withdrawal of accommodation to ensure that inflation remains within the target going forward, while supporting growth."
Data released since the RBI's previous meeting in early December have shown further moderation in price pressures, though headline inflation remains well above the mid-point of the RBI's target range of 2.0 percent to 6.0 percent. Inflation fell from 6.77 percent in October to 5.88 percent in November and 5.72 percent in December, with January data scheduled for release in the coming week. In the statement accompanying February’s decision, RBI officials note that the recent fall in inflation mainly reflects vegetable prices, with core inflation pressures remaining high. They forecast headline inflation will remain between 5.0 percent and 6.0 percent for the rest of the current fiscal year (ending March) and throughout the next fiscal year, with risks to this forecast considered to be evenly balanced. Officials, meanwhile, expect domestic economic activity to "remain resilient", supported by fiscal policy and solid consumer and business sentiment.
Reflecting this assessment, officials have decided that "further calibrated monetary policy action is warranted" to "break core inflation persistence". They also judge that this action will support medium-term growth prospects. Officials again promised to "remain focused" on withdrawing policy accommodation, suggesting they consider further rate increases will likely be warranted in upcoming meetings.
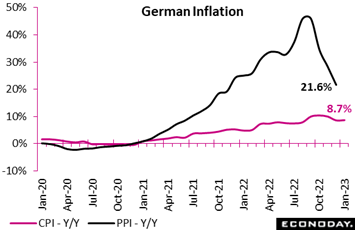 Consumer prices posted a provisional 1.0 percent monthly increase in January, matching the market consensus. The rise lifted the annual inflation rate from December's final 8.6 percent to 8.7 percent, its first increase since October but still its second lowest level since last August. Note that January's update uses a new 2020 base year versus 2015 previously. Consumer prices posted a provisional 1.0 percent monthly increase in January, matching the market consensus. The rise lifted the annual inflation rate from December's final 8.6 percent to 8.7 percent, its first increase since October but still its second lowest level since last August. Note that January's update uses a new 2020 base year versus 2015 previously.
The flash harmonised reading (HICP) was a good deal softer, increasing only 0.5 percent versus December to reduce its yearly change from 9.6 percent to 9.2 percent. This is still fully 7.2 percentage points above the ECB's target but well down from October's record 11.6 percent. No information about sectoral performances was available in January's report, detail that will be released as part of the final data on February 22nd.
January’s update on German producer prices will be posted two days before, on February 20th. The accompanying graph shows December’s result, at a year-over-year 21.6 percent which, however severe, was down 6.5 percentage points from November and is half the rate of August and September.
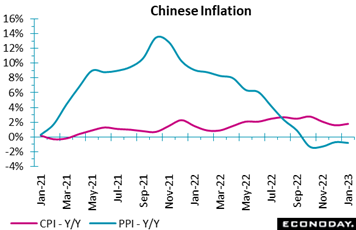 Producer price inflation in China hasn’t been slowing, its been in outright contraction the last four reports! This while consumer prices have come in below Econoday’s consensus the last four reports, at an ideally benign 2.1 percent in January though up from an arguably too benign 1.8 percent in December. January showed a stronger increase in food prices, up 6.2 percent on the year after advancing 4.8 percent previously. The year-over-year increase in non-food prices also picked up, from 1.1 percent to 1.2 percent. The core CPI, excluding food and energy prices, rose 1.0 percent on the year, up from the 0.7 percent increase recorded previously and its highest since June 2022. Turning back to producer prices, they fell 0.8 percent on the year in January after dropping 0.7 percent in December, weaker than the consensus for a decline of 0.5 percent. The index fell 0.4 percent on the month after falling 0.5 percent previously. Producer price inflation in China hasn’t been slowing, its been in outright contraction the last four reports! This while consumer prices have come in below Econoday’s consensus the last four reports, at an ideally benign 2.1 percent in January though up from an arguably too benign 1.8 percent in December. January showed a stronger increase in food prices, up 6.2 percent on the year after advancing 4.8 percent previously. The year-over-year increase in non-food prices also picked up, from 1.1 percent to 1.2 percent. The core CPI, excluding food and energy prices, rose 1.0 percent on the year, up from the 0.7 percent increase recorded previously and its highest since June 2022. Turning back to producer prices, they fell 0.8 percent on the year in January after dropping 0.7 percent in December, weaker than the consensus for a decline of 0.5 percent. The index fell 0.4 percent on the month after falling 0.5 percent previously.
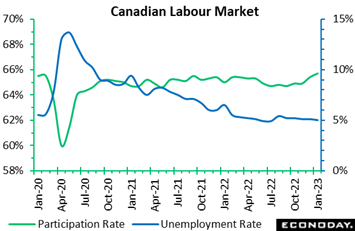 Employment data across the major economies have been consistently strong. Canadian employment in January jumped 150,000 following 104,000 in December, both of which were far stronger than expected. The unemployment rate remained steady at 5.0 percent, below the 5.2 percent consensus, all this with a participation rate that increased to 65.7 percent from 65.4 percent. Employment data across the major economies have been consistently strong. Canadian employment in January jumped 150,000 following 104,000 in December, both of which were far stronger than expected. The unemployment rate remained steady at 5.0 percent, below the 5.2 percent consensus, all this with a participation rate that increased to 65.7 percent from 65.4 percent.
While the headline number, which coincides with large gains in the US as well, would call for the Bank of Canada to perhaps reconsider its pausing mode earlier rather than later, inflation data appear relatively tame compared to the pace of hiring. Average hourly wages were up 4.5 percent year-over-year, but this is down from 4.8 percent in December.
The fifth consecutive monthly employment gain, and the largest since February 2022, was led by full-time employment, which was up 121,100 with part-time up 28,900. The private sector was behind most of the strength, with 114,700 positions created, while the public sector added 31,500 jobs. Self-employment was up 3,700 in January.
Both goods-producing industries and services added jobs in January, with gains of 25,400 and 124,700, respectively. Construction was particularly strong, with 15,800 jobs created, more than twice the 7,300 positions added in the manufacturing sector. All main goods-producing industries added jobs on the month, except for a 3,700 drop in agriculture.
Within services, wholesale and retail trade added 58,700 jobs, health care and social assistance 40,000, educational services 18,400 and accommodation and food services 12,400. Overall, gains in 6 of 11 sectors far outpaced declines in other categories, led by a 16,600 decrease in transportation and warehousing. Regionally, Ontario, Quebec and Alberta led employment gains in January, with increases of 63,000, 47,000 and 21,000, respectively.
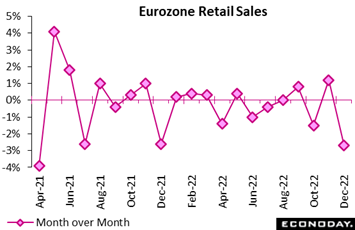 Strength in employment has not, however, resulted in strength for consumer demand which is soft on the global scale. The retail sector in the Eurozone had a particularly poor end to 2022. Having risen 1.2 percent on the month in November, volume sales dropped fully 2.7 percent. Although only slightly steeper than the market consensus, this was their worst performance since April 2021 and, but for positive base effects, annual growth would have been a lot more negative than the actual minus 2.8 percent print. Strength in employment has not, however, resulted in strength for consumer demand which is soft on the global scale. The retail sector in the Eurozone had a particularly poor end to 2022. Having risen 1.2 percent on the month in November, volume sales dropped fully 2.7 percent. Although only slightly steeper than the market consensus, this was their worst performance since April 2021 and, but for positive base effects, annual growth would have been a lot more negative than the actual minus 2.8 percent print.
Moreover, December's slump reflected broad-based weakness. Hence, food, drink and tobacco purchases were down a monthly 2.9 percent and, excluding auto fuel, non-food was off 2.6 percent. Auto fuel declined 2.3 percent.
Regionally, Germany (minus 5.3 percent) dominated the headline monthly slide but there were also losses in France (minus 1.0 percent) and Spain (minus 1.4 percent). Elsewhere, most other member states also saw declines.
The December setback leaves fourth quarter Eurozone sales 1.1 percent below their third quarter level. Consumer confidence at least appears to have stabilized in recent months but with buying intentions still very soft, prospects for the current quarter do not look bright.
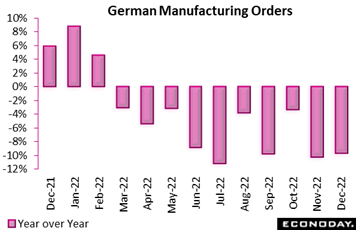 Production data, like consumer demand, have also been less than strong. Though manufacturing orders in Germany jumped 3.2 percent on the month in December, this failed to reverse November’s 4.4 percent drop. Annual growth was a lowly minus 9.6 percent, albeit up from minus 10.2 percent. Orders are at their second weakest level since August 2020. Production data, like consumer demand, have also been less than strong. Though manufacturing orders in Germany jumped 3.2 percent on the month in December, this failed to reverse November’s 4.4 percent drop. Annual growth was a lowly minus 9.6 percent, albeit up from minus 10.2 percent. Orders are at their second weakest level since August 2020.
Domestic demand rose a solid 5.7 percent on the month, its first increase since September and now stands at its highest mark since last June. The overseas market expanded a smaller 1.2 percent (although Eurozone was up 9.8 percent) and only dented the previous period's 6.9 percent slump. New orders for intermediates jumped 9.7 percent but capital goods were only flat and consumer goods fell 3.3 percent.
The partial December rebound leaves fourth quarter orders 4.0 percent below the previous period and so points to a still subdued outlook for industrial production which, in separate data released later in the week, proved much weaker than expected in December. A 3.1 percent monthly drop was nowhere near the market consensus, the steepest decline since last March and cut annual growth from minus 0.6 percent to minus 4.2 percent. Indeed, production was some 8.6 percent short of its pre-pandemic level in February 2020.
Manufacturing output fared slightly better but still fell a monthly 2.1 percent. This was on the back of a 5.8 percent slump in intermediates within which chemicals were especially soft. Capital goods were flat while consumer goods actually rose 0.3 percent. Elsewhere, energy was down 2.3 percent and construction a probably weather-impacted 8.0 percent.
December's setback means total industrial production has fallen in four of the last six months and is now, like manufacturing orders, at its lowest level since August 2020. It also means that fourth quarter production declined 0.7 percent versus the previous period, implying another hit to real GDP growth. Moreover, with orders still trending lower, the current quarter may not be much better.
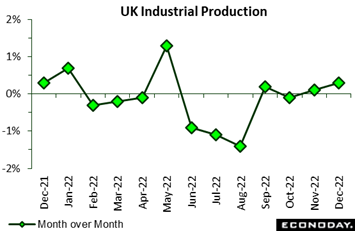 Goods production in the UK was stronger than expected in December. A 0.3 percent monthly increase followed a 0.1 percent gain in November and was well above the market consensus. Annual growth improved from minus 4.3 percent to minus 4.0 percent but production was still 1.4 percent below its pre-Covid level in February 2020. Goods production in the UK was stronger than expected in December. A 0.3 percent monthly increase followed a 0.1 percent gain in November and was well above the market consensus. Annual growth improved from minus 4.3 percent to minus 4.0 percent but production was still 1.4 percent below its pre-Covid level in February 2020.
Manufacturing was less robust and output here was only unchanged versus November when it declined 0.6 percent. Fully seven of its 13 subsectors made negative contributions notably food, drink and tobacco which fell 1.0 percent. Mainly offsetting this decline was pharmaceuticals which were up 2.0 percent.
Elsewhere, overall goods production was boosted by a 5.2 percent jump in electricity, gas, steam and air conditioning alongside a 0.7 percent increase in total water supply. Oil and gas extraction fell 5.3 percent.
December’s update leaves fourth quarter industrial production 0.2 percent below its level in the third quarter when it declined 2.6 percent. Output has decreased every quarter since the three months to September 2021. Quarterly manufacturing output was flat, avoiding negative growth for the first time since the second quarter of 2021. The current quarter is likely to see another decline in both series.
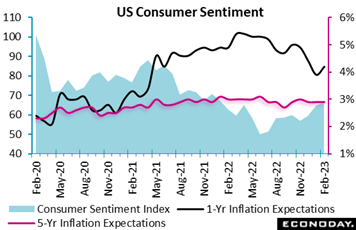 Sentiment readings have also been depressed but have shown some life in recent months. The preliminary University of Michigan consumer sentiment index for February rose to 66.4 after 64.9 in January. The consensus in an Econoday survey was 65.0. The better-than-expected reading for February reflects an improvement in current conditions and fairly stable consumer expectations. Nonetheless, consumers remain pessimistic about the economy. Sentiment readings have also been depressed but have shown some life in recent months. The preliminary University of Michigan consumer sentiment index for February rose to 66.4 after 64.9 in January. The consensus in an Econoday survey was 65.0. The better-than-expected reading for February reflects an improvement in current conditions and fairly stable consumer expectations. Nonetheless, consumers remain pessimistic about the economy.
The index for current conditions rose to 72.6 in February after 68.4 in January. Although consumers faced some increases in prices for food and energy, the labor market offered some reassurance that the economy will continue to grow, although uncertainty is high.
The index of consumer expectations was little changed at 62.3 in February after 62.7 in January. This suggests that the risks to the outlook for households have not been alleviated despite ongoing strength in the labor market and continuing wage gains.
The 1-year inflation expectations rose 3 tenths to 4.2 percent in February though 5-year expectations was unchanged at a favorable 2.9 percent where it has now been for three months in row. Outside of some short-term price volatility, consumers' inflation outlook is stable. This is a positive for the Federal Reserve as it considers monetary policy and its credibility as an inflation fighter.
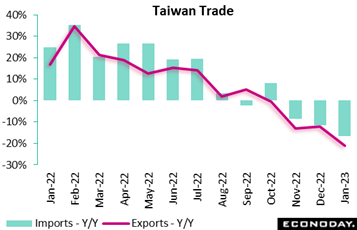 One note of alarm in the global data is steep contraction appearing in many Asian trade reports, the result of weakening chip demand. Taiwan's trade surplus narrowed from $4.79 billion in December to $2.34 billion in January. Exports fell 21.2 percent on the year after falling 12.1 percent previously, while imports fell 16.6 percent after a previous decline of 11.4 percent. PMI survey data published in the prior week showed Taiwan's manufacturing sector contracted for the eighth consecutive month in January. One note of alarm in the global data is steep contraction appearing in many Asian trade reports, the result of weakening chip demand. Taiwan's trade surplus narrowed from $4.79 billion in December to $2.34 billion in January. Exports fell 21.2 percent on the year after falling 12.1 percent previously, while imports fell 16.6 percent after a previous decline of 11.4 percent. PMI survey data published in the prior week showed Taiwan's manufacturing sector contracted for the eighth consecutive month in January.
Exports of electronic components fell 20.1 percent on the year in December after dropping 1.3 percent in November, while exports of information, communication and audio-video products declined 10.4 percent after a fall of 10.7 percent previously. Exports to mainland China and Hong Kong were particularly weak, down 33.5 percent on the year after falling 16.4 percent previously, while year-over-year growth in exports to the United States dropped 14.5 percent after a previous fall of 2.6 percent. Petroleum imports fell 1.8 percent on the year after increasing 4.4 percent previously, while imports from mainland China and Hong Kong fell 26.9 percent, little changed from the previous decline of 27.0 percent.
Canada has consistently outperformed expectations the last four months in row with the latest employment report adding to the run of strength. Econoday’s Consensus Divergence Index is at 11 while the index excluding prices (ECDI-P) is at 21. The US’s performance, at least so far this year, has also been strong, at 19 on both the ECDI and ECDI-P
In the Eurozone, last week’s limited supply of data left intact the period of outperformance that began at the start of January. However, at 15 and 3 respectively, both the ECDI and ECDI-P are now at their lowest level over the period.
UK economic data have been underperforming for some while but the week’s releases at least boosted the ECDI to minus 1 and the ECDI-P to minus 5. Both readings are close enough to zero to indicate that overall economic activity is now moving broadly in line with market expectations.
In Switzerland, the ECDI (minus 5) and ECDI-P (2) remain close enough to zero to indicate no significant surprises in the most recent data.
Much the same applies to Japan where both the ECDI (minus 2) and ECDI-P (3) are also within touching distance of zero. In contrast, Chinese economic activity remains easily on the firm side of forecasts and the ECDI (29) would be further in positive surprise territory but for downside shocks on prices. The ECDI-P is still very high at 60.
**Contributing to this article were Jeremy Hawkins, Brian Jackson, Mace News, Max Sato, and Theresa Sheehan
Tuesday’s CPI from the US, amid expectations for modest moderation, will be the week’s most market-moving indicator. Modest moderation is also the expectation for Wednesday’s CPI from the UK, while steady results are expected from Switzerland’s CPI on Monday and acceleration for India’s CPI on Tuesday.
US producer prices on Thursday, like the CPI, are also expected to moderate in contrast to retail sales on Wednesday which, after poor showings in the holiday months of November and December, are expected to have rebounded in January. US industrial production is also expected to have rebound in data also on Thursday; mixed results are the expectations for housing starts on Thursday.
Canadian housing starts will be posted on Wednesday as will Canadian manufacturing sales. Note that Canada has consistently outperformed on the Econoday Consensus Divergence Index indicating that the country’s economic data have been consistently beating expectations.
Data from Japan will be led on Tuesday by the first estimate for fourth quarter GDP, where tangible growth is expected, followed on Thursday by merchandise trade and machinery orders. Other data to watch will include Eurozone industrial production on Wednesday and Australia’s Labour Force Survey on Thursday.
Swiss CPI for January (Mon 0730 GMT; Mon 0830 CET; Mon 0230 EST)
Consensus Forecast, Month over Month: 0.6%
Consensus Forecast, Year over Year: 2.8%
A 2.8 percent annual rate is expected for January consumer prices which would match December’s rate.
Japanese Fourth-Quarter GDP, First Estimate (Mon 2350 GMT; Tue 0850 JST; Mon 1850 EST)
Consensus Forecast, Quarter over Quarter: 0.5%
Consensus Forecast, Annualized Rate: 1.9%
GDP for the fourth quarter is expected to rise a quarterly 0.5 percent and rise 1.9 percent on an annualized basis. These would compare with respective third-quarter contraction of 0.2 and 0.8 percent. Net exports are seen pushing up fourth-quarter GDP while capital investment and private inventories are expected to show pullbacks.
UK Labour Market Report (Tue 0700 GMT; Tue 0200 EST)
Consensus Forecast, ILO Unemployment Rate for three months to December: 3.7%
The ILO unemployment rate for the three months to December is expected to hold steady at the 3.7 percent of the prior two reports.
Indian CPI for January (Tue 1200 GMT; Tue 1730 IST; Tue 0700 EST)
Consensus Forecast, Year over Year: 5.94%
Consumer prices are expected to accelerate to 5.94 percent on the year in January versus 5.72 percent in December.
US CPI for January (Tue 1330 GMT; Tue 0830 EST)
Consensus Forecast, Month over Month: 0.5%
Consensus Forecast, Year over Year: 6.2%
US CPI Core, Less Food & Energy
Consensus Forecast, Month over Month: 0.3%
Consensus Forecast, Year over Year: 5.5%
January’s monthly core rate is expected to hold at December’s as-expected and moderate 0.3 percent. Overall prices are expected to rise 0.5 percent to offset December’s 0.1 percent decline. Annual rates, at 6.5 percent overall in December and 5.7 percent for the core, are expected to moderate to 6.2 and 5.5 percent.
UK CPI for January (Wed 0700 GMT; Wed 0200 EST)
Consensus Forecast, Month over Month: -0.4%
Consensus Forecast, Year over Year: 10.3%
Consumer prices are expected to decrease 0.4 percent on the month in January for a 10.3 year-over-year rate. Pressures in December, at a 10.5 percent annual rate, remained severe but at least weren’t more severe than expected.
Eurozone Industrial Production for December (Wed 1000 GMT; Wed 1100 CET; Wed 0500 EST)
Consensus Forecast, Month over Month: -0.9%
Consensus Forecast, Year over Year: -0.6%
Production in December, after rebounding 1.0 percent in November, is expected to reverse with a monthly decline of 0.9 percent. The year-over-year rate is seen falling to minus 0.6 percent from 2.0 percent growth.
Canadian Housing Starts for January (Wed 1315 GMT; Wed 0815 EST)
Consensus Forecast, Annual Rate: 235,000
Housing starts are expected to slow to 235,000 in January versus 248,625 in December.
US Retail Sales for January (Wed 1330 GMT; Wed 0830 EST)
Consensus Forecast, Month over Month: 1.7%
Consensus Forecast, Ex-Vehicles - M/M: 0.7%
Consensus Forecast, Ex-Vehicles, Ex-Gas - M/M: 0.5%
Sales contractions in the heavy holiday months of November and December were deeper than expected, at 1.0 and 1.1 percent respectively. January, which by contrast is the lightest sales month of the year, is expected to rebound 1.7 percent.
Canadian Manufacturing Sales for December (Wed 1330 GMT; Wed 08:30 EST)
Consensus Forecast, Month over Month: -1.8%
Manufacturing sales are expected to fall 1.8 percent in December after showing no change in November.
US Industrial Production for January (Wed 1415 GMT; Wed 0915 EST)
Consensus Forecast, Month over Month: 0.5%
Consensus Forecast, Manufacturing Output - M/M: 0.4%
Consensus Forecast, Capacity Utilization Rate: 79.1%
Industrial production has been falling into contraction and deeply so in December, at a monthly decline of 0.7 percent overall and 1.3 percent for manufacturing. January’s consensus estimates are respective monthly gains of 0.5 and 0.4 percent.
Japanese Merchandise Trade for January (Wed 2350 GMT; Thu 0850 JST; Wed 1850 EST)
Consensus Forecast: -¥3,870 billion
Consensus Forecast, Imports Y/Y: 19.9%
Consensus Forecast, Exports Y/Y: -0.1%
A deficit of ¥3,870 is the consensus for January’s trade balance versus a deficit of ¥1,452 billion in December. A consensus 0.1 percent year-over-year decline in exports is expected to reflect slowing global demand and suspended shipments during the Lunar New Year holidays.
Japanese Machinery Orders for December (Wed 2350 GMT; Thu 0850 JST; Wed 1850 EST)
Consensus Forecast, Month over Month: 2.8%
Consensus Forecast, Year over Year: -5.9%
Machinery orders are expected to rise 2.8 percent in December for year-over-year contraction of 5.9 percent. The monthly gain would follow a steep 8.3 percent monthly drop in November. Last month, the Cabinet Office maintained its assessment that "the move toward a pickup in machinery orders has paused."
Australian Labour Force Survey for January (Thu 0030 GMT; Thu 1130 AEDT; Thu 1930 EST)
Consensus Forecast, Employment: 20,000
Consensus Forecast, Unemployment Rate: 3.5%
Employment is expected to remain strong and steady in January, rising an estimated 20,000 versus a 14,600 decline in December which was weaker than expected. The unemployment rate is expected to hold steady at 3.5 percent.
US Housing Starts for January (Thu 1330 GMT; Thu 0830 EST)
Consensus Forecast, Annual Rate: 1.368 million
US Building Permits
Consensus Forecast: 1.350 million
January’s annualized rates are expected at 1.368 million for starts and 1.350 for permits which would compare with 1.382 and 1.330 million in December. Starts and permits have been in steady decline.
US PPI-FD for January (Thu 1330 GMT; Thu 0830 EST)
Consensus Forecast, Month over Month: 0.4%
Consensus Forecast, Year over Year: 5.5%
US PPI-FD, Less Food & Energy
Consensus Forecast, Month over Month: 0.3%
Consensus Forecast, Year over Year: 5.0%
Producer prices in January are expected to rise 0.4 percent on the month for a year-over-year increase of 5.5 percent that would compare with 6.2 percent in December. The annual core rate in January is also seen moderating, to 5.0 percent versus December’s 5.5 percent.
|
