|
For those who own stocks and bonds and bitcoins and houses, worries are few. But for those less enriched by two years of zero interest rates and official asset purchases, 7-1/2 percent inflation is an awful lot. That's what last year's rate was in the US, a 40-year high which compares with a median age in the US of 38 years, meaning that a very substantial proportion of Americans have never seen anything like this. Inflation is still a quarter short of 10 percent but at monthly clips of 1/2 percent and more, the double-digit zone may be fast approaching. Inflation of course can have immediate political and social outcomes, fanning through history revolutions and reactions that bring the public out into the street, evidenced just last month after fuel hikes in Kazakhstan. Inflation in Canada, though ending last year at a 30-year high, isn't part of the trucker unrest unlike, however, the effects of the unrest which may be turning just-in-time inventories to not-in-time inventories. But that will be a special effect for consumer price reports in February; we begin this week with the US report for January.
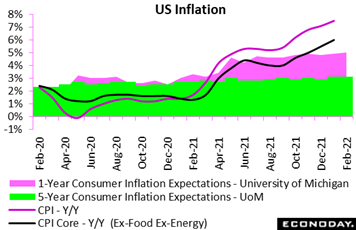 Month after month headline inflation has been more heated than expected and was again in January, up 0.6 percent versus December and 4 tenths higher on the year at 7.5 percent. Core CPI, excluding food and energy, also rose 0.6 percent on the month and was up 5 tenths on the year to 6.0 percent. Pressure once again was widespread. Both food and energy prices jumped a monthly 0.9 percent, the latter boosted by a severe cold spell through much of the country that pushed fuel oil up 9.5 percent. Outside the core, prices for new cars were steady in January but not for used cars where prices rose another 1.5 percent. Apparel prices jumped 1.1 percent for a second month in a row, medical commodities rose 0.9 percent and medical services 0.6 percent. Rents climbed 0.5 percent for a yearly 3.8 percent, with owners' equivalent rate at 0.4 percent and 4.1 percent. Price increases will continue to threaten both consumer sentiment and inflation expectations. Month after month headline inflation has been more heated than expected and was again in January, up 0.6 percent versus December and 4 tenths higher on the year at 7.5 percent. Core CPI, excluding food and energy, also rose 0.6 percent on the month and was up 5 tenths on the year to 6.0 percent. Pressure once again was widespread. Both food and energy prices jumped a monthly 0.9 percent, the latter boosted by a severe cold spell through much of the country that pushed fuel oil up 9.5 percent. Outside the core, prices for new cars were steady in January but not for used cars where prices rose another 1.5 percent. Apparel prices jumped 1.1 percent for a second month in a row, medical commodities rose 0.9 percent and medical services 0.6 percent. Rents climbed 0.5 percent for a yearly 3.8 percent, with owners' equivalent rate at 0.4 percent and 4.1 percent. Price increases will continue to threaten both consumer sentiment and inflation expectations.
Speaking of inflation expectations, they remain highly elevated, up 1 tenth for the year-ahead outlook to 5.0 percent and steady at 3.1 percent for the 5-year outlook. The latter will help quiet the nerves at the Federal Reserve, suggesting that consumers don't yet think the pressures are baked into the cake. Not helping anyone's nerves, however, were the overall results of the University of Michigan's February report where the index fell 5.5 points to an 11-year low and thoroughly miserable 61.7. This was well below low-end expectations with inflation and its threat to income to blame. In spite of a strong labor market, consumers are seeing shortages on store shelves and higher prices at the cash register. The ringing sounds you hear are the alarm bells at the Fed.
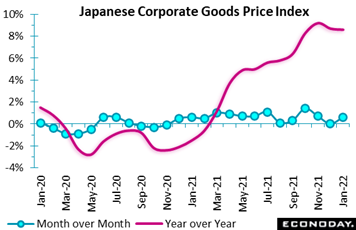 Prices at the producer level offer indications of what to expect at the consumer level. Japan's corporate goods price index hit a four-decade high of its own in November, at 9.2 percent and has since been easing, to 8.7 percent in December and 8.6 percent in January. The direction is welcome though still tentative while the monthly rate, at 0.6 percent, is very high. The monthly increase was due to higher prices for refined petroleum products (gasoline, kerosene and heavy fuel oil) as well as electric power and non-ferrous metals. The consumer level in Japan, however, is another story, rising at no more than a snail's pace. Bank of Japan policymakers project the annual consumer inflation rate will rise to just above 1 percent in the next two years, only a halfway point toward the bank's 2 percent target. Prices at the producer level offer indications of what to expect at the consumer level. Japan's corporate goods price index hit a four-decade high of its own in November, at 9.2 percent and has since been easing, to 8.7 percent in December and 8.6 percent in January. The direction is welcome though still tentative while the monthly rate, at 0.6 percent, is very high. The monthly increase was due to higher prices for refined petroleum products (gasoline, kerosene and heavy fuel oil) as well as electric power and non-ferrous metals. The consumer level in Japan, however, is another story, rising at no more than a snail's pace. Bank of Japan policymakers project the annual consumer inflation rate will rise to just above 1 percent in the next two years, only a halfway point toward the bank's 2 percent target.
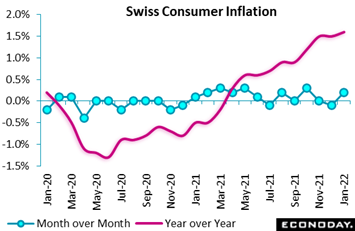 Switzerland, like Japan, is another economy where consumer price pressures are subdued. Yet Swiss prices, up 1 tenth in January to 1.6 percent, are at a 14-year high. The monthly rate was up 0.2 percent split between a 0.3 percent rise for domestic prices offset by a 0.1 percent drop in import prices, the latter continuing to be biased down by the strength of the Swiss franc. Turning to spending categories, the main boost to the headline monthly change came from housing and energy (1.0 percent) as well as a seasonal bounce in restaurants and hotel charges (2.3 percent). However, clothing and footwear (minus 7.5 percent) saw their usual January decline. As a result, core prices (excluding unprocessed food and energy) fell a monthly 0.2 percent, leaving the annual underlying rate unchanged at only 0.8 percent. January's CPI update shows that, in contrast to most of Europe not to mention the US, inflationary pressures in Switzerland remain well contained. Switzerland, like Japan, is another economy where consumer price pressures are subdued. Yet Swiss prices, up 1 tenth in January to 1.6 percent, are at a 14-year high. The monthly rate was up 0.2 percent split between a 0.3 percent rise for domestic prices offset by a 0.1 percent drop in import prices, the latter continuing to be biased down by the strength of the Swiss franc. Turning to spending categories, the main boost to the headline monthly change came from housing and energy (1.0 percent) as well as a seasonal bounce in restaurants and hotel charges (2.3 percent). However, clothing and footwear (minus 7.5 percent) saw their usual January decline. As a result, core prices (excluding unprocessed food and energy) fell a monthly 0.2 percent, leaving the annual underlying rate unchanged at only 0.8 percent. January's CPI update shows that, in contrast to most of Europe not to mention the US, inflationary pressures in Switzerland remain well contained.
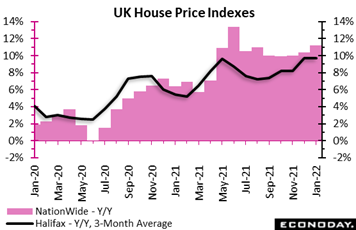 Inflation for housing has been one of the most salient and arguably ominous features of the pandemic, ominous due to its social and economic implications for renters and ominous because what goes up can go down. For once, the UK's Halifax house price index came in below expectations, rising only 0.3 percent on the month in January for the smallest gain since last June and less than half the market consensus. Even so, this was the seventh successive increase and large enough to leave annual inflation (as tracked in the black line of the graph) unchanged at a heady 9.7 percent. Supply shortages continue to underpin prices but with signs that transaction volumes are easing back towards more normal levels, mortgage rates on the way up and household budgets under pressure, there is good reason for supposing that house price inflation will decelerate over coming months. Halifax's report was rather weaker than its Nationwide counterpart released earlier this month but the surveys together hint at some cooling in prices. Inflation for housing has been one of the most salient and arguably ominous features of the pandemic, ominous due to its social and economic implications for renters and ominous because what goes up can go down. For once, the UK's Halifax house price index came in below expectations, rising only 0.3 percent on the month in January for the smallest gain since last June and less than half the market consensus. Even so, this was the seventh successive increase and large enough to leave annual inflation (as tracked in the black line of the graph) unchanged at a heady 9.7 percent. Supply shortages continue to underpin prices but with signs that transaction volumes are easing back towards more normal levels, mortgage rates on the way up and household budgets under pressure, there is good reason for supposing that house price inflation will decelerate over coming months. Halifax's report was rather weaker than its Nationwide counterpart released earlier this month but the surveys together hint at some cooling in prices.
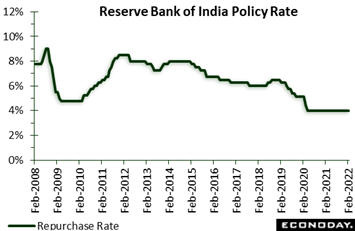 Global monetary policy continues to look uneven. Some banks are worried about wage-push inflation and are withdrawing stimulus as fast as they can (the Fed and Bank of England), one bank is adding new stimulus as fast as it can (People's Bank of China), and others are playing waiting moves hoping that inflation will slow, the latter group led by the European Central Bank and including the Reserve Bank of India. The RBI, as expected, left its benchmark repurchase rate unchanged at 4.0 percent with officials again vowing to keep policy accommodative "as long as necessary" to support economic growth and mitigate the economic impact of the pandemic. In fact the RBI, faced with new Covid effects, is growing more concerned with the pace of activity than they were at their last meeting in early December. Then they argued that "the recovery in domestic economic activity is turning increasingly broad-based" but they now consider that the "recovery in domestic economic activity is yet to be broad-based". India's index of industrial production, also released during the week, rose just 0.4 percent on the year in December after increasing 1.4 percent in November. This is the weakest growth since February 2021. This follows the release of PMI reports that, hit by Omicron and the reinstatement of curfews, showed weaker levels of demand and moderating conditions for both manufacturing and services. Global monetary policy continues to look uneven. Some banks are worried about wage-push inflation and are withdrawing stimulus as fast as they can (the Fed and Bank of England), one bank is adding new stimulus as fast as it can (People's Bank of China), and others are playing waiting moves hoping that inflation will slow, the latter group led by the European Central Bank and including the Reserve Bank of India. The RBI, as expected, left its benchmark repurchase rate unchanged at 4.0 percent with officials again vowing to keep policy accommodative "as long as necessary" to support economic growth and mitigate the economic impact of the pandemic. In fact the RBI, faced with new Covid effects, is growing more concerned with the pace of activity than they were at their last meeting in early December. Then they argued that "the recovery in domestic economic activity is turning increasingly broad-based" but they now consider that the "recovery in domestic economic activity is yet to be broad-based". India's index of industrial production, also released during the week, rose just 0.4 percent on the year in December after increasing 1.4 percent in November. This is the weakest growth since February 2021. This follows the release of PMI reports that, hit by Omicron and the reinstatement of curfews, showed weaker levels of demand and moderating conditions for both manufacturing and services.
As far as inflation goes, India's headline rate rose to a five-month high of 5.59 percent in December, close to the top of the RBI's target range of 2.0 to 6.0 percent. Yet officials said the increase largely reflected a comparison effect with weakness in year-ago food prices along with ongoing strength for fuel. Officials still expect headline inflation to remain within their target range for the rest of this fiscal year and to fall over the first half of the next fiscal year starting in April. This suggests that the RBI's preference is to keep policy rates on hold as long as headline inflation remains at current levels. Watch for India's January consumer price report first thing Monday (where a test of the RBI's target range is expected).
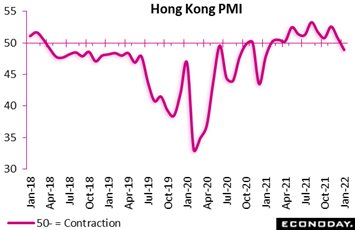 Omicron effects are not only clouding India's outlook but also China and Hong Kong as well, the latter announcing on Tuesday the most severe restrictions yet including limits on private gatherings. Hong Kong's economy was already suffering through the month of January as the city's PMI fell into contraction, down more than 2 points to 48.9 for the first sub-50 showing in nearly a year. Respondents reported declines in output and orders with demand from mainland China weakening sharply. Respondents did report a small increase in payrolls but the survey's measure of business confidence fell to a 12-month low. Omicron effects are not only clouding India's outlook but also China and Hong Kong as well, the latter announcing on Tuesday the most severe restrictions yet including limits on private gatherings. Hong Kong's economy was already suffering through the month of January as the city's PMI fell into contraction, down more than 2 points to 48.9 for the first sub-50 showing in nearly a year. Respondents reported declines in output and orders with demand from mainland China weakening sharply. Respondents did report a small increase in payrolls but the survey's measure of business confidence fell to a 12-month low.
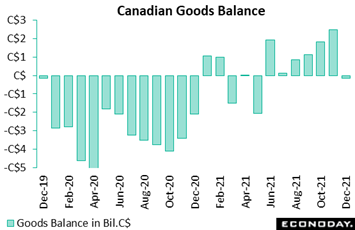 Omicron effects elsewhere are largely fading, whether in Europe or North America. Data from Canada have nevertheless been underperforming expectations, and substantially so based on Econoday's measure (see "bottom line" below). Instead of posting an expected C$2.1 billion surplus in December, Canada's merchandise trade balance was in marginal deficit at $0.1 billion, the result of a monthly jump in cellphone imports that fed a 3.7 percent overall jump in imports. Yet exports didn't help any, falling 0.9 percent on the month. Exports were pushed down by energy which fell 5.9 percent for the first decline since April and reflecting a monthly downturn in prices. In a plus, non-energy exports rose 0.7 percent, boosted by consumer goods and specifically pharmaceuticals that included Covid medications. StatCan cited up-and-down supply chain disruptions as a special factor distorting cellphone measures, a factor that, for right now at least, could take on wider dimensions. Omicron effects elsewhere are largely fading, whether in Europe or North America. Data from Canada have nevertheless been underperforming expectations, and substantially so based on Econoday's measure (see "bottom line" below). Instead of posting an expected C$2.1 billion surplus in December, Canada's merchandise trade balance was in marginal deficit at $0.1 billion, the result of a monthly jump in cellphone imports that fed a 3.7 percent overall jump in imports. Yet exports didn't help any, falling 0.9 percent on the month. Exports were pushed down by energy which fell 5.9 percent for the first decline since April and reflecting a monthly downturn in prices. In a plus, non-energy exports rose 0.7 percent, boosted by consumer goods and specifically pharmaceuticals that included Covid medications. StatCan cited up-and-down supply chain disruptions as a special factor distorting cellphone measures, a factor that, for right now at least, could take on wider dimensions.
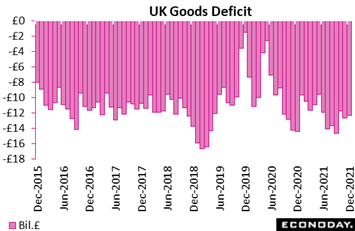 Sticking to trade and turning to the UK, the unfolding of measurable Brexit effects will have leavers and remainers keeping closer and closer score. The global deficit on goods trade narrowed slightly to a smaller than expected £12.35 billion in December versus £12.70 billion in November. The modest improvement reflected a 3.1 percent monthly rise in exports that more than offset a 1.4 percent gain in imports. The decline in the headline deficit was wholly attributable to a reduced bilateral shortfall with the EU. This was down from £5.47 billion in November to £4.48 billion, the smallest deficit since April 2020. Exports jumped 7.2 percent while imports were only flat. At the same time, the red ink with the rest of the world expanded from £7.23 billion to £7.88 billion, a 3-month high as exports fell 0.4 percent and imports rose 2.5 percent. However, over the fourth quarter, exports to the EU were up 11.2 percent, versus a 21.7 percent increase to the rest of the world while imports from the EU fell 0.7 percent but rose 5.7 percent from the rest of the world. In other words, Brexit continues to dampen UK-EU trade flows. Sticking to trade and turning to the UK, the unfolding of measurable Brexit effects will have leavers and remainers keeping closer and closer score. The global deficit on goods trade narrowed slightly to a smaller than expected £12.35 billion in December versus £12.70 billion in November. The modest improvement reflected a 3.1 percent monthly rise in exports that more than offset a 1.4 percent gain in imports. The decline in the headline deficit was wholly attributable to a reduced bilateral shortfall with the EU. This was down from £5.47 billion in November to £4.48 billion, the smallest deficit since April 2020. Exports jumped 7.2 percent while imports were only flat. At the same time, the red ink with the rest of the world expanded from £7.23 billion to £7.88 billion, a 3-month high as exports fell 0.4 percent and imports rose 2.5 percent. However, over the fourth quarter, exports to the EU were up 11.2 percent, versus a 21.7 percent increase to the rest of the world while imports from the EU fell 0.7 percent but rose 5.7 percent from the rest of the world. In other words, Brexit continues to dampen UK-EU trade flows.
The underlying deficit remained sizeable at £14.20 billion, down just slightly from November's £14.49 billion. This put the quarterly shortfall at some £41.64 billion, up from the third quarter's £40.69 billion and its highest reading since the fourth quarter of 2020. The trend in the underlying trade gap is ominous, at least partly due to Brexit as importers and exporters alike struggle with changes to regulations compounded by more general staff shortages. However, even allowing for this, there is still a structural imbalance that does not bode well for the pound long-term.
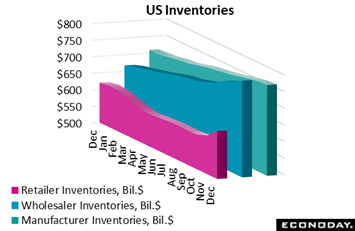 As Canadian businesses and their US counterparts try to figure out which side of the border their widgets are stuck on, let's take a look at US inventories going into the latest supply-chain snafu. Having been held down for two years by Covid factors, US inventories finally broken free in November especially for retail, raising hopes that material scarcities and shipping snags were easing and with that cost inflation as well. Inventory data for February won't be coming out for a couple of months yet, but the numbers are certain to be of interest, especially for monetary policy makers struggling to keep inflation down and perhaps politicians as well who may have to explain away a big inventory draw and resulting nosedive in first-quarter GDP. As Canadian businesses and their US counterparts try to figure out which side of the border their widgets are stuck on, let's take a look at US inventories going into the latest supply-chain snafu. Having been held down for two years by Covid factors, US inventories finally broken free in November especially for retail, raising hopes that material scarcities and shipping snags were easing and with that cost inflation as well. Inventory data for February won't be coming out for a couple of months yet, but the numbers are certain to be of interest, especially for monetary policy makers struggling to keep inflation down and perhaps politicians as well who may have to explain away a big inventory draw and resulting nosedive in first-quarter GDP.
 Travel and leisure shares led by cruise lines and airlines popped up early in the week as more countries appeared poised to ease travel restrictions. Banks also advanced, boosted by rising bond yields as investors see central banks turning more hawkish to counter inflation concerns. On Monday, European Central Bank President Christine Lagarde repeated her warning that upside inflation risks have increased but she also said the Eurozone is not seeing the same level of overheating evident in other economies. Travel and leisure shares led by cruise lines and airlines popped up early in the week as more countries appeared poised to ease travel restrictions. Banks also advanced, boosted by rising bond yields as investors see central banks turning more hawkish to counter inflation concerns. On Monday, European Central Bank President Christine Lagarde repeated her warning that upside inflation risks have increased but she also said the Eurozone is not seeing the same level of overheating evident in other economies.
Risk assets reacted favorably on Wednesday to Raphael Bostic's comments that inflation may be "on the cusp" of declining, even as the Atlanta Fed President said he favors three or four rate hikes during the year. Following Thursday's CPI report, however, Fedspeak went in the other direction: St. Louis Fed President James Bullard said the data rendered him “dramatically” more hawkish. Bullard called for 100 basis points of rate increases by mid-year and for the Fed to start shrinking its balance sheet as soon as the second quarter. US interest rates surged higher following the CPI, up a hair-raising 25 basis points for the 2-year yield to 1.60 percent before stocks dropped and bond yields drooped on Friday following a White House warning that a Russian invasion of Ukraine could happen "any day now". The US 2-year fell back 11 basis points on Friday ending the week, nevertheless, 17 basis points higher at 1.49 percent.
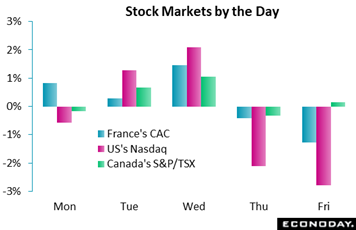
Canada's S&P/TSX, after rising 0.9 percent during the first week of the trucker unrest, added another 1.4 percent during the second week as the market evidently sees no risk of meaningful damage. Tim Macklem, governor of the Bank of Canada, warned on Wednesday that the trucker blockades, if they don't end soon, could have a "measurable" impact on economic activity. News on Thursday that anti-mandate protestors had closed the Ambassador Bridge between Windsor, Ontario and Detroit, Michigan also had little effect on the market, nor did reports of other blockades across other border crossings. Ontario announced a state of emergency at week's end, threatening protestors with fines and jail terms.
With Canada an outlier, global economic data on net are generally meeting expectations. Italy, as it was throughout much of last year, is back on top, rising more than 10 points on Econoday's consensus divergence index to plus 29, benefiting from a strong jump in retail sales that offset a dip for industrial production. The UK is next at 17 as headline industrial production was a little stronger than expected followed by France and China at 14 then the US at 11. Switzerland is running right at expectations at 4 while running a little below expectations is Germany which, pulled down by contraction in industrial production, is at minus 14. A sharper-than-expected gain for producer prices may not be good news for Japan but it did lift its ECDI by roughly 20 points to minus 18, underscoring general distortions caused by overheated price effects. Way in the rear is Canada at a deeply negative minus 46 after its weak trade report. It will be interesting to see how economists assess the effects of the blockade.
**Contributing to this article were Jeremy Hawkins, Brian Jackson, Mace News, Max Sato, and Theresa Sheehan
Consumer prices in India, to be posted Monday, could be the latest to test the limits of central bankers in contrast, however, to the week's other CPI reports where steady or moderating results are the call, whether from Canada or China or whether from Japan or the UK. Wage data from the UK, to be posted as part of the country's labour market report on Tuesday, are also expected to moderate. At the producer level, however, price data from the US on Tuesday and the UK on Wednesday could raise some alarms.
Demand-side data will include ZEW's survey on Tuesday which will update sentiment among German analysts while the EC confidence flash on Friday will update sentiment among European consumers. Both the US and UK will post January retail sales data on Wednesday and Friday respectively with big rebounds expected for both, while contraction is the call for Canadian retail sales on Friday which will be for the month of December.
News on the supply side will include Canadian manufacturing sales set for Wednesday as well as industrial production reports from the Eurozone on Monday and the US on Wednesday. Japanese data, aside from the CPI, will also include GDP on Tuesday and merchandise trade and machinery orders both on Thursday. Housing starts will be posted by Canada on Tuesday and the US on Thursday.
Eurozone Industrial Production for December (Mon 10:00 GMT; Mon 11:00 CET; Mon 05:00 EST)
Consensus Forecast, Month over Month: 0.1%
Following a 2.3 percent unexpected surge in November that masked a deep downward revision to the prior month, Eurozone industrial production in December is expected to edge 0.1 percent higher.
Indian CPI for January (Mon 12:00 GMT; Mon 17:30 IST; Mon 07:00 EST)
Consensus Forecast, Year over Year: 6.00%
Consumer prices have been on the rise, at an annual 5.59 percent in December and near the top of the Reserve Bank of India's target range of 2 to 6 percent. A test of this limit, at a consensus 6.00 percent, is expected for January. The CPI has exceeded the consensus the last three reports in a row.
Japanese Fourth-Quarter GDP, First Estimate (Mon 23:50 GMT; Tue 08:50 JST; Mon 18:50 EST)
Consensus Forecast, Quarter over Quarter: 1.4%
Consensus Forecast, Annualized Rate: 6.0%
GDP for the fourth quarter is expected to rise a quarterly 1.4 percent and rise 6.0 percent on an annualized basis. This would compare with respective third-quarter contraction of 0.9 and 3.6 percent.
UK Labour Market Report (Tue 07:00 GMT; Tue 02:00 EST)
Consensus Forecast, ILO Unemployment Rate for December: 4.1%
Consensus Forecast, Average Earnings for December: 3.9%
The ILO unemployment rate is expected to hold steady at 4.1 percent in data for the three months to December. Average earnings, which have been moderating, are expected to slip 3 tenths to 3.9 percent.
Germany: ZEW Survey for February (Tue 10:00 GMT; Tue 11:00 CET; Tue 05:00 EST)
Consensus Forecast, Current Conditions: -7.6
Consensus Forecast, Economic Sentiment: 54.3
February's sentiment is seen improving for current conditions, to minus 7.6 versus January's minus 10.2 which was lower than expected, and rising further for expectations (economic sentiment), to 54.3 versus 51.7 which was much higher than expected.
Canadian Housing Starts for January (Tue 13:15 GMT; Tue 08:15 EST)
Consensus Forecast, Annual Rate: 260,000
Monthly housing starts have been jumping up and down along, however, a moderating trend. After December's much lower-than-expected annual rate of 236,106, Econoday's consensus for January is 260,000.
US PPI-FD for January (Tue 13:30 GMT; Tue 08:30 EST)
Consensus Forecast, Month over Month: 0.5%
Consensus Forecast, Year over Year: 9.2%
US PPI-FD, Less Food & Energy
Consensus Forecast, Month over Month: 0.5%
Consensus Forecast, Year over Year: 8.0%
Producer prices in December slowed noticeably, to monthly rates of plus 0.2 percent overall but, when excluding food and also energy which dropped during the month, prices rose a more heated 0.5 percent. January's expectations are respective increases of 0.5 percent for both. Annual increases for January are expected at 9.2 and 8.0 percent.
Chinese CPI for January (Wed 01:30 GMT; Wed 09:30 CST; Tue 20:30 EST)
Consensus Forecast, Month over Month: 0.5%
Consensus Forecast, Year over Year: 1.3%
Consumer prices are expected to rise 0.5 percent on the month in January for a 1.3 percent year-over-year rate. Prices in December came in well below expectations, down 0.3 percent on the month at 1.5 percent on the year.
Chinese PPI for January (Wed 01:30 GMT; Wed 09:30 CST; Tue 20:30 EST)
Consensus Forecast, Year over Year: 9.8%
Producer prices are expected to slow to a 9.8 percent annual rate in January which would compare with 10.3 percent in a December reading that came in one full percentage point below the consensus.
UK CPI for January (Wed 07:00 GMT; Wed 02:00 EST)
Consensus Forecast, Month over Month: -0.1%
Consensus Forecast, Year over Year: 5.5%
January's CPI is expected to edge higher to 5.5 percent versus 5.4 percent in December. Yet the monthly change is seen at minus 0.1 percent versus plus 0.5 percent. UK CPI has exceeded the consensus forecasts the last three reports.
UK PPI for January (Wed 07:00 GMT; Wed 02:00 EST)
Consensus Forecast, Output Prices - M/M: 0.6%
Consensus Forecast, Output Prices - Y/Y: 9.5%
Consensus Forecast, Input Costs - M/M: 0.4%
Consensus Forecast, Output Prices - Y/Y: 13.7%
Output prices in January are seen rising 0.6 percent versus a 0.3 percent rise in December, lifting the annual rate from 9.3 percent to an expected 9.5 percent. Input costs are expected up 0.4 percent, lifting this annual rate 2 tenths to 13.7 percent.
US Retail Sales for January (Wed 13:30 GMT; Wed 08:30 EST)
Consensus Forecast, Month over Month: 2.0%
Consensus Forecast, Ex-Vehicles - M/M: 1.0%
December retail sales proved far weaker than expected, contracting 1.9 percent overall with ex-vehicles at minus 2.3 percent to suggest that US consumers shopped early during the holidays. Given the easy comparisons against December's weakness, January's sales are expected to rise 2.0 percent overall and 1.0 percent excluding vehicles.
Canadian CPI for January (Wed 13:30 GMT; Wed 08:30 EST)
Consensus Forecast, Month over Month: 0.3%
Consensus Forecast, Year over Year: 4.8%
Having come in below expectations the past two reports, consumer prices in December eased 0.1 percent for an annual rate of 4.8 percent. January's consensus forecasts are a 0.3 percent monthly rise and no change for the annual rate at 4.8 percent.
Canadian Manufacturing Sales for December (Wed 13:30 GMT; Wed 08:30 EST)
Consensus Forecast, Month over Month: 0.5%
Manufacturing sales, boosted by vehicles, have been surging though November's 2.6 percent jump still missed Econoday's consensus. December's consensus is a 0.5 percent increase.
US Industrial Production for January (Wed 14:15 GMT; Wed 09:15 EST)
Consensus Forecast, Month over Month: 0.4%
US Manufacturing Output
Consensus Forecast, Month over Month: 0.3%
Recovery in vehicles took a pause in December, making for a 0.1 percent decline in overall production. A bounce back to a 0.4 percent monthly gain is expected for January with manufacturing output, after falling 0.3 percent, expected to rise 0.3 percent.
Japanese Merchandise Trade for January (Wed 23:50 GMT; Thu 08:50 JST; Wed 18:50 EST)
Consensus Forecast: -¥1,607 billion
January's consensus is a deficit of ¥1,607 billion versus December's deficit of ¥582.4 billion.
Japanese Machinery Orders for December (Wed 23:50 GMT; Thu 08:50 JST; Wed 18:50 EST)
Consensus Forecast, Month over Month: -1.8%
Consensus Forecast, Year over Year: 0.7%
Orders, which in December are expected to fall 1.8 percent on the month for a year-over-year gain of 0.7 percent, have beaten expectations the past two reports. The Cabinet Office upgraded its view in the November report saying machinery orders were "showing signs of a pickup".
Australian Labour Force Survey for January (Thu 00:30 GMT; Thu 11:30 AEDT; Wed 19:30 EST)
Consensus Forecast, Employment: 17,000
The lifting of Covid restrictions, since reimposed, gave substantial boosts to the last two employment reports, including December's 64,800 rise. An increase of 17,000 is expected for January.
US Housing Starts for January (Thu 13:30 GMT; Thu 08:30 EST)
Consensus Forecast, Annual Rate: 1.708 million
US Building Permits
Consensus Forecast: 1.760 million
A 1.708 million annual rate is expected for January starts versus 1.702 million in December which was higher than expected. Permits especially beat expectations in December, at 1.885 million with 1.760 million the consensus for January.
US Initial Jobless Claims for the February 12 week (Thu 13:30 GMT; Thu 08:30 EST)
Consensus Forecast: 224,000
Jobless claims for the February 12 week (also the sample week for the monthly employment report) are expected to come in at 224,000 versus 223,000 in the prior week and compared with what was a much higher-than-expected 290,000 for the sample week of the January employment report.
Japanese Consumer Price Index for January (Thu 23:30 GMT; Fri 08:30 JST; Thu 18:30 EST)
Consensus Forecast, Year over Year: 0.5%
Consensus Forecast, Ex-Fresh Food - Y/Y: 0.3%
Consumer prices are expected to slow 3 tenths to an annual 0.5 percent in January. Excluding fresh food, prices are expected to slow 2 tenths to 0.3 percent.
UK Retail Sales for January (Fri 07:00 GMT; Fri 02:00 EST)
Consensus Forecast, Month over Month: 0.6%
Retail sales in December, reflecting that month's surge in Omicron, collapsed 3.7 percent. January's consensus is a monthly rebound of 0.6 percent.
Canadian Retail Sales for December (Fri 13:30 GMT; Fri 08:30 EST)
Consensus Forecast, Month over Month: -2.1%
Retail sales did rise 0.7 percent in November but this fell well short of the 1.2 percent gain that was expected. December's consensus is a 2.1 percent decline.
Eurozone: EC Consumer Confidence Flash for February (Fri 15:00 GMT; Fri 16:00 CET; Fri 10:00 EST)
Consensus Forecast: -8.0
Consumer confidence has declined the last four reports but was down only 1 tenth in January to minus 8.5. February's consensus is minus 8.0.
|
