|
Fed Chairman Ben Bernanke gave his semi-annual testimony before Congress on the status of monetary policy. He repeated many of the same points he has made recently, emphasizing that loose monetary policy for the foreseeable future. He noted that he believes markets are finally getting the message. Indeed, stocks were up and Treasury yields down.
 Major equity indexes this past week posted moderate to strong gains—with the Nasdaq being an exception. Most of the advances were related to testimony given by Fed Chairman Ben Bernanke. Earnings were generally favorable also. Major equity indexes this past week posted moderate to strong gains—with the Nasdaq being an exception. Most of the advances were related to testimony given by Fed Chairman Ben Bernanke. Earnings were generally favorable also.
The week looked like it might get off to a negative start as retail sales disappointed before open on Monday—especially at the core level. But this news was more than offset by Citigroup reporting stronger-than-expected second quarter earnings. Support was also provided by news that China’s second quarter GDP growth was 7.5 percent on a year-ago basis, indicating that China would not be dragging down growth in Asia.
 Stocks slipped Tuesday despite a better-than-expected report on industrial production. This time, earnings worked in the other direction as stocks retreated after disappointing sales data from Coca-Cola. Also, investors were cautious prior to Federal Reserve Chairman Ben Bernanke’s Congressional testimony. Stocks slipped Tuesday despite a better-than-expected report on industrial production. This time, earnings worked in the other direction as stocks retreated after disappointing sales data from Coca-Cola. Also, investors were cautious prior to Federal Reserve Chairman Ben Bernanke’s Congressional testimony.
At mid-week, equities were lifted by Bernanke’s semi-annual monetary policy testimony, starting with the House Financial Services Committee. The Fed chairman mostly repeated what he has said over the past several weeks. Namely, monetary policy changes are data dependent. He emphasized that he sees monetary policy as very accommodative for the foreseeable future. Gains continued Thursday with Bernanke making similar comments. Also, initial jobless claims fell more than expected and the Philly Fed manufacturing survey was stronger than forecast.
At week’s close, there was no notable news on economic indicators and no FedSpeak. Earnings stood out. Many key reports were positive but not for techs. Favorable results were reported by General Electric and Honeywell. But the Nasdaq was dinged Friday by disappointing results from Google and Microsoft, reported after close on Thursday.
Overall, it was a good week for financials, industrials, and energy sectors. It was a down week for techs. The S&P 500 set a record high at close Friday while the Dow squeaked down the last day of the week from a record high set on Thursday.
Equities were mostly up this past week. The Dow was up 0.5 percent; the S&P 500, up 0.7 percent; the Russell 2000, up 1.3 percent; and the Wilshire 5000, up 0.7 percent. The Nasdaq declined 0.3 percent;
For the year-to-date, major indexes are up as follows: the Dow, up 18.6 percent; the S&P 500, up 18.6 percent; the Nasdaq, up 18.8 percent; the Russell 2000, up 23.7 percent; and the Wilshire 5000, up 19.5 percent.
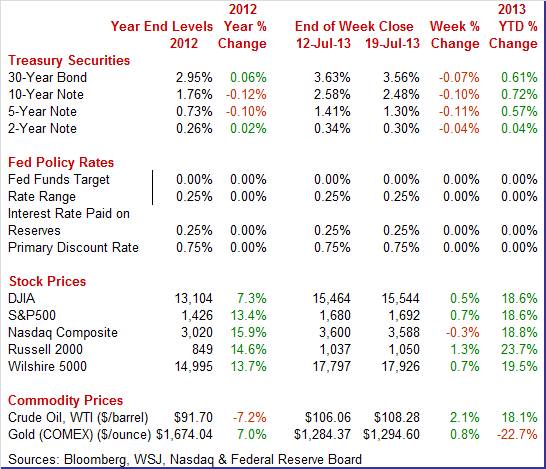
Weekly percent change column reflects percent changes for all components except interest rates. Interest rate changes are reflected in simple differences.
 Treasury yields fell notably this past week. The first big move was Wednesday as rates declined on testimony by Bernanke as he stated that policy is data dependent and not on a pre-set course and that policy will be very accommodative for quite some time. Treasury yields fell notably this past week. The first big move was Wednesday as rates declined on testimony by Bernanke as he stated that policy is data dependent and not on a pre-set course and that policy will be very accommodative for quite some time.
Rates rebounded Thursday on a drop in initial jobless claims and a strong Philly Fed manufacturing report. Yields dipped on Friday as traders refocused attention on the Fed chairman’s testimony given on Wednesday and Thursday.
The 10-year yield has fallen 26 basis points from the recent high on July 5 of 2.74 percent on tapering concerns to 2.48 percent at close this week.
For this past week Treasury rates were down as follows: 3-month T-bill, down 1 basis point; the 2-year note, down 4 basis points; the 5-year note, down 11 basis points; the 7-year note, down 11 basis points; the 10-year note, down 10 basis points; and the 30-year bond, down 7 basis points.
 The spot price of West Texas Intermediate rose moderately this past week, continuing a recently strong upward trend. The biggest gains were on Wednesday and Thursday. On Wednesday, crude oil stocks were lower than expected. Strong economic data boosted oil—notably jobless claims and Philly Fed. Also, Bernanke’s testimony added lift both days. The spot price of West Texas Intermediate rose moderately this past week, continuing a recently strong upward trend. The biggest gains were on Wednesday and Thursday. On Wednesday, crude oil stocks were lower than expected. Strong economic data boosted oil—notably jobless claims and Philly Fed. Also, Bernanke’s testimony added lift both days.
Net for the week, the spot price for West Texas Intermediate gained $2.22 per barrel to settle at $108.28. This is the highest settle since March 1, 2012.
Again, this past week’s focus was on Fed monetary policy—notably Fed Chairman Ben Bernanke’s comments before Congress on near-term and longer-term plans for cutting back on quantitative easing and also the Beige Book. Economic data were mixed.
Federal Reserve Chairman Ben Bernanke testified before the House Financial Services Committee. In his statement, he mostly repeated what he has said over the past several weeks. Namely, monetary policy changes are data dependent. He sees policy remaining accommodative even when asset buys end. Bernanke stated that purchases would slow later this year if the recovery continues as expected and purchases would end in mid-2014. The chairman said the fed funds rate is unlikely to be raised if inflation expectations remain below 2.5 percent. He noted that policy is not on a pre-set course.
Bernanke emphasized that he sees the need for accommodative monetary policy “for the foreseeable future” because inflation is below target and unemployment is high. He reiterated that if data are strong, the Fed could taper faster but if weak, could delay taper or even boost asset purchases. The Fed Chairman said there would be no surprises when it comes time to end bond purchases and the Fed knows how to exit and has the tools needed to exit without boosting inflation fears.
He described future policy changes in three stages. The first stage sees the end of asset purchases--these depend on substantial improvement in the labor market. The second stage would take place when unemployment reaches 6.5 percent and inflation still is under 2.5 percent. At that time, there will consideration of raising policy rates. The third stage will be normalization of policy rates. Bernanke anticipates a long period of accommodation after asset purchases end. He does not see tight policy any time in the foreseeable future. Bernanke indicated that the Fed will not reduce its balance sheet until after interest rates begin to rise.
Overall, Bernanke reaffirmed his view that loose monetary policy is needed for quite some time.
The latest Beige Book reports that overall economic activity continued to increase at a “modest to moderate pace” since the previous survey. This matches the characterization of the economy from the prior Beige Book. However, the detail appears to be slightly more optimistic. Manufacturing expanded in most Districts since the previous report, with many Districts reporting increases in new orders, shipments, or production. Most Districts noted that overall consumer spending increased during the reporting period—especially for motor vehicles.
Residential real estate activity increased at a moderate to strong pace in most Districts. Most Districts reported increases in home sales. Home prices increased throughout the majority of the reporting Districts. Residential construction activity also improved moderately across the Districts. Commercial real estate market conditions continued to improve across most Districts.
Hiring held steady or increased at a measured pace in most Districts. Some Districts reported high demand for temporary workers and a reluctance to hire permanent full-time employees. Also, some Districts indicated strong demand for high-tech workers. Most Districts reported that wage pressures remained limited or contained.
Overall consumer and input price pressures remained stable or modest in most reporting Districts.
The latest Beige Book shows the economy growing at a gradual pace with inflation low and the labor market still soft. The latest report does not suggest a quick tapering in Fed asset purchases.
 Retail sales disappointed in June. The headline number was moderately healthy but expectations were high and the detail was even more disappointing. Retail sales gained 0.4 percent, in June following an increase of 0.5 percent in May. The June gain fell well short of the market consensus forecast for a 0.8 percent jump. Retail sales disappointed in June. The headline number was moderately healthy but expectations were high and the detail was even more disappointing. Retail sales gained 0.4 percent, in June following an increase of 0.5 percent in May. The June gain fell well short of the market consensus forecast for a 0.8 percent jump.
The latest boost got a lot of lift from autos and gasoline. Motor vehicles rose 1.8 percent after a 1.4 percent advance in May. Despite the notable rise, this component is a key part of disappointment. Earlier in the month, unit new motor vehicle sales numbers were released with an overall gain of 4.2 percent for June.
 Ex-auto sales were flat after rising 0.3 percent in May. Expectations were for a 0.5 percent increase. Weakness was despite a rise in gasoline sales which increased 0.7 percent, following a 0.4 percent gain the month before. Excluding both autos and gasoline components, sales declined 0.1 percent after gaining 0.3 percent in May. Ex-auto sales were flat after rising 0.3 percent in May. Expectations were for a 0.5 percent increase. Weakness was despite a rise in gasoline sales which increased 0.7 percent, following a 0.4 percent gain the month before. Excluding both autos and gasoline components, sales declined 0.1 percent after gaining 0.3 percent in May.
Within the core, weakness was led by miscellaneous store retailers (down 2.5 percent) and building materials & garden supplies (down 2.2 percent). However, wet weather may have dampened sales in the latter. Declines were also seen in electronics & appliances, food & beverages, and food services & drinking places.
Within the core, strength was led by furniture & home furnishings (up 2.4 percent), and nonstore retailers (up 2.1 percent). The gain in furniture & home furnishings indicates that housing is still healthy despite the decline in building materials & garden supplies. Essentially, furniture can be delivered in wet weather while there temporarily is less demand for construction materials during wet weather. Also gaining were health & personal care, clothing, sporting goods & hobby, and general merchandise.
While there are some special factors that likely overstate weakness in June core retail sales, the consumer may be pulling back a bit.
 Housing starts retrenched sharply in June on a downswing in the volatile multifamily component. And atypically wet weather likely weighed on starts. Housing starts in June fell back 9.9 percent, following an 8.9 percent surge in May. The June starts annualized level of 0.836 million units was up 10.4 percent on a year-ago basis. June’s starts level was the lowest since August 2012. Housing starts retrenched sharply in June on a downswing in the volatile multifamily component. And atypically wet weather likely weighed on starts. Housing starts in June fell back 9.9 percent, following an 8.9 percent surge in May. The June starts annualized level of 0.836 million units was up 10.4 percent on a year-ago basis. June’s starts level was the lowest since August 2012.
The decrease in starts was led by a monthly 26.2 percent drop in the multifamily component after a 28.2 percent jump in May. The single-family component slipped 0.8 percent, following a 0.5 percent rise in May.
By region, the drop in June starts was led by the Northeast and closely followed by the South with respective declines of 12.1 percent and 12.0 percent. The South is the largest Census region in terms of housing activity. The Midwest decreased 7.4 percent and the West fell 5.4 percent.
Permits also dropped sharply on a plunge in the multifamily component. Permits fell 7.5 percent in June after dipping 2.0 percent the prior month. June’s annualized pace of 0.911 million units was up 16.1 percent on a year-ago basis.
The latest starts and permits numbers are disappointing but hard to read due to weather issues and the volatility in the multifamily component. The underlying trend likely remains upward. Based on other data, the single-family portion is joining the modest uptrend based on recently favorable numbers for the National Association of Home Builders’ housing market index. Also, for new home sales, supply was at 4.1 months in May versus 4.0 months in April. The May number was little changed from the recovery low of 3.9 month set in January of this year.
 Industrial production regained some momentum in June after weak numbers in April and May. Overall industrial production rose 0.3 percent, following no change in May and a 0.3 percent decline in April. Industrial production regained some momentum in June after weak numbers in April and May. Overall industrial production rose 0.3 percent, following no change in May and a 0.3 percent decline in April.
The manufacturing component gained 0.3 percent after a 0.2 percent rise in May. Excluding motor vehicles, manufacturing posted a 0.2 percent advance, matching the pace in May.
 Within manufacturing, the durables component increased 0.5 percent, following a 0.4 percent gain in May. The production of nondurable goods was unchanged in June after having edged up 0.1 percent in May. Within manufacturing, the durables component increased 0.5 percent, following a 0.4 percent gain in May. The production of nondurable goods was unchanged in June after having edged up 0.1 percent in May.
While strengthening in durables and nondurables was broad based, the manufacturing highlight of the recovery may be the auto sector. Light motor vehicle assemblies hit a recovery high in June at an annualized pace of 10.98 million units, compared to 10.78 million in May and the recession low of 3.56 million in January 2009. June’s pace is the highest since June 2007.
 Turning to the non-manufacturing sectors, the output of utilities declined 0.1 percent after dropping 2.8 percent in May. Production at mines jumped 0.8 percent, following a 0.4 percent gain the prior month. Turning to the non-manufacturing sectors, the output of utilities declined 0.1 percent after dropping 2.8 percent in May. Production at mines jumped 0.8 percent, following a 0.4 percent gain the prior month.
Capacity utilization for total industry improved to 77.8 percent in June from 77.7 percent the month before.
Manufacturing showed improvement in June but the level of activity still is somewhat subdued. The index for manufacturing decreased at an annual rate of 0.2 percent in the second quarter, after having advanced 5.1 percent in the first quarter.
Nonetheless, the June data show manufacturing perhaps headed back in the right direction, albeit at a moderate pace. The positive July numbers from the Empire State and Philly Fed manufacturing surveys also suggest a moderate recovery in manufacturing strength.
 Manufacturing activity picked up in July in both New York State and the Philly Fed’s mid-Atlantic region. Manufacturing activity picked up in July in both New York State and the Philly Fed’s mid-Atlantic region.
Growth firmed in the Empire State as the general business conditions index rose to a moderately strong 9.46 from 7.84 in June and minus 1.43 in May. Zero is the breakeven point between growth and contraction.
However, details showed less strength than the headline index with new orders showing a much softer rate of monthly growth at 3.77 but was substantially improved from the June reading of minus 6.69. But shipments, at 8.96, showed strong growth while delivery times are slowing which indicates a little bit of congestion in the supply chain which is consistent with rising activity.
Companies in the sample were also adding slightly to their workforces, indicating confidence in their outlook for business activity. The employment index rose to 3.26 from zero in June. The general six-month outlook in fact jumped more than 7 points to a very impressive looking 32.01.
 The latest Philly Fed report was even more positive than Empire—but still in the moderate category. Nonetheless, the manufacturing sector is picking up momentum following a lull in the Spring. The Philly Fed index jumped 7.3 points to 19.8 this month to indicate the strongest rate of monthly growth in the Mid-Atlantic manufacturing economy since March 2011. The latest Philly Fed report was even more positive than Empire—but still in the moderate category. Nonetheless, the manufacturing sector is picking up momentum following a lull in the Spring. The Philly Fed index jumped 7.3 points to 19.8 this month to indicate the strongest rate of monthly growth in the Mid-Atlantic manufacturing economy since March 2011.
Details mostly confirmed the strength at the headline level. These included shipments, at 14.3 versus 4.1 in June, and employment at 7.7 versus minus 5.4 the month before.
New orders, at a solid 10.2, are in positive growth territory but to a lesser degree than June's 16.6 reading.
Manufacturing has been sidelined for most the year, the result to a large degree of weakness in foreign markets. But the sector is now regaining momentum and looks to begin to contribute once again to the nation's economic growth.
 Headline inflation at the consumer level jumped in June—largely on energy. Meanwhile, the core rate held steady. The consumer price index for June surged 0.5 percent, following a modest rebound of 0.1 percent in May. The latest number came in higher than the consensus forecast for 0.4 percent. The core CPI—excluding food and energy—increased 0.2 percent, matching the pace in May. Expectations were for a 0.2 percent increase. Headline inflation at the consumer level jumped in June—largely on energy. Meanwhile, the core rate held steady. The consumer price index for June surged 0.5 percent, following a modest rebound of 0.1 percent in May. The latest number came in higher than the consensus forecast for 0.4 percent. The core CPI—excluding food and energy—increased 0.2 percent, matching the pace in May. Expectations were for a 0.2 percent increase.
 By major components outside the core, energy spiked 3.4 percent, following a partial rebound of 0.4 percent in May. Gasoline surged 6.3 after no change in May. The food component rebounded 0.2 percent, following a dip of 0.1 percent in May. By major components outside the core, energy spiked 3.4 percent, following a partial rebound of 0.4 percent in May. Gasoline surged 6.3 after no change in May. The food component rebounded 0.2 percent, following a dip of 0.1 percent in May.
For the core measure, advances in the indexes for shelter, medical care, and apparel accounted for most of the rise, with increases in the indexes for new vehicles and household furnishings and operations also contributing. The indexes for airline fares, used cars and trucks, and recreation all declined in June.
Year-on-year, overall CPI inflation jumped to 1.8 percent from 1.4 percent in May (seasonally adjusted). The core rate posted at 1.6 percent, compared to 1.7 percent. On an unadjusted year-ago basis, the headline CPI in June was up 1.8 percent and the core was up 1.6 percent.
Keeping the core trend down have been year-on-year (NSA) increases for apparel (up 0.8 percent), recreation (up 0.3 percent), and some subcomponents of communications services. Upward pressure on the core has come from the shelter component, up 2.3 percent year on year.
The next FOMC statement may use the phrase “transitory” on recent inflation trends as energy has lifted the headline rate but the core is holding relatively steady. However, declines in crude supply and sharply higher crude prices are likely to lead to an ugly headline CPI number at least for July.
 The unexpected and sharp drop in June building permits held back the index of leading economic indicators which was unchanged in the June, following gains of 0.2 percent in May and 0.8 percent in April. The unexpected and sharp drop in June building permits held back the index of leading economic indicators which was unchanged in the June, following gains of 0.2 percent in May and 0.8 percent in April.
The building permit component pulled down on the overall index with a negative contribution of 0.25 percentage points. Other negatives were slight with downward contributions of 0.07 for ISM new orders, 0.05 for stock prices, and 0.02 for new orders for nondefense capital goods excluding aircraft.
Positives are once again led by readings on credit activity and interest rates where gains in the long end reflect expectations of tapering in Fed stimulus, which is another signal of economic strength. The positive contributors were the interest rate spread (0.24 percent points), the leading credit index (inverted) (0.13), average weekly initial claims for unemployment insurance (inverted) (0.07), average consumer expectations for business conditions (0.02), and manufacturers’ new orders for consumer goods and materials (0.01). The factory workweek posted with a zero contribution.
Other readings include a third straight 0.2 percent gain in the coincident index, one that points to a respectable rate of ongoing economic growth but is more positive than the view of many economists that overall growth slowed in the second quarter. But looking ahead, a bounce back for housing permits, which is very possible given strength in home prices, and the big jump in the home builder's housing market index, would give the LEI a boost in next month's reading. Also, stock prices have been strong for the first three weeks in July.
The markets’ focus was on FedSpeak once again and most liked what they heard about continuing monetary ease. But there were mixed data by sectors with retail sales soft, housing down, but manufacturing showing new momentum. The consumer sector is seeing cross currents in fundamentals with real disposable income being eroded by rising gasoline prices but with the jobs market slowly improving. Housing starts were down sharply in the latest report but it may have been weather related. The fundamentals for both the single-family and multifamily components remain moderately positive. Importantly, manufacturing is regaining strength, albeit moderately. Overall, sector strength has shifted during the recovery but continues at a modest to moderate pace—yes, that phrase was stolen from the Beige Book. The second quarter looks like it ended very soft but fundamentals suggest second half improvement. Finally, CPI inflation was mixed — hotter headline inflation and soft core inflation—likely leading to debate within the Fed on the underlying inflation trend.
Key updates are posted for housing, manufacturing, and the consumer sectors. Pending home sales jumped 6.7 percent in May—how much will show up in closed existing home sales for June' The Fed wants higher asset prices—will FHFA continue upward' The durable goods orders report for June may confirm recent strengthening in manufacturing with flash PMI providing a peek at July. Gasoline costs are up while jobless claims are down. The final consumer sentiment reading for July may show how the consumer is netting these out.
The Chicago Fed National Activity Index in May came in at minus 0.30, showing less contraction but not much from a revised minus 0.52 in April. Contraction in the 4-week average was more severe than April, at minus 0.43 versus minus 0.13. This was the third straight negative reading for the 4-week average which is now at its lowest point since October last year. The employment report, led by a respectable 175,000 rise in non-farm payroll, was May's highlight with employment-related indicators adding to May's results, but just barely at plus 0.01 versus April's minus 0.06. The report's three other components all showed contraction with sales/orders/inventories at minus 0.04, production at minus 0.10, and consumption & housing at minus 0.17.
Chicago Fed National Activity Index Consensus Forecast for June 13: 0.03
Range: -0.20 to 1.00
Existing home sales in May jumped 4.2 percent to an annual sales rate of 5.18 million which was the highest since the home stimulus credits of late 2009. The gain was very convincing and was centered in the key single-family home category which is up 5.0 percent in the May report on top of a 1.2 percent gain in April. Price data were striking with the median price is 8.4 percent in May alone to a recovery best $208,000. The average price, at $255,300, was up 5.6 percent in the month. Year-on-year gains are 15.4 percent for the median price and 11.2 percent for the average. These price data are not derived from repeat transactions and are subject to substantial volatility, but the gains are outstanding nevertheless. Supply did come into the market in May, totaling 2.22 million homes for sales versus 2.15 million in April, but declined relative to the surging sales rate. Supply measured against sales was at 5.1 months compared to 5.2 months in April.
Existing home sales Consensus Forecast for June 13: 5.27 million-unit rate
Range: 5.01 to 5.45 million-unit rate
The FHFA purchase only house price index for April increased 0.7 percent after improving 1.5 percent in March. The April increase was led by the Mountain region, increasing 2.2 percent. Six of nine Census regions posted gains in the latest month. The year-on-year rate for April stood at 7.4 percent versus 7.5 percent for the month before.
FHFA purchase only house price index Consensus Forecast for May 13: +0.8 percent
Range: +0.5 to +1.2 percent
The Richmond Fed manufacturing index in June was up a very strong 10 points and was back in the plus column at 8. New orders were up as were shipments and employment. Inventories climbed, which, given the rise in orders and shipments, points to intentional stocking in anticipation of increased activity ahead.
Richmond Fed manufacturing index Consensus Forecast for July 13: 8
Range: 0 to 10
The Markit PMI manufacturing index (final) for June slowed slightly more than the flash estimate, with the PMI at 51.9 versus 52.2 at mid-month and versus May's 52.3. The marginal downgrade from mid-month includes slightly slower growth for new orders, which ends June at 53.4 to show virtually no change from May's 53.3. A mid-to-low 50s reading points to no better than modest growth for the manufacturing sector.
Markit PMI manufacturing flash index Consensus Forecast for July 13: 52.8
Range: 51.9 to 53.5
New home sales came in at a stronger-than-expected annual rate of 476,000 in May. Upward revisions totaling 19,000 in the prior two months underscored the strength. A big issue holding back sales has been limited supply. But this appears to be changing somewhat. Supply is moving higher as builders pick up the pace. Supply on the market rose 4,000 in the month to 161,000 units. On a monthly sales basis, supply was at 4.1 months versus 4.0 months in April.
New home sales Consensus Forecast for June 13: 481 thousand-unit annual rate
Range: 450 thousand to 510 thousand-unit annual rate
Durable goods orders in May jumped 3.7 percent, following a 3.6 percent spike the month before. The transportation component surged 10.9 percent after an 8.0 percent boost in April. Within transportation, nondefense aircraft jumped a monthly 50.8 percent; defense aircraft rose 3.7 percent; motor vehicle orders slipped 2.0 percent; and ships & boats jumped 50.8 percent. Excluding transportation, durables orders still gained 0.5 percent after a 1.8 percent increase in April. Outside of transportation, component strength for May was mostly broad based. Numbers reflect revisions from the more recent total factory orders report.
New orders for durable goods Consensus Forecast for June 13: +1.5 percent
Range: -4.0 percent to +4.0 percent
New orders for durable goods, ex-trans., Consensus Forecast for June 13: +0.6 percent
Range: -0.1 percent to +1.8 percent
Initial jobless claims in the July 13 week fell 24,000 to 334,000, following a revised 14,000 rise that the Labor Department is attributing to summer layoffs in the auto industry. Summer retooling in the auto industry always plays havoc with week-to-week jobless claims data during July, a factor that puts extra emphasis on the 4-week average which was down 5,250 in the latest week to 346,000. Despite the decline, this level is just about even with the month-ago trend. In contrast, continuing claims jumped 91,000 to 3.114 million in the latest available data which were for the July 6 week. The 4-week average was up 37,000 to 3.019 million for the first 3 million reading since early May.
Jobless Claims Consensus Forecast for 7/20/13: 341,000
Range: 330,000 to 355,000
The Kansas City Fed manufacturing index was minus 5 in June, down from 2 in May but equal to minus 5 in April and March. The composite index is an average of the production, new orders, employment, supplier delivery time, and raw materials inventory indexes. Production fell at both durable and non-durable goods-producing plants. Other month-over-month indexes showed mixed results. The production index dropped from 5 to minus 17, its lowest level since March 2009, and the shipments and new orders indexes also fell markedly. The order backlog and employment indexes increased somewhat but still remain slightly below zero. Both inventory indexes edged higher after falling in May.
Kansas City Fed manufacturing index Consensus Forecast for July 13: 0
Range: -2 to 5
The Reuter's/University of Michigan's consumer sentiment index slipped in the first read for July with the composite posting at 83.9 versus the final for June at 84.1. Consumers may be feeling better about the current economy, but they are less optimistic about the future. Weakness was in the expectations component which dropped to 73.8 from 77.8 in June. However, current conditions improved to 99.7 in mid-July from 93.8 for June. The current conditions index is at its highest level since mid-2007. The economic outlook index was little changed at 103.0 versus 104.0 in June.
Consumer sentiment Consensus Forecast for final July 13: 84.0
Range: 83.2 to 85.5
R. Mark Rogers is the author of The Complete Idiot’s Guide to Economic Indicators, Penguin Books.
Econoday Senior Writer Mark Pender contributed to this article.
|
