|
Simply Economics will be taking off Thanksgiving week. Next edition will be November 30.
Taking questions at mid-week in Dallas, Federal Reserve Chair Jerome Powell sounded very firm about the Federal Reserve's rate-hike path and is not really entertaining the possibility of not raising rates: "We have to be thinking about how much further to raise rates and the pace at which we will raise rates." The policy boundaries he's outlining are keeping rates too low for too long which he warns can raise the risk of unwanted inflation and market excesses, so that option's out, or raising rates too high and too fast which could "terminate" the expansion, another unwanted outcome. His path is the middle one: "We are taking both of those risks very seriously which is why we've been raising rates very gradually." A middle path is also a good description of the week's economic data where strong headlines belie what are soft details, details that really don't raise much urgency for very many rate hikes.
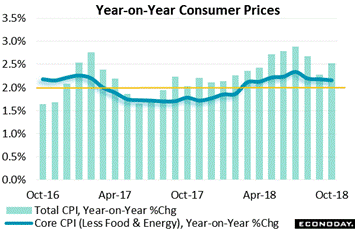 Oil prices have really been coming down, falling 5.1 percent for West Texas Intermediate just this past week to just under $57. But this is November and not October when $70 oil fed a 3.0 percent monthly spike in gasoline that lifted the consumer price index to a moderate 0.3 percent monthly gain. But elsewhere pressures in the report were limited. Medical services have been very subdued over the last four months, among the weakest on record with both physician services and hospital services unchanged in October. Food prices also continue to be very subdued, down 0.1 percent while apparel rose only 0.1 percent in October. Prices of new vehicles fell 0.2 percent for a second straight decline though prices of used vehicles did jump 2.6 percent which failed, however, to reverse a drop of 3.0 percent in September. The core rate, which excludes energy and food, came in one notch lower than the headline rate at 0.2 percent. Year-on-year rates, as tracked in the graph, show an oil-driven 2.5 percent overall rate with the core rate edging down for a third straight month to 2.1 percent. Oil prices have really been coming down, falling 5.1 percent for West Texas Intermediate just this past week to just under $57. But this is November and not October when $70 oil fed a 3.0 percent monthly spike in gasoline that lifted the consumer price index to a moderate 0.3 percent monthly gain. But elsewhere pressures in the report were limited. Medical services have been very subdued over the last four months, among the weakest on record with both physician services and hospital services unchanged in October. Food prices also continue to be very subdued, down 0.1 percent while apparel rose only 0.1 percent in October. Prices of new vehicles fell 0.2 percent for a second straight decline though prices of used vehicles did jump 2.6 percent which failed, however, to reverse a drop of 3.0 percent in September. The core rate, which excludes energy and food, came in one notch lower than the headline rate at 0.2 percent. Year-on-year rates, as tracked in the graph, show an oil-driven 2.5 percent overall rate with the core rate edging down for a third straight month to 2.1 percent.
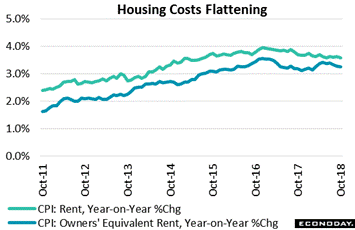 Housing is the dominant component in the consumer price report and here price pressures were also moderate in October, especially for rents which rose only 0.2 percent and also for homeowners where the reading on owners' equivalent rent increased 0.3 percent. Year-on-year rates as tracked in the graph are on the high side, at 3.3 percent for homeowners and 3.6 percent for renters, but the slope over the past two years has been moderating. Overall housing costs right now show the least pressure since February this year. Softness in these readings ultimately reflects soft demand for housing in general, a topic Jerome Powell touched on during the week. Though downturns in housing have had significant impact in past cycles, Powell notes that relative growth of the housing sector this cycle has slowed sharply which he believes is likely to limit housing's impact on the economy as a whole. Housing is the dominant component in the consumer price report and here price pressures were also moderate in October, especially for rents which rose only 0.2 percent and also for homeowners where the reading on owners' equivalent rent increased 0.3 percent. Year-on-year rates as tracked in the graph are on the high side, at 3.3 percent for homeowners and 3.6 percent for renters, but the slope over the past two years has been moderating. Overall housing costs right now show the least pressure since February this year. Softness in these readings ultimately reflects soft demand for housing in general, a topic Jerome Powell touched on during the week. Though downturns in housing have had significant impact in past cycles, Powell notes that relative growth of the housing sector this cycle has slowed sharply which he believes is likely to limit housing's impact on the economy as a whole.
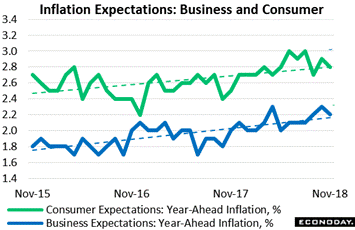 The big drop underway this month in oil prices really made October's consumer price headline old news. But some of oil's effect may be appearing in this month's readings on inflation expectations, dipping 1 tenth to 2.2 percent as tracked by the blue line of the Atlanta Fed's business reading. The University of Michigan's reading on the consumer side, released in the prior week, also edged lower, to 2.8 percent. Though the latest readings don't heat up the urgency for rate hikes, the trend lines over the past three years are pointing higher. For the Fed's Powell inflation expectations are a central concern, the limiting of which are of the highest priority and an arguable justification for pre-emptive rate hikes. The big drop underway this month in oil prices really made October's consumer price headline old news. But some of oil's effect may be appearing in this month's readings on inflation expectations, dipping 1 tenth to 2.2 percent as tracked by the blue line of the Atlanta Fed's business reading. The University of Michigan's reading on the consumer side, released in the prior week, also edged lower, to 2.8 percent. Though the latest readings don't heat up the urgency for rate hikes, the trend lines over the past three years are pointing higher. For the Fed's Powell inflation expectations are a central concern, the limiting of which are of the highest priority and an arguable justification for pre-emptive rate hikes.
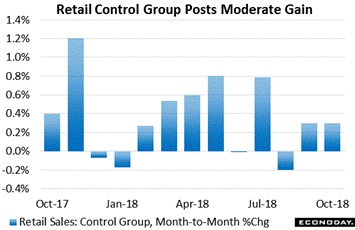 October's retail sales report was an especially mixed set of data in the week. The first hard indication on what to expect for fourth-quarter consumer spending was positive but not as enormously positive as October's 0.8 percent headline monthly surge would suggest. Control group sales, which importantly are inputs into personal consumption expenditures and which exclude categories that were especially strong in October, rose a more moderate 0.3 percent with September for this reading revised 2 tenths lower to also a 0.3 percent gain. Control group sales exclude autos which were very strong in October, rising 1.1 percent following several months of weakness. Sales for the control group also exclude building materials which surged nearly as much as autos, up 1.0 percent. Gasoline is also not included in the control group and here sales jumped 3.5 percent in the month though this reading for November, like the CPI, is very likely to reverse given the ongoing decline in oil. October's retail sales report was an especially mixed set of data in the week. The first hard indication on what to expect for fourth-quarter consumer spending was positive but not as enormously positive as October's 0.8 percent headline monthly surge would suggest. Control group sales, which importantly are inputs into personal consumption expenditures and which exclude categories that were especially strong in October, rose a more moderate 0.3 percent with September for this reading revised 2 tenths lower to also a 0.3 percent gain. Control group sales exclude autos which were very strong in October, rising 1.1 percent following several months of weakness. Sales for the control group also exclude building materials which surged nearly as much as autos, up 1.0 percent. Gasoline is also not included in the control group and here sales jumped 3.5 percent in the month though this reading for November, like the CPI, is very likely to reverse given the ongoing decline in oil.
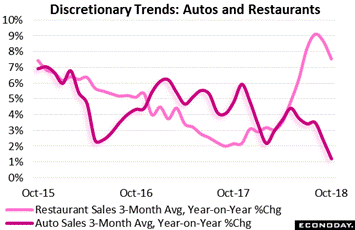 Showing an outright decline in the October retail sales report were restaurants, down 0.2 percent which follow 1.5 and 0.1 percent declines in the two prior months. Restaurants had been a leading force for retail sales and the recent reversals hint at an ebbing in consumer enthusiasm -- not something retailers want to hear going into the holidays. Yet the recent weakness aside, restaurant sales year-over-year are still very positive, up 7.5 percent as tracked by the pink line of the three-month average. The trend for auto sales, though a big monthly positive for October, is not favorable at all falling sharply to only 1.2 percent. These are major discretionary categories, especially autos, and the downturns are worth noting. Showing an outright decline in the October retail sales report were restaurants, down 0.2 percent which follow 1.5 and 0.1 percent declines in the two prior months. Restaurants had been a leading force for retail sales and the recent reversals hint at an ebbing in consumer enthusiasm -- not something retailers want to hear going into the holidays. Yet the recent weakness aside, restaurant sales year-over-year are still very positive, up 7.5 percent as tracked by the pink line of the three-month average. The trend for auto sales, though a big monthly positive for October, is not favorable at all falling sharply to only 1.2 percent. These are major discretionary categories, especially autos, and the downturns are worth noting.
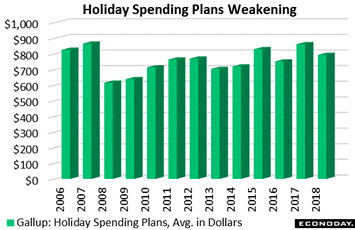 There is also a downturn underway in Gallup's measure of holiday spending plans, falling to an average of $794 for each American this month from $885 just last month. The sell-off in the stock market appears to be at play as this year's $91 October-to-November decline was only exceeded during the stock market routs of October 2008 and October 2009. Taken all together, early indications for holiday spending from both the October retail sales report and Gallup's November update are healthy but not accelerating and with a few warning signs emerging. There is also a downturn underway in Gallup's measure of holiday spending plans, falling to an average of $794 for each American this month from $885 just last month. The sell-off in the stock market appears to be at play as this year's $91 October-to-November decline was only exceeded during the stock market routs of October 2008 and October 2009. Taken all together, early indications for holiday spending from both the October retail sales report and Gallup's November update are healthy but not accelerating and with a few warning signs emerging.
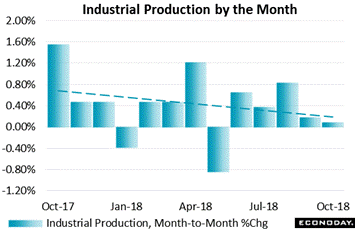 Industrial production also offered important news in the week and here the message is also hidden behind the headline. Hurricane-related contraction in utility output and contraction in the usually strong mining component offset a respectable rise in manufacturing, all making for a slightly lower-than-expected 0.1 percent increase in total industrial production for October. Utility output fell 0.5 percent in the month as Hurricane Michael, which struck Florida at mid-month, resulted in outages for as many as 1.7 million electricity customers across six states. And mining was also a negative, with volumes contracting 0.3 percent following a 0.1 percent decline in September. But the weakness may be an outlier for mining as year-on-year growth is still safely in the double digits, at 13.1 percent. Utility production year-on-year is up only 1.7 percent. Industrial production also offered important news in the week and here the message is also hidden behind the headline. Hurricane-related contraction in utility output and contraction in the usually strong mining component offset a respectable rise in manufacturing, all making for a slightly lower-than-expected 0.1 percent increase in total industrial production for October. Utility output fell 0.5 percent in the month as Hurricane Michael, which struck Florida at mid-month, resulted in outages for as many as 1.7 million electricity customers across six states. And mining was also a negative, with volumes contracting 0.3 percent following a 0.1 percent decline in September. But the weakness may be an outlier for mining as year-on-year growth is still safely in the double digits, at 13.1 percent. Utility production year-on-year is up only 1.7 percent.
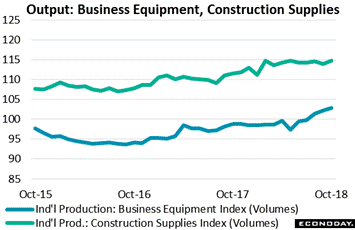 Manufacturing volumes rose an as-expected 0.3 percent in the month with this year-on-year growth rate at 2.7 percent. And this is where the good news starts. Production of business equipment, up a monthly 0.8 percent, and construction supplies, up 0.6 percent, were both very strong, the former hinting at a fourth-quarter rebound for business investment and the latter reflecting heavy demand in construction where material shortages have been reported for months. The graph tracks the underlying indexes where the blue line of business equipment is curving solidly higher. Year-on-year percentage gains are a strong 4.1 percent for business equipment and 2.9 percent for construction supplies. Manufacturing volumes rose an as-expected 0.3 percent in the month with this year-on-year growth rate at 2.7 percent. And this is where the good news starts. Production of business equipment, up a monthly 0.8 percent, and construction supplies, up 0.6 percent, were both very strong, the former hinting at a fourth-quarter rebound for business investment and the latter reflecting heavy demand in construction where material shortages have been reported for months. The graph tracks the underlying indexes where the blue line of business equipment is curving solidly higher. Year-on-year percentage gains are a strong 4.1 percent for business equipment and 2.9 percent for construction supplies.
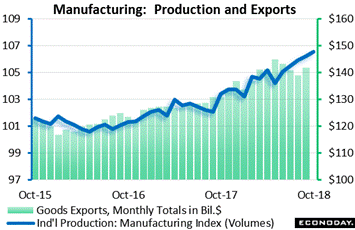 Trade data were absent in the week but a comparison with the path for manufacturing volumes and prior data on goods exports in dollar terms shows a bit of a dislocation. Manufacturing production, tracked in the blue line, has been climbing steadily but not exports which, as tracked in the green columns and updated as far as September, have broken down the last four months despite September's small rebound to a monthly $142 billion. Is this merely a reflection of ongoing weakening in global demand or is it also evidence that early skirmishes in the trade wars are holding down U.S. exports? Turning back to Jerome Powell for guidance on the tariff question, he says it's too early too see anything concrete in the trade numbers. Powell's warning all along has been that should trade negotiations result in a long-term lowering of tariffs it will be good for everybody. But If they result in higher tariffs, then the global result, including for the U.S., would be not so good. Trade data were absent in the week but a comparison with the path for manufacturing volumes and prior data on goods exports in dollar terms shows a bit of a dislocation. Manufacturing production, tracked in the blue line, has been climbing steadily but not exports which, as tracked in the green columns and updated as far as September, have broken down the last four months despite September's small rebound to a monthly $142 billion. Is this merely a reflection of ongoing weakening in global demand or is it also evidence that early skirmishes in the trade wars are holding down U.S. exports? Turning back to Jerome Powell for guidance on the tariff question, he says it's too early too see anything concrete in the trade numbers. Powell's warning all along has been that should trade negotiations result in a long-term lowering of tariffs it will be good for everybody. But If they result in higher tariffs, then the global result, including for the U.S., would be not so good.
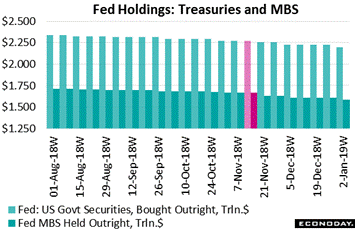 Saying the process is "going very well", Jerome Powell expressed satisfied confidence in what was once a very controversial subject: the reduction of the Fed's balance sheet and risk of dislocations for Treasuries and mortgage-backed securities (MBS). It's important to remember that the Fed is not only raising rates, but it has also been withdrawing support from these two markets at an accelerating rate. Federal Reserve's assets totaled $4.146 trillion in the November 14 week, down $314.5 billion from the beginning of balance sheet unwinding in October 2017. Treasury holdings are at $2.270 trillion, down $195.0 billion since October last year, with MBS holdings at $1.671 trillion and down $97.3 billion from the start date. These totals are short of plan especially for MBS which means, if the Fed does intend to meet its targets, there's a lot of non-reinvesting that's about to take place. MBS holdings are supposed to come down to $1.608 trillion by the end of this month and to $1.588 trillion by the end of the year. That means $83.0 billion of MBS over the next six weeks won't be bought, which nearly matches the full total not reinvested over the last 14 months. Guidance on 2019's unwinding schedule has yet to come out but can be expected at the next FOMC meeting on December 19. The pace of future unwinding is no doubt an interesting topic of discussion right now at the Fed, with the outcome based perhaps on whether the bond markets, especially mortgage-backed securities, show any hiccups from the accelerating pace that's scheduled to take place. Saying the process is "going very well", Jerome Powell expressed satisfied confidence in what was once a very controversial subject: the reduction of the Fed's balance sheet and risk of dislocations for Treasuries and mortgage-backed securities (MBS). It's important to remember that the Fed is not only raising rates, but it has also been withdrawing support from these two markets at an accelerating rate. Federal Reserve's assets totaled $4.146 trillion in the November 14 week, down $314.5 billion from the beginning of balance sheet unwinding in October 2017. Treasury holdings are at $2.270 trillion, down $195.0 billion since October last year, with MBS holdings at $1.671 trillion and down $97.3 billion from the start date. These totals are short of plan especially for MBS which means, if the Fed does intend to meet its targets, there's a lot of non-reinvesting that's about to take place. MBS holdings are supposed to come down to $1.608 trillion by the end of this month and to $1.588 trillion by the end of the year. That means $83.0 billion of MBS over the next six weeks won't be bought, which nearly matches the full total not reinvested over the last 14 months. Guidance on 2019's unwinding schedule has yet to come out but can be expected at the next FOMC meeting on December 19. The pace of future unwinding is no doubt an interesting topic of discussion right now at the Fed, with the outcome based perhaps on whether the bond markets, especially mortgage-backed securities, show any hiccups from the accelerating pace that's scheduled to take place.
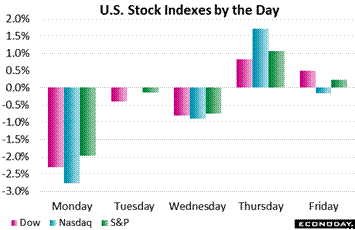 An accelerating pace of losses has been the unwanted theme of the stock market over the last six weeks as a nearly double-digit year-to-date gain for the Dow has now evaporated to only 2.8 percent with the Nasdaq shedding more than 10 percentage points of gain to 5.0 percent. And the latest sessions haven't shown much let up in the selling with the Dow, at 25,413, down 2.2 percent on the week and the Nasdaq, at 7,247, down 2.1 percent. The flight out of stocks has been finding its way into Treasuries and especially in the latest week as the 10-year yield fell a sharp 12 basis points to 3.07 percent with the 2-year down an especially steep 13 basis points to 2.81 percent. If a Santa Claus rally is a no show during the holidays and if equities continue to be sold, the bond market may continue to benefit in what could be a positive offset for the Fed's year-end balance-sheet unwinding push. For the dollar, though there's been lots of concern of unwanted strengthening given troubles in Italy and Europe as well as the UK not to mention economic slowing in China, the dollar index actually fell 0.5 percent in the week. This pulls down its year-to-date gain to less alarming 4.5 percent which reverses only about half of last year's nearly 10 percent decline. An accelerating pace of losses has been the unwanted theme of the stock market over the last six weeks as a nearly double-digit year-to-date gain for the Dow has now evaporated to only 2.8 percent with the Nasdaq shedding more than 10 percentage points of gain to 5.0 percent. And the latest sessions haven't shown much let up in the selling with the Dow, at 25,413, down 2.2 percent on the week and the Nasdaq, at 7,247, down 2.1 percent. The flight out of stocks has been finding its way into Treasuries and especially in the latest week as the 10-year yield fell a sharp 12 basis points to 3.07 percent with the 2-year down an especially steep 13 basis points to 2.81 percent. If a Santa Claus rally is a no show during the holidays and if equities continue to be sold, the bond market may continue to benefit in what could be a positive offset for the Fed's year-end balance-sheet unwinding push. For the dollar, though there's been lots of concern of unwanted strengthening given troubles in Italy and Europe as well as the UK not to mention economic slowing in China, the dollar index actually fell 0.5 percent in the week. This pulls down its year-to-date gain to less alarming 4.5 percent which reverses only about half of last year's nearly 10 percent decline.
| Markets at a Glance |
Year-End |
Week Ended |
Week Ended |
Year-To-Date |
Weekly |
|
2017 |
9-Nov-18 |
16-Nov-18 |
Change |
Change |
| DJIA |
24,719.22 |
25,989.30 |
25,413.22 |
2.8% |
-2.2% |
| S&P 500 |
2,673.61 |
2,781.01 |
2,736.27 |
2.3% |
-1.6% |
| Nasdaq Composite |
6,903.39 |
7,406.90 |
7,247.87 |
5.0% |
-2.1% |
|
|
|
|
|
|
| Crude Oil, WTI ($/barrel) |
$60.15 |
$59.86 |
$56.80 |
-5.6% |
-5.1% |
| Gold (COMEX) ($/ounce) |
$1,305.50 |
$1,209.90 |
$1,222.40 |
-6.4% |
1.0% |
|
|
|
|
|
|
| Fed Funds Target |
1.25 to 1.50% |
2.00 to 2.25% |
2.00 to 2.25% |
75 bp |
0 bp |
| 2-Year Treasury Yield |
1.89% |
2.94% |
2.81% |
92 bp |
−13 bp |
| 10-Year Treasury Yield |
2.41% |
3.19% |
3.07% |
66 bp |
−12 bp |
| Dollar Index |
92.29 |
96.94 |
96.45 |
4.5% |
-0.5% |
Jerome Powell is of course facing strong resistance to the Fed's rate-hike path from President Trump yet he doesn't appear to be facing much resistance at all from within the Fed, based at least on this year's uninterrupted series of unanimous FOMC votes . And Powell may even be a dovish influence based on the minutes from the September FOMC when "a number" of the 17 members, who were concerned that inflation could begin to exceed the Fed's 2 percent, broached the possibility of having to move rates into the "restrictive" zone. But based on the actual economic data that has been coming out, worries over excessive inflation seem no more than theoretical, centering as they have all along on the diminishing supply of available labor and the related risk of wage inflation. Whether demand for labor will maintain its pace or even continue to accelerate is uncertain though the next major discovery on this point is right at hand – the success or failure of the holiday shopping season.
Housing and its expected troubles look to headline a Thanksgiving shortened week, starting Monday with the housing market index from the nation's homebuilders where no improvement is expected followed on Tuesday by housing starts and permits with a limited gain for the former the call and no gain for the latter. Existing home sales are out on Wednesday but here, despite missing expectations month after month, sizable improvement is the consensus. Wednesday, because of Thursday's holiday, will see a dense pack of data that will also include durable goods orders, where aircraft is expected to skew the report lower, and also the consumer sentiment index where moderation is expected. Data return on Friday with the composite PMI which is expected to see manufacturing outpacing services.
Housing Market Index for November
Consensus Forecast: 68
Consensus Range: 66 to 69
November's housing market index is expected to hold unchanged in November at 68. The October report showed the first rise in the index since July.
Housing Starts for October
Consensus Forecast, Annualized Rate: 1.240 million
Consensus Range: 1.180 to 1.269 million
Building Permits
Consensus Forecast: 1.260 million
Consensus Range: 1.224 to 1.285 million
Comparisons are weak and easy but forecasters see an October gain for only housing starts and not permits. Econoday's consensus for housing starts is a 1.240 million annualized rate vs 1.201 million in September with permits seen at a 1.260 million rate vs 1.270 million (1.241 million initially reported and since revised).
Durable Goods Orders for October
Consensus Forecast, Month-to-Month Change: -2.4%
Consensus Range: -3.5% to -1.0%
Durable Goods Orders, Ex-Transportation
Consensus Forecast: 0.4%
Consensus Range: 0.2% to 1.0%
Durable Goods Orders, Core Capital Goods (Nondefense Ex-Aircraft)
Consensus Forecast: 0.3%
Consensus Range: 0.2% to 1.5%
Reflecting an expected downturn in aircraft orders especially defense aircraft, a reversal is the expectation for October durable goods orders where the consensus is calling for a 2.4 percent dip vs September's increase of 0.7 percent (revised from an initial 0.8 percent). But ex-transportation orders are expected to improve to a 0.4 percent increase vs no change in September. Capital goods orders were also weak in September, slipping for a second straight month. October expectations for core capital goods (nondefense ex-air) are calling for a 0.3 percent rebound.
Initial Jobless Claims for November 17 week
Consensus Forecast: 213,000
Consensus Range: 210,000 to 215,000
Initial jobless claims have been steady at historically low levels. Forecasters see little change for the November 17 week at a consensus 213,000 vs 216,000 in the November 10 week.
Consumer Sentiment Index, Preliminary November
Consensus Forecast: 98.3
Consensus Range: 98.0 to 99.0
At a consensus 98.3, the consumer sentiment index is expected to ease slightly in the preliminary reading for November. October's final reading was 98.6 with the month's preliminary reading at 99.0.
Existing Home Sales for October
Consensus Forecast, Annualized Rate: 5.200 million
Consensus Range: 5.100 to 5.350 million
Existing home sales have missed Econoday's consensus for six straight reports with October's consensus at a 5.200 million annualized rate. This would be up sizably from September's 5.150 million which, besides being nearly a 3-year low, also missed the low end of the consensus range. Resales of both single-family homes and condos have been showing similar weakness.
Index of Leading Economic Indicators for October
Consensus Forecast, Month-to-Month Change: 0.1%
Consensus Range: -0.2% to 0.2%
The consensus for October's index of leading economic indicators is a slight gain of 0.1 percent vs a 0.5 percent increase in September. Positives are likely to include predictable gains for the report's credit and yield-spread measures along with strength in consumer expectations with the main negative, however, certain to be the stock market.
PMI Composite for November Flash
Consensus Forecast: 54.8
Consensus Range: 53.3 to 55.0
PMI Manufacturing
Consensus Forecast: 55.5
Consensus Range: 53.0 to 56.2
PMI Services
Consensus Forecast: 54.5
Consensus Range: 53.4 to 55.0
A bounce back for services and steady strength for manufacturing gave a 1.0 point boost to 54.9 for the composite PMI in October (revised from an initial 54.8). The consensus for November's PMI composite is for steady and solid strength at 54.8, split between a services consensus of 54.5 and a manufacturing consensus at 55.5.
|
