|
It's a flashy week of economic news that includes good news, bad news, fake outs and rare records. It's a week of factory strengths but also factory weaknesses and tales in the housing sector that have yet to be told.
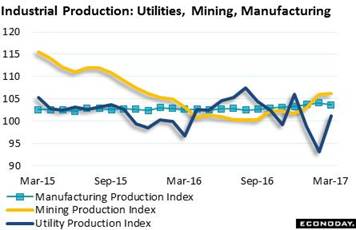 The unusual warmth of February set March up for the sharpest monthly jump ever in utility output, at 8.6 percent. These data, part of the industrial production report, go back to 1939. Outside of utilities, however, production was flat with mining posting only an incremental gain while manufacturing, where factory hours were down in March, fell sharply to end 6 straight months of improvement. Manufacturing makes up the great bulk, about 3/4, of the industrial sector. The unusual warmth of February set March up for the sharpest monthly jump ever in utility output, at 8.6 percent. These data, part of the industrial production report, go back to 1939. Outside of utilities, however, production was flat with mining posting only an incremental gain while manufacturing, where factory hours were down in March, fell sharply to end 6 straight months of improvement. Manufacturing makes up the great bulk, about 3/4, of the industrial sector.
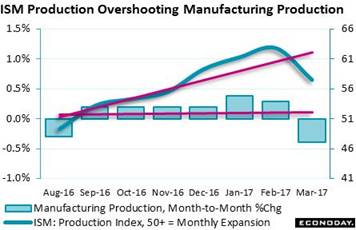 The drop in manufacturing was clearly signaled by weekly hours in the March employment report. Offering an equivocal signal, however, was the ISM production index where monthly change does slope lower but still, at 57.6, remains well above 51 which is the level the Bureau of Economic Analysis pegs as no change in volumes. Lining up 0.0 percent with 51 on the x-axis and adding trend lines reveal the contrast: advance data sharply higher, actual data dead flat. The drop in manufacturing was clearly signaled by weekly hours in the March employment report. Offering an equivocal signal, however, was the ISM production index where monthly change does slope lower but still, at 57.6, remains well above 51 which is the level the Bureau of Economic Analysis pegs as no change in volumes. Lining up 0.0 percent with 51 on the x-axis and adding trend lines reveal the contrast: advance data sharply higher, actual data dead flat.
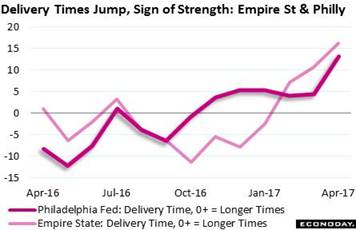 The rare strength of advance factory data is a major feature of the post-election economy, whether the ISM or any of the regional reports. The Philly Fed's delivery index has been surging the past 6 months to signal slowing in delivery times. This is a supply chain imbalance associated with strong activity and tightening congestion. Empire State's 16.1 delivery index is the highest in 16 years of available data while Philly's, at 13.2, is the highest in 13 years. The rare strength of advance factory data is a major feature of the post-election economy, whether the ISM or any of the regional reports. The Philly Fed's delivery index has been surging the past 6 months to signal slowing in delivery times. This is a supply chain imbalance associated with strong activity and tightening congestion. Empire State's 16.1 delivery index is the highest in 16 years of available data while Philly's, at 13.2, is the highest in 13 years.
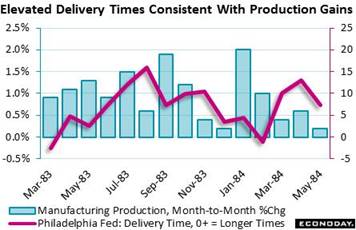 The ongoing strength of the delivery signal is very rare, occurring only a handful of times over the Philly Fed's 50 years of data. One such run of delays occurred in 1983-84 and coincided with the greatest surge ever, at 1 to 2 percent monthly clips, for actual manufacturing production. Many advance signals, like ISM production, may indeed be overstating activity but delivery readings right now have an eerie feel and may be a veiled hint that overheating is actually a risk. The ongoing strength of the delivery signal is very rare, occurring only a handful of times over the Philly Fed's 50 years of data. One such run of delays occurred in 1983-84 and coincided with the greatest surge ever, at 1 to 2 percent monthly clips, for actual manufacturing production. Many advance signals, like ISM production, may indeed be overstating activity but delivery readings right now have an eerie feel and may be a veiled hint that overheating is actually a risk.
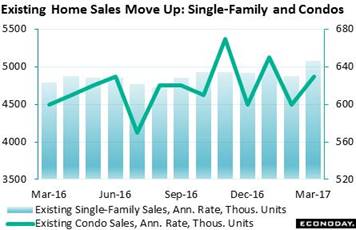 Overheating is a periodic hazard for housing which has, however, been quiet this expansion. Sales rates edged to cycle highs late last year but then stalled, that is until lately. Existing home sales bolted higher in March with condo sales up 5.0 percent to a 630,000 annualized rate and single-family homes up 4.3 percent to a 5.080 million rate. New homes sales will be updated on Tuesday of the coming week and will follow a very strong report for this series in February. Overheating is a periodic hazard for housing which has, however, been quiet this expansion. Sales rates edged to cycle highs late last year but then stalled, that is until lately. Existing home sales bolted higher in March with condo sales up 5.0 percent to a 630,000 annualized rate and single-family homes up 4.3 percent to a 5.080 million rate. New homes sales will be updated on Tuesday of the coming week and will follow a very strong report for this series in February.
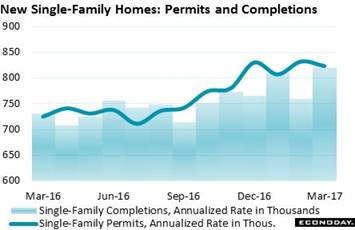 The strong jobs market is the foundation for home sales with the ongoing decline in mortgage rates also a positive. Holding back sales, however, has been a thin stock of new homes on the market. Yet judging by single-family permits, which are at a 823,000 annualized rate and up 13.5 percent from this time last year, plenty of new stock is on the way. And a sharp gain for March completions, at an 819,000 rate, should offer an immediate boost for spring sales. The strong jobs market is the foundation for home sales with the ongoing decline in mortgage rates also a positive. Holding back sales, however, has been a thin stock of new homes on the market. Yet judging by single-family permits, which are at a 823,000 annualized rate and up 13.5 percent from this time last year, plenty of new stock is on the way. And a sharp gain for March completions, at an 819,000 rate, should offer an immediate boost for spring sales.
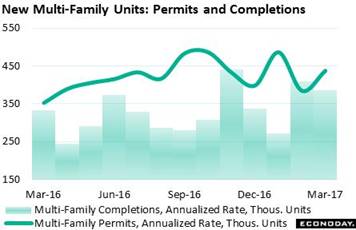 The numbers are thinner and much choppier on the multi-family side but the story is the same — that is solid permit growth and completions getting done. Permits, at a 437,000 rate, are up 24 percent year-on-year with completions showing visible strength the past 2 months. Multi-family permits hit their peak in the third-quarter last year but it takes an average of 15 months for permits to wind up as completions (about half that time on the single-family side). The numbers are thinner and much choppier on the multi-family side but the story is the same — that is solid permit growth and completions getting done. Permits, at a 437,000 rate, are up 24 percent year-on-year with completions showing visible strength the past 2 months. Multi-family permits hit their peak in the third-quarter last year but it takes an average of 15 months for permits to wind up as completions (about half that time on the single-family side).
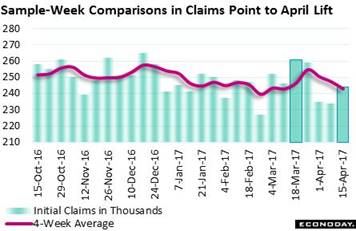 Whether housing accelerates will depend on the labor market. The January and February employment reports were strong but were followed by a weather-flattened March. Yet March gives April an easy comparison, evident in initial jobless claims that are coming down. A look at claims during the mid-month sample weeks of the March and April employment reports points to strength: headline down 17,000 to 244,000, 4-week average down 4,250 to 243,000. Whether housing accelerates will depend on the labor market. The January and February employment reports were strong but were followed by a weather-flattened March. Yet March gives April an easy comparison, evident in initial jobless claims that are coming down. A look at claims during the mid-month sample weeks of the March and April employment reports points to strength: headline down 17,000 to 244,000, 4-week average down 4,250 to 243,000.
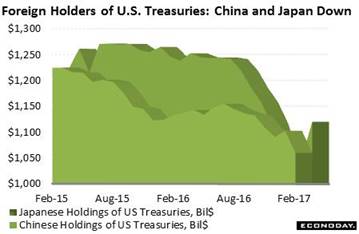 The week's lost gem is the Treasury International Capital report where cross-border investment flows are tracked. Inflows, which are badly needed to help offset the nation's trade deficit, have been held back the past half year by heavy Chinese and Japanese selling of U.S. Treasuries. Chinese holdings have thinned to the tune of $200 billion with Japanese holdings down by $100 billion. When it comes to trade talks, large Treasury holdings can be major bargaining chips. The week's lost gem is the Treasury International Capital report where cross-border investment flows are tracked. Inflows, which are badly needed to help offset the nation's trade deficit, have been held back the past half year by heavy Chinese and Japanese selling of U.S. Treasuries. Chinese holdings have thinned to the tune of $200 billion with Japanese holdings down by $100 billion. When it comes to trade talks, large Treasury holdings can be major bargaining chips.
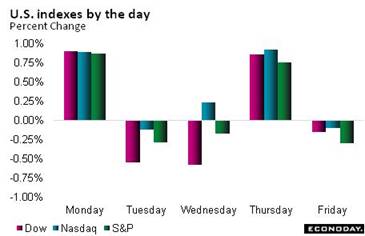 The assumption in the bond market is that the economy will extend its ongoing trend, growing at no more than a modest to moderate pace but enough to ensure that the Fed, facing full employment and risk of an inflation flash point, will continue to withdraw stimulus, — that is raise rates at least 2 more times this year as well as outline and perhaps initiate the unwinding of its $4.5 trillion balance sheet. Recent strength in housing supports this scenario but the strength of data from the factory and consumer sectors is less certain. A rate hike at the May FOMC isn't and never was expected and June is 50-50 at most. But if June doesn't produce action, then expected action — and risk of increased market volatility — will have to be compressed into the second half of the year. Stocks posted solid gains in the week yet bonds, despite two prior weeks of heavy buying, showed no profit taking with the 10-year yield, as high as 2.40 percent at the beginning of the month, little changed at 2.22 percent. The assumption in the bond market is that the economy will extend its ongoing trend, growing at no more than a modest to moderate pace but enough to ensure that the Fed, facing full employment and risk of an inflation flash point, will continue to withdraw stimulus, — that is raise rates at least 2 more times this year as well as outline and perhaps initiate the unwinding of its $4.5 trillion balance sheet. Recent strength in housing supports this scenario but the strength of data from the factory and consumer sectors is less certain. A rate hike at the May FOMC isn't and never was expected and June is 50-50 at most. But if June doesn't produce action, then expected action — and risk of increased market volatility — will have to be compressed into the second half of the year. Stocks posted solid gains in the week yet bonds, despite two prior weeks of heavy buying, showed no profit taking with the 10-year yield, as high as 2.40 percent at the beginning of the month, little changed at 2.22 percent.
| Markets at a Glance |
Year-End |
Week Ended |
Week Ended |
Year-To-Date |
Weekly |
|
2016 |
14-Apr-17 |
21-Apr-17 |
Change |
Change |
| DJIA |
19,762.60 |
20,453.25 |
20,547.76 |
4.0% |
0.5% |
| S&P 500 |
2,238.83 |
2,328.95 |
2,348.69 |
4.9% |
0.8% |
| Nasdaq Composite |
5,383.12 |
5,805.15 |
5,910.52 |
9.8% |
1.8% |
|
|
|
|
|
|
| Crude Oil, WTI ($/barrel) |
$53.71 |
$52.91 |
$50.26 |
-6.4% |
-5.0% |
| Gold (COMEX) ($/ounce) |
$1,152.50 |
$1,290.10 |
$1,286.50 |
11.6% |
-0.3% |
|
|
|
|
|
|
| Fed Funds Target |
0.50 to 0.75% |
0.75 to 1.00% |
0.75 to 1.00% |
25 bp |
0 bp |
| 2-Year Treasury Yield |
1.21% |
1.21% |
1.18% |
–3 bp |
–3 bp |
| 10-Year Treasury Yield |
2.45% |
2.23% |
2.22% |
–23 bp |
–1 bp |
| Dollar Index |
102.26 |
100.58 |
99.96 |
-2.2% |
-0.6% |
The first quarter came to an uneven end and the second quarter is now just beginning. Extending acceleration from housing would be a big boost for the Spring quarter and a definitive vote of confidence from the consumer. Yet manufacturing data outside of deliveries and consumer spending data outside of housing have been no better than flat. And pluses that the 2017 economy may not enjoy, as perhaps many had expected, are tax cuts and fiscal stimulus both of which, given deadlock in Washington, could very well grind out in slow motion.
The first look at what looks to be a soft first quarter will headline the week's data on Friday. The week starts getting heavy on Tuesday with home price updates from FHFA and Case-Shiller, where strength has been constructive but still limited, followed by consumer confidence which surged to yet greater highs in the prior report. Thursday's heavy run includes durable goods, where aircraft may once again skew orders higher, and advance data on the nation's trade gap that could prove a swing factor for Friday's GDP report. Econoday's consensus for fourth-quarter GDP is only 1.1 percent in what would be a slow start to the year. Not to be forgotten Friday will be the employment cost index, a closely watched barometer for wage inflation that has been showing modest pressure.
National Activity Index for March
Consensus Forecast: 0.3
Consensus Range: 0.0 to 0.5
The national activity index continues to run just under historical trend with production the recent weak link and personal consumption & housing no help. Forecasters see the index, boosted in part by March's utility output, in the plus column at 0.3.
Dallas Fed General Activity Index for April
Consensus Forecast: 15.0
Consensus Range: 14.5 to 18.5
The Dallas Fed general activity index has emerged from 2-1/2 years of deep contraction with surging strength that points to recovery for the energy sector. At a consensus 15.0 in April, forecasters see the general activity index holding at a very strong rate of growth.
FHFA House Price Index for February
Consensus Forecast, Month-to-Month %Chg: 0.4%
Consensus Range: 0.2% to 0.5%
The FHFA house price index had been showing some the best strength of any indicator on household wealth but came to a standstill in January with a monthly no change and a 5 tenths drop in the year-on-year rate to 5.7 percent that is now tracking at Case-Shiller's 20-city pace. The consensus is calling for a moderate 0.4 percent monthly rebound in February that, however, isn't likely to give much lift to the year-on-year rate.
Case-Shiller, 20-City Adjusted Index for February
Consensus Forecast, Month-to-Month Change: 0.6%
Consensus Range: 0.4% to 0.9%
Case-Shiller, 20-City Unadjusted Index
Consensus Forecast, Year-on-Year Change: 5.8%
Consensus Range: 5.7% to 5.9%
Case-Shiller shot 0.9 percent higher in January to lift the year-on-year pace toward the 6 percent line at 5.7 percent, which is a very solid rate of appreciation in a low interest rate economy. Forecasters, at a consensus 0.6 percent monthly gain and 5.8 percent yearly rate, are looking for the Case-Shiller 20-city index to extend its strength in the February report.
New Home Sales for March
Consensus Forecast, Annualized Rate: 584,000
Consensus Range: 574,000 to 605,000
New home sales jumped more than 6 percent in February to a 592,000 annualized pace as builders appeared to give price concessions, with the median down sharply and back under $300,000 at $296,200. Existing home sales proved very strong in March and forecasters see the month's rate for new home sales coming back only slightly to 584,000.
Consumer Confidence Index for April
Consensus Forecast: 123.6
Consensus Range: 119.0 to 126.0
Increasingly upbeat assessments of the labor market along with positive expectations for rising incomes have been fueling the strongest run in consumer confidence since the dotcom days of irrational exuberance. Acceleration in this index has far surpassed acceleration in the rival consumer sentiment index and has beaten the Econoday consensus in 4 of the last 5 month. Forecasters see the consumer confidence index retracing some of its gains in April, at a consensus 123.6 vs March's 125.6.
Richmond Fed Manufacturing Index for April
Consensus Forecast: 16.0
Consensus Range: 15.0 to 20.0
The Richmond Fed's manufacturing index wasn't the first regional report to begin climbing sharply higher but it has been very strong so far this year. Unusual strength in both new orders and backlog orders highlight this report. Forecasters see the April index coming in at a very solid 16.0 vs March's unusually strong 22.
Durable Goods Orders for February
Consensus Forecast, Month-to-Month Change: 1.1%
Consensus Range: -0.3% to 4.3%
Durable Goods Orders, Ex-Transportation
Consensus Forecast: 0.4%
Consensus Range: 0.0% to 0.8%
Durable Goods Orders, Core Capital Goods (Nondefense Ex-Aircraft)
Consensus Forecast: 0.2%
Consensus Range: 0.1% to 0.4%
Aircraft has been giving a significant boost so far this year to durable goods orders which otherwise have been soft and not living up to the surge underway in advance reports. Both factory hours and manufacturing production fell sharply in March which are bad omens for April. Yet Boeing orders were unusually strong in March and forecasters see durable goods orders rising 1.1 percent with the ex-transportation consensus, however, showing less strength at a moderate 0.4 percent. Orders for core capital goods, which have been sliding and pointing to weak business investment, are expected to rise only 0.2 percent.
International Trade In Goods for March
Consensus Forecast, Month-to-Month Change: -$65.3 billion
Consensus Range: -$66.8 to -$63.0 billion
Weak exports combined with strong demand for imported consumer goods and vehicles continue to make for deep trade deficits. March's trade gap in goods is seen holding steady at $65.3 billion vs February's $65.0 billion in what would be neutral for first-quarter GDP expectations. Advance March data for wholesale and retail inventories will also be released with this report.
Initial Jobless Claims for April 22 week
Consensus Forecast: 243,000
Consensus Range: 240,000 to 245,000
Initial jobless claims are expected to hold steady in the April 22 week, at a consensus 243,000 in what would be a 1,000 decrease from the prior week's 244,000. Unemployment claims have been very low and favorable the past couple of years and are indicating strong employer demand for labor.
Pending Home Sales Index for March
Consensus Forecast, Month-to-Month Change: -0.4%
Consensus Range: -1.2% to 3.7%
Month-to-month swings in existing home sales have been accurately telegraphed by the pending home sales index which tracks initial contract signings. This index had been up-and-down in prior readings and then surged 5.5 percent in February to foretell what were unusually strong final sales in March. Forecasters see only limited give back, at a consensus minus 0.4 percent.
Real GDP: 1st Quarter, 1st Estimate, Annualized Rate
Consensus Forecast: 1.1%
Consensus Range: 0.7% to 1.7%
Real Consumer Spending: 1st Quarter, 1st Estimate, Annualized Rate
Consensus Forecast: 0.7%
Consensus Range: 0.4% to 1.5%
GDP Price Index
Consensus Forecast: 2.1%
Consensus Range: 1.4% to 2.4%
First-quarter GDP is expected to be soft, at a consensus 1.1 percent price-adjusted annualized pace, down from an already soft 2.1 percent in the fourth quarter. Consumer spending was very solid in the fourth quarter, at a 3.5 percent pace, but is seen slowing to only 0.7 percent on weak vehicle sales and lower heating bills. The GDP price index is expected to hold steady at 2.1 percent.
Employment Cost Index for 1st Quarter
Consensus Forecast, Quarter-to-Quarter Change: 0.6%
Consensus Range: 0.5% to 0.8%
Benefit costs have been slowing as has the employment cost index which posted a moderate 0.5 percent quarterly gain and a year-on-year increase of only 2.2 percent, fourth-quarter results consistent with lack of wage traction in the labor market. Forecasters are calling for slightly more strength in the first quarter with the Econoday consensus at 0.6 percent.
Chicago PMI for April
Consensus Forecast: 56.5
Consensus Range: 55.0 to 58.4
The Chicago PMI is often volatile but did show outstanding strength in March at a 57.7 reading. Inventories have been building and deliveries have been slowing, in this case both signs of strength. Forecasters see the March index falling back from 57 scores in the prior 2 months to a consensus 56.5 in April. Note that this index tracks both the manufacturing and non-manufacturing sectors of the Chicago-area economy.
Consumer Sentiment Index, Final April
Consensus Forecast: 98.0
Consensus Range: 95.0 to 98.5
The consumer sentiment index had been sagging from post-election highs but regained ground in the preliminary April reading to a very strong 98.0. Despite the strength in confidence, expectations for inflation have been unusually subdued. Econoday's consensus for final April sentiment is 98.0.
|
