|
Economic signals are becoming a little equivocal. Most of the solid good news continues to be concentrated in the labor market with less-than-robust numbers coming out of the factory sector and the housing market. And now there is one unusual signal of slowing coming from the largest sector of all.
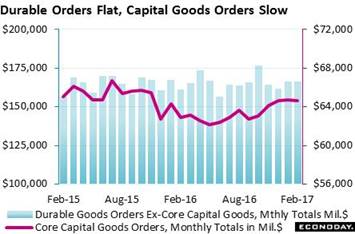 Let's start with manufacturing where a major breakout has been the continuing signal from most of the advance reports. In actual hard data, manufacturing production did rise in January and February but separate numbers on orders are far from standout. If it wasn't for two months of strength in aircraft, durable goods orders would be basically flat. And decidedly weak is the verdict for core capital goods (nondefense ex-aircraft) where orders have actually been totally flat, at $64.6 billion in February vs $64.7 billion the two months before. This points to lack of investment in new equipment and contrasts with the great strength being shown in business confidence. Let's start with manufacturing where a major breakout has been the continuing signal from most of the advance reports. In actual hard data, manufacturing production did rise in January and February but separate numbers on orders are far from standout. If it wasn't for two months of strength in aircraft, durable goods orders would be basically flat. And decidedly weak is the verdict for core capital goods (nondefense ex-aircraft) where orders have actually been totally flat, at $64.6 billion in February vs $64.7 billion the two months before. This points to lack of investment in new equipment and contrasts with the great strength being shown in business confidence.
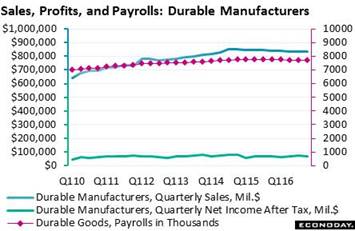 As a group, durable manufacturers are marking time through 2-1/2 years of flat conditions, a lull triggered by the 2014 collapse in oil prices and the resulting contraction in energy demand and energy equipment. Generally weak foreign markets have not been a help. Fourth-quarter sales for the group totaled $835 billion, down slightly from fourth-quarter 2015 and down 2.1 percent from the cycle peak of $853 billion in fourth-quarter 2014. The group's profits totaled $72 billion in the latest quarter which is down 12 percent from the $83 billion cycle peak in third-quarter 2014. Flat results make, of course, for flat employment as durable payrolls, for the last 2-1/2 years, have been stuck at 7.7 million. Durables, by the way, are closely tracked and are considered leading indicators for wider changes through the whole economy. As a group, durable manufacturers are marking time through 2-1/2 years of flat conditions, a lull triggered by the 2014 collapse in oil prices and the resulting contraction in energy demand and energy equipment. Generally weak foreign markets have not been a help. Fourth-quarter sales for the group totaled $835 billion, down slightly from fourth-quarter 2015 and down 2.1 percent from the cycle peak of $853 billion in fourth-quarter 2014. The group's profits totaled $72 billion in the latest quarter which is down 12 percent from the $83 billion cycle peak in third-quarter 2014. Flat results make, of course, for flat employment as durable payrolls, for the last 2-1/2 years, have been stuck at 7.7 million. Durables, by the way, are closely tracked and are considered leading indicators for wider changes through the whole economy.
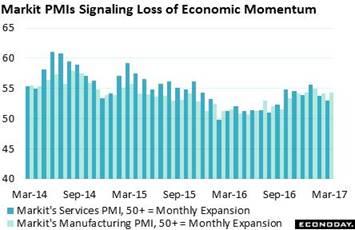 Of all the advance reports on the factory sector the one not going through the roof is the PMI from Markit Economics where the manufacturing flash for March, at 54.3, came in below expectations. Even more interesting is Markit's services flash which came in well below expectations at 52.9 to signal the slowest rate of monthly expansion since September. Respondents are citing customer caution this month and are reporting slowing in employment, especially in the services sample where job creation is at a 3-year low. And in a negative for future hiring, backlog orders in both samples are starting to fall. If the economy does begin to slow, we can look back at these March flashes as the first clues. Of all the advance reports on the factory sector the one not going through the roof is the PMI from Markit Economics where the manufacturing flash for March, at 54.3, came in below expectations. Even more interesting is Markit's services flash which came in well below expectations at 52.9 to signal the slowest rate of monthly expansion since September. Respondents are citing customer caution this month and are reporting slowing in employment, especially in the services sample where job creation is at a 3-year low. And in a negative for future hiring, backlog orders in both samples are starting to fall. If the economy does begin to slow, we can look back at these March flashes as the first clues.
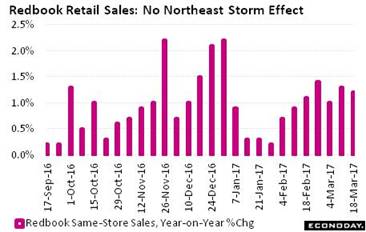 A wildcard that may be at play in the slowing PMIs, and one that poses a risk to consumer spending in March, is the giant Category 3 snowstorm that swept the East coast at mid-month, one of the heaviest in 20 years. But Redbook, which tracks week-to-week retail sales, is showing very little effect if any, with same-store annual sales growth holding at a moderate 1.2 percent in the March 18 week vs 1.3 percent in the prior week. Another wildcard is the slow tax refund season. At 62.5 million, total refunds are down 4.5 percent from this time last year though the total dollar amount, reflecting a 1.0 percent rise in the average refund to $2,931, is down a bit less, 3.5 percent lower at $183 billion. A wildcard that may be at play in the slowing PMIs, and one that poses a risk to consumer spending in March, is the giant Category 3 snowstorm that swept the East coast at mid-month, one of the heaviest in 20 years. But Redbook, which tracks week-to-week retail sales, is showing very little effect if any, with same-store annual sales growth holding at a moderate 1.2 percent in the March 18 week vs 1.3 percent in the prior week. Another wildcard is the slow tax refund season. At 62.5 million, total refunds are down 4.5 percent from this time last year though the total dollar amount, reflecting a 1.0 percent rise in the average refund to $2,931, is down a bit less, 3.5 percent lower at $183 billion.
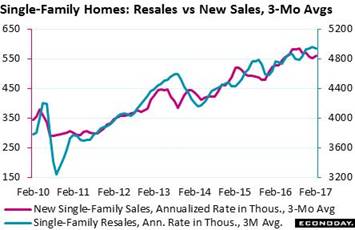 Delays in refunds may or may not affect someone's decision to buy a house but heavy weather is definitely a negative for traffic which is something to watch for in March home sales. February data, despite what were unseasonably warm temperatures last month, failed to show much lift. New home sales did improve but resales moved backwards. Home sales are some of the most volatile reports on the calendar which make the 3-month average a necessity as tracked in the graph. Housing is still on the climb but the gains have flattened out. Delays in refunds may or may not affect someone's decision to buy a house but heavy weather is definitely a negative for traffic which is something to watch for in March home sales. February data, despite what were unseasonably warm temperatures last month, failed to show much lift. New home sales did improve but resales moved backwards. Home sales are some of the most volatile reports on the calendar which make the 3-month average a necessity as tracked in the graph. Housing is still on the climb but the gains have flattened out.
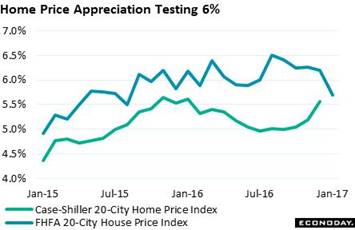 A puzzle in the housing market has been the relationship between supply, which is very low, and prices where traction has really been no better than moderate. In an unusually weak showing, the FHFA house price index came in unchanged in January with year-on-year appreciation falling a steep 5 tenths to 5.7 percent. This is the weakest month-to-month result in more than 4 years and the weakest year-on-year rate since August 2015. This is at a time when supply is pointing to very strong conditions, at only 3.8 months for resales which is down 6 weeks from this time last year. And days on the market are very tight, at 45 vs 59 days a year ago. A highlight of the coming week will be Case-Shiller's report which tracks resale prices and which, in another housing puzzle, now appears to be violently converging with FHFA. A puzzle in the housing market has been the relationship between supply, which is very low, and prices where traction has really been no better than moderate. In an unusually weak showing, the FHFA house price index came in unchanged in January with year-on-year appreciation falling a steep 5 tenths to 5.7 percent. This is the weakest month-to-month result in more than 4 years and the weakest year-on-year rate since August 2015. This is at a time when supply is pointing to very strong conditions, at only 3.8 months for resales which is down 6 weeks from this time last year. And days on the market are very tight, at 45 vs 59 days a year ago. A highlight of the coming week will be Case-Shiller's report which tracks resale prices and which, in another housing puzzle, now appears to be violently converging with FHFA.
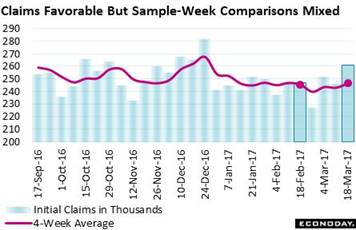 A low light, however, of the latest week came from the Labor Department which had to correct 3 months of jobless claims data. And the correction, tied to seasonal adjustments, shows an unfavorable ratcheting higher in the most recent readings, up 26,000 for first-time claims going back to the February 27 week. A comparison between the March 18 week and the February 18 week -- which matches up the sample weeks of the monthly employment report -- are now slightly unfavorable, with the weekly comparison showing a tangible 14,000 rise which is offset, however, by very little change in the 4-week average. Continuing claims were also revised but only marginally. A low light, however, of the latest week came from the Labor Department which had to correct 3 months of jobless claims data. And the correction, tied to seasonal adjustments, shows an unfavorable ratcheting higher in the most recent readings, up 26,000 for first-time claims going back to the February 27 week. A comparison between the March 18 week and the February 18 week -- which matches up the sample weeks of the monthly employment report -- are now slightly unfavorable, with the weekly comparison showing a tangible 14,000 rise which is offset, however, by very little change in the 4-week average. Continuing claims were also revised but only marginally. 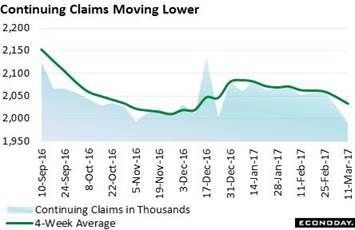 Data here lag by a week with the March 11 week now back under 2 million at 1.990 million. One highlight that did not change is a move lower in the unemployment rate for insured workers which is now at a rock bottom 1.4 percent (this excludes job leavers and re-entrants). But the revision did scratch what had been a record of sorts, a 210,000 showing for initial claims in the February 25 week which the department said at the time was the lowest since 1969. Now, the February 25 week is at a less spectacular but still very favorable 227,000. Data here lag by a week with the March 11 week now back under 2 million at 1.990 million. One highlight that did not change is a move lower in the unemployment rate for insured workers which is now at a rock bottom 1.4 percent (this excludes job leavers and re-entrants). But the revision did scratch what had been a record of sorts, a 210,000 showing for initial claims in the February 25 week which the department said at the time was the lowest since 1969. Now, the February 25 week is at a less spectacular but still very favorable 227,000.
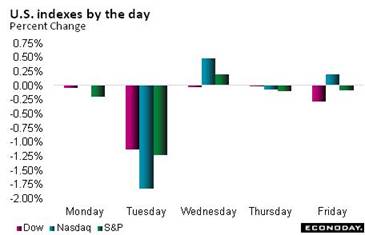 In a week of breaking headlines, the political might of Donald Trump was the week's focus. The opening struggle to repeal Obamacare is a reminder that, like Janet Yellen keeps telling us, the administration's programs will take time to hash out and put in place. Judging by the markets, which have already priced in a great deal of Trump magic, the week was not blockbuster. But losses were limited with the Dow dropping a less-than-disastrous 1.5 percent in the week to end at 20,596 and with the dollar index down only 0.5 percent but back under 100 at 99.74. In perhaps a more direct hint that animal spirits are fading, demand for the safety of Treasuries rose sharply in the week. The 2-year yield fell 6 basis points in the week to 1.26 percent with the 10-year down 9 basis points to 2.41 percent. In a week of breaking headlines, the political might of Donald Trump was the week's focus. The opening struggle to repeal Obamacare is a reminder that, like Janet Yellen keeps telling us, the administration's programs will take time to hash out and put in place. Judging by the markets, which have already priced in a great deal of Trump magic, the week was not blockbuster. But losses were limited with the Dow dropping a less-than-disastrous 1.5 percent in the week to end at 20,596 and with the dollar index down only 0.5 percent but back under 100 at 99.74. In perhaps a more direct hint that animal spirits are fading, demand for the safety of Treasuries rose sharply in the week. The 2-year yield fell 6 basis points in the week to 1.26 percent with the 10-year down 9 basis points to 2.41 percent.
| Markets at a Glance |
Year-End |
Week Ended |
Week Ended |
Year-To-Date |
Weekly |
|
2016 |
17-Mar-17 |
24-Mar-17 |
Change |
Change |
| DJIA |
19,762.60 |
20,914.62 |
20,596.72 |
4.2% |
-1.5% |
| S&P 500 |
2,238.83 |
2,378.25 |
2,343.98 |
4.7% |
-1.4% |
| Nasdaq Composite |
5,383.12 |
5,901.00 |
5,828.74 |
8.3% |
-1.2% |
|
|
|
|
|
|
| Crude Oil, WTI ($/barrel) |
$53.71 |
$48.79 |
$48.07 |
-10.5% |
-1.5% |
| Gold (COMEX) ($/ounce) |
$1,152.50 |
$1,229.50 |
$1,249.10 |
8.4% |
1.6% |
|
|
|
|
|
|
| Fed Funds Target |
0.50 to 0.75% |
0.75 to 1.00% |
0.75 to 1.00% |
25 bp |
25 bp |
| 2-Year Treasury Yield |
1.21% |
1.32% |
1.26% |
5 bp |
–6 bp |
| 10-Year Treasury Yield |
2.45% |
2.50% |
2.41% |
–4 bp |
–9 bp |
| Dollar Index |
102.26 |
100.23 |
99.74 |
-2.5% |
-0.5% |
Despite all the jobs and all the confidence, the economy is closing out what has been an unspectacular first quarter. Seasonal adjustments (even when they're properly applied) often make for outsized effects during the winter months when activity, especially for the consumer, slows. But the central concern is the lack of business investment in new equipment where current weakness points to future and continuing weakness for productivity. Weeks like this won't be pulling forward expectations for Federal Reserve rate hikes.
The economy appears to have been flattening this quarter and forecasters see mixed results for this week's heavy slate of data. A narrowing in the goods deficit is expected and would help first-quarter GDP, and sizable increases are expected for Case-Shiller home prices and pending home sales, both of which have been in uneven. The Dallas and Richmond Feds are expected to post strong reports with both the consumer confidence and consumer sentiment indexes seen holding steady at high levels. But the weakness lies in expectations for Friday's personal income and spending report which is expected to show only moderate strength on the income side and disappointment for spending.
Dallas Fed General Activity Index for March
Consensus Forecast: 22.0
Consensus Range: 20.0 to 25.3
The Dallas Fed general activity index has emerged from 2-1/2 years of deep contraction with surging strength that points to recovery for the energy sector. At a consensus 22.0 in March, forecasters see the general activity index holding on to the bulk its enormous February surge to 24.5.
International Trade In Goods for February
Consensus Forecast, Month-to-Month Change: -$66.5 billion
Consensus Range: -$67.5 to -$65.0 billion
Strong imports of consumer goods and vehicles more than offset export strength in industrial supplies to set back the trade balance in January. Forecasters see the nation's trade gap in goods narrowing in February to $66.5 billion from January's oversized $69.7 billion. Goods exports have been improving, starting 2016 at about $120 billion per month and moving up to about $125 billion by year's end. But imports of goods also trended higher, moving from $180 billion to $190 billion.
Case-Shiller, 20-City Adjusted Index for January
Consensus Forecast, Month-to-Month Change: 0.8%
Consensus Range: 0.6% to 0.9%
Case-Shiller, 20-City Unadjusted Index
Consensus Forecast, Year-on-Year Change: 5.7%
Consensus Range: 5.6% to 5.7%
Lack of resales on the market has been keeping home prices firm. The Case-Shiller 20-city index jumped an outsized 0.9 percent in December with year-on-year appreciation rising 4 tenths to 5.6 percent. Forecasters, at a consensus 0.8 percent monthly gain and 5.7 percent yearly rate, are looking for extending strength in the January report in what would contrast with softness for the FHFA house price index.
Consumer Confidence Index for March
Consensus Forecast: 113.5
Consensus Range: 110.0 to 115.0
Unusual strength in confidence readings has been the standout feature of the post-election economy. The consumer confidence index has yet to slow, pressing to new cycle highs in February as the spread between optimists and pessimists continued to widen. The March consensus for the consumer confidence index is 113.5 in what would be only a small downtick from February's 114.8.
Richmond Fed Manufacturing Index, March
Consensus Forecast: 15.0
Consensus Range: 15.0 to 15.0
The Richmond Fed's manufacturing index has, like other regional Fed surveys, been signaling significant strength. New orders and backlogs were very strong in the February report and are expected to underpin strength in March. In a rare sweep, all 5 forecasters for this index are calling for steady and solid strength at 15.0.
Pending Home Sales Index for February
Consensus Forecast, Month-to-Month Change: 1.8%
Consensus Range: 1.4% to 3.0%
Month-to-month swings in existing home sales have been correctly telegraphed by the pending home sales index which tracks initial contract signings. This index has been up-and-down the last three readings underscoring the slow and uneven pace of the housing sector. Forecasters see strength for the February index where the Econoday consensus is for a 1.8 percent gain.
Real GDP, 4th Quarter, 3rd Estimate, Annualized Rate
Consensus Forecast: 2.0%
Consensus Range: 1.9% to 2.0%
Consumer Spending, 4th Quarter, 3rd Estimate, Annualized Rate
Consensus Forecast: 3.0%
Consensus Range: 2.9% to 3.1%
GDP Price Index
Consensus Forecast: 2.0%
Consensus Range: 2.0% to 2.0%
The third estimate of fourth-quarter GDP is expected to come in at a consensus 2.0 percent annualized pace, up from 1.9 percent in the first two estimates. A rise in inventories was an unwanted plus in the quarter while net exports were decidedly weak. Consumer spending got an upgrade in the second estimate to a 3.0 percent annualized pace where forecasters expect it to hold. The GDP price index is expected to remain at 2.0 percent in lagging confirmation that the Federal Reserve's price targets are being met.
Initial Jobless Claims for March 25 week
Consensus Forecast: 247,000
Consensus Range: 243,000 to 255,000
The trend for jobless claims has been clouded by a correction to prior data, one tied to seasonal adjustments and which has lifted levels of recent readings. Claims in the March 18 week have been revised 3,000 higher to 261,000 with the weekly increase at a sizable 15,000. Forecasters see initial claims in the March 25 week falling back to trend, down 14,000 to 247,000.
Personal Income for February
Consensus Forecast, Month-to-Month Change: 0.4%
Consensus Range: 0.3% to 0.5%
Consumer Spending
Consensus Forecast, Month-to-Month Change: 0.2%
Consensus Range: 0.1% to 0.3%
PCE Price Index
Consensus Forecast, Month-to-Month Change: 0.1%
Consensus Range: 0.1% to 0.1%
PCE Price Index
Consensus Forecast, Year-on-Year Change: 2.1%
Consensus Range: 2.1% to 2.1%
Core PCE Price Index
Consensus Forecast, Month-to-Month Change: 0.2%
Consensus Range: 0.2% to 0.3%
Core PCE Price Index
Consensus Forecast, Year-on-Year Change: 1.7%
Consensus Range: 1.7% to 1.8%
On a nominal basis, personal income has been growing in the modest 3 to 3-1/2 percent range the past year though wages & salaries have been in the 4 percent range. Consumer spending has been on a moderate rise to the 4 percent range, again before inflation. For January, forecasters see income rising a monthly 0.4 percent with spending up only 0.2 percent in what points to softness for first-quarter GDP. Key in this report will be the PCE price index which has been on the rise and is expected to post a monthly gain of 0.1 percent to keep the year-on-year rate at 2.1 percent. The core PCE (less food & energy) is expected to rise 0.2 percent with this yearly rate holding at 1.7 percent and safely below the Federal Reserve's 2 percent target.
Chicago PMI for March
Consensus Forecast: 57.1
Consensus Range: 55.0 to 59.0
New orders were the strength of the Chicago PMI in February which rose sharply to 57.6 from a very soft 50.3 in January. Forecasters, at a consensus 57.1 in March, see the index giving back only a small fraction of its February improvement. Volatility is common for this closely watched index which tracks both the manufacturing and non-manufacturing sectors of the Chicago-area economy.
Consumer Sentiment Index, Final March
Consensus Forecast: 97.6
Consensus Range: 94.7 to 98.4
The consumer sentiment index had been edging back but not in the March flash which came in at 97.6, within a point of its post-election high and where forecasters expect it to remain in the final reading. The report is noting extreme polarization in its sample, between Democrats whose expectations are near record lows and Republicans whose expectations are near record highs. The swing factor has been independents who have been closer to Republicans in their optimism.
|
