Equities had a strong year across the board. While the economy has slowed much in line with the Fed's soft landing plan, the year-end economic news was upbeat.
Recap of US Markets
STOCKS
Despite initial concerns at mid-year about the rise in interest rates related to the Fed's 17 consecutive rate increases, the economy did not derail and most equity indexes performed better in the second half than in the first. For the year as a whole, small caps and blue chips led the way almost equally. The Russell 2000 - a small cap index for the most part - posted a 17.0 percent increase in 2006 while the Dow - comprised of large, established companies - rose 16.3 percent and the S&P 500 advanced 13.6 percent. The market as a whole was quite healthy as the Wilshire 5000 - the most comprehensive measure of the market - advanced 13.9 percent. The laggard was the Nasdaq which is heavily weighted with technology firms and rose by 9.5 percent in 2006.

By quarters, the fourth quarter was the strongest for all indexes except for the Russell. All indexes posted losses in the second quarter except for the Dow, which was little better than flat. Interest rate increases during the first half pushed equities down while expectations of the Fed cutting rates and lower oil prices helped boost stocks in the final quarter.

In the final week of the year, equities rose on Tuesday and Wednesday largely due to declines in oil prices which led markets to believe the Fed might ease soon. Also, reports of moderate retail sales over the holidays supported the belief the Fed might ease soon. On Thursday, a rebound in existing housing sales helped to shoot down fears of recession but also raised concerns about interest rates if housing demand picked up. Profit taking also played a role in Thursday's dip after healthy gains earlier in the week. Equities were listless on Friday but with most indexes declining on profit taking.

For the week, all major indexes were up: the Dow, up 1.0 percent; the S&P 500, up 0.5 percent; the Nasdaq, up 0.6 percent; and the Russell 2000, up 0.9 percent.
For the month of December, blue chips led the way with the Dow posting a 2.0 percent gain, followed by the S&P500 with a 1.3 percent rise. The Wilshire 5000 and Russell 2000 advanced, 1.0 percent and 0.2 percent, respectively. The Nasdaq fell 0.7 percent over the month.

How well have equities performed compared to pre-recession levels' Everyone knows that the Dow has been setting record highs over the fourth quarter but other indexes have struggled to regain highs prior to the 2001 recession. Others have soared. Despite all the headlines about new highs, it is the Dow that has lagged many other indexes. The Dow is up only 8.4 percent from its 1999 end-of-year close. Meanwhile, the Dow transportations and Dow utilities are up 53.2 percent and 61.2 percent, respectively, from the close of 1999.

Turning to S&P indexes, the big guys have lagged. The S&P 500 is still marginally below its 1999 close - below 3.5 percent. Meanwhile the mid caps are up 80.9 percent and the small caps are up an even stronger 102.2 percent.

The broadest measure of U.S. equities - the Wilshire 5000 - finally surpassed its 1999 close during the final weeks of 2006 and is up a modest 3.2 percent. Small caps in the Russell 2000 ended 2006 up a robust 56.1 percent over its 1999 close. Technology stocks generally are still low as the Nasdaq remains well below its 1999 close - still down 40.6 percent.

BONDS
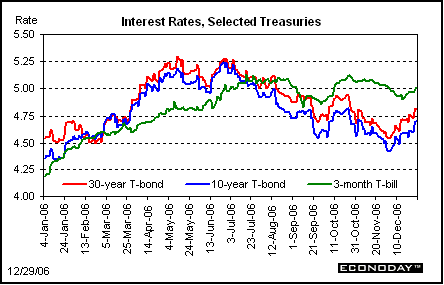
The bond market had a volatile ride last year as seen in changes in the yield curve. The year started out with a mostly normal yield curve as short rates were below intermediate rates and intermediate rates were below the 30-year T-bond. By mid-year, the yield curve was sharply inverted due to the Fed's tightening with the fed funds target rate moving from 4-1/4 percent at the end of 2005 to 5-1/4 percent by the end of June. Also, higher inflation numbers and a boost in inflation expectations had pushed the long bond up to as high as 5.28 percent in late June. By year end, however, the Fed's tighter policy was working as inflation expectations eased and the markets began to build in rates cuts for 2007. In turn, the long bond fell to 4.42 percent in early December before firming to 4.81 for the close of 2006. The 3-month T-bill, however, remained pegged to the still high fed funds rate.

Over the year, the 3-month T-bill largely tracked changes in the Fed funds target. Longer rates were boosted early in the year by strong economic growth and higher inflation numbers. During the second half, more moderate economic growth, lower oil prices, and specifically a decline in housing helped bring rates down. Rates did firm somewhat in the final weeks of the year due to strong consumer spending numbers from the Commerce Department and tight labor market figures from the Labor Department.

During the last week of 2006, there was a moderate bump in rates. This was mainly due to stronger housing sales data which raised fears of stronger demand for loanable funds and higher interest rates. Also, the Chicago purchasing managers index rebounded and consumer confidence rose unexpectedly. Rates rose last week by 3 basis points to 10 basis points.

Markets at a Glance

Weekly percent change column reflects percent changes for all components except interest rates. Interest rate changes are reflected in simple differences.
The Economy
Last week we had limited economic data due to the short week. However, there were increased signs that housing has bottomed.
New homes rebound, housing may have bottomed
The biggest news last week were the gains in both new homes sales and in existing home sales. The biggest risk to the economy according to the "recession bears" was that housing would continue to fall and pull the rest of the economy down. But last week, the Census Bureau reported that sales of new homes rebounded 3.4 percent in November, following a 3.8 percent dip the month before. November's sales pace stood at an annual rate of 1.047 million units.

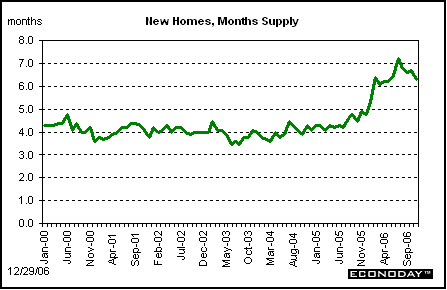
The other big news from this report was a drop in supply to 6.3 months from 6.7 months in October. Inventory overhang keeps new construction down, threatening construction jobs and income as well as weighing on home prices. Prices did firm somewhat in November, rising 3.2 percent to $251,700. Year-on-year prices reversed course in November, rising 5.8 percent. This is good news for those worrying that weakness in housing prices would undermine consumer confidence and spending.

Existing home sales show second consecutive increase
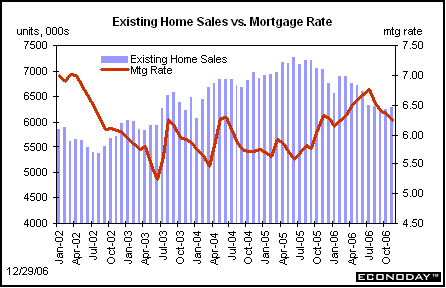
Last Thursday, existing home sales added to the view that housing may have bottomed. Existing home sales rose 0.6 percent in November to an annual rate of 6.280 million units. Gains were centered in condos though the closely watched single-family category did show a modest gain.
Also, the supply numbers showed modest improvement, edging down to 7.3 months supply from 7.4 in October.

Certainly, more good months of data are needed to claim that housing has bottomed. Also, sales may have bottomed but supply is still high. It is still likely to be several months before starts pick up any strength along with construction jobs.
Nonetheless, the unexpected improvement in housing is what boosted interest rates moderately in the latter part of the week. The good new is that the odds of recession have gone down.
Bernanke and the Fed get a boost in credibility in 2006
At the start of the year, some questioned how well the Fed would conduct monetary policy with the new and untried Fed chairman, Ben Bernanke, at the helm. When the Fed ended 17 consecutive increases in the fed funds target with a no change policy decision at the August 8 FOMC, some questioned whether the Fed was underestimating the strength of inflation, given the strong core CPI numbers over spring and summer and high labor costs growth. By autumn with housing in a tail spin, many then wondered whether the Fed should have stopped interest rate hikes sooner and start to cut rates. But the Fed held steady, core inflation has come down, and there are now signs that housing is bottoming. All said, Chairman Bernanke and the Fed appear to have gotten monetary policy right and the economy is on the Goldilock's "soft landing" to mix metaphors. Chairman Bernanke ended the year appearing the wiser by the markets.

Last year did see a significant shift in forecasts for interest rates, according to the fed funds futures market. At mid-year, the markets were expecting the Fed to continue raising rates to 5-1/2 percent and hold Fed funds there into 2007.

Over the second half of the year, markets lowered their expectations for short-term interest rates. This first was because of a belief by many that economic growth was going to slow too much. By year-end, fears of recession had diminished while actual inflation numbers and inflation expectations came down, replacing fears of recession as the reasons for expecting lower interest rates.

The bottom line
For the equity markets, 2006 was a very good year. At year end, economic data showed a mild improvement in economic growth and lower inflation. Although rates bumped up somewhat at year end, they remain relatively low. These factors point to another good year for equities in 2007.
Looking Ahead: Week of January 2 through January 5
Wednesday
The Institute for Supply Management's manufacturing index fell below the breakeven level of 50 in November, slipping to 49.5 in November from 51.2 in October. The last time the PMI was below 50 was April 2003. After last week's unexpected improvement in the Chicago PMI, markets will be watching to see if ISM's national index will rebound also.
ISM manufacturing index Consensus Forecast for December 06: 50.0
Range: 49.0 to 52.5
Construction spending declined 1.0 percent in October following a 0.8 percent drop September. October's drop was led by residential construction but nonresidential outlays also fell. While housing sales picked up a little in last week's reports, it is too soon to have an impact on actual construction and weakness in outlays will likely continue into early 2007.
Construction spending Consensus Forecast for November 06: -0.5 percent
Range: -0.7 to +0.7 percent
Motor vehicle sales slipped to an 11.8 million rate in November from 12.3 million in October. Sales were soft in both autos and light trucks.
Motor vehicle sales Consensus Forecast for December 06: 12.5 million-unit rate
Range: 12.3 to 12.5 million-unit rate
Thursday
Initial jobless claims edged up 1,000 in the week ending December 23 to 317,000. Initial claims had rebounded by 10,000 the prior week. The four-week average dropped 10,250 and is near the current weekly level. Year-end weekly data are volatile due to large seasonal swings in hiring.
Jobless Claims Consensus Forecast for 12/30/06: 315,000
Range: N/A
Factory orders fell a 4.7 percent in October, led by a drop in durables. But we have the more recent November numbers for durables orders from the advance report which showed a 1.9 percent rebound. We will see a similar figure for durables push up overall factory orders for November unless the nondurables component comes with a sharp decline. Manufacturing is still soft outside of aircraft and the markets will be watching all key components.
Factory orders Consensus Forecast for November 06: +1.5 percent
Range: +1.1 to +2.1 percent
The business activity index from the ISM non-manufacturing survey rose to 58.9 in November from 57.1 in October. The report showed improvement in new orders, backlogs, and in employment.
Business activity index Consensus Forecast for December 06: 58.0
Range: 57.0 to 58.5
Friday
Nonfarm payroll employment posted a 132,000 gain in November, following a revised 79,000 rise in October. In the latest report, payroll gains were healthy in services while construction and manufacturing were weak. The unemployment rate remained low despite an uptick to 4.5 percent from 4.4 percent in October. And despite tight labor markets, average hourly earnings slowed to a 0.2 percent gain in November, following a 0.4 percent gain in October. The average workweek in November was reported at 33.9 hours, unchanged from October. The tight labor market remains the largest concern of the Fed for ensuring that inflation pressures come down before lowering interest rates.
Nonfarm payrolls Consensus Forecast for December 06: 100,000
Range: 45,000 to 125,000
Unemployment rate Consensus Forecast for December 06: 4.5 percent
Range: 4.4 to 4.5 percent
Average workweek Consensus Forecast for December 06: 33.9 hours
Range: 33.9 to 33.9 hours
Average hourly earnings Consensus Forecast for December 06: +0.3 percent
Range: +0.3 to +0.4 percent


