The volatility apparent in May carried into the first two days of June. Inflationary fears and with them, the prospect of higher interest rates, permeated investor thinking. The follow up worry is the impact on corporate profits if growth slows. The severity of the global May sell-off caught many by surprise. There was no big economic shock, nor any major change to corporate fundamentals. Both are the main drivers of profits and equity prices. But the sustainability of soaring commodity prices and record setting equity indexes while the dollar was sinking and global interest rates were climbing is questionable. At some point, investors would begin to worry about soaring inflation and/or higher interest rates. And either would lower growth prospects.
To many market observers, the volatility that occurred was inevitable after a period of relative calm. But history suggests that volatility moves through irregular but violent periods. While markets are subdued, investors, and especially equity investors, are lulled by a false sense of security and take on increased risk because they become less concerned about experiencing significant losses. But when bad news breaks, prices fall and those who have borrowed to invest have to cut positions, and volatility increases.
All indexes tracked here were down in May, with several losing all of their 2006 gains and then some. Those were the Nikkei and Topix in Japan and the Kospi in South Korea. The U.S. Nasdaq was below its 2005 close at the end of May as well.

The volatility continued as May finally ended - which was none too soon for most investors. Some equity indexes showed signs of stabilizing as June began. But Friday's trading was governed by the weaker-than-expected U.S. employment report. While the European indexes' positive gains eroded, the dollar sank. And the downward pressures on the dollar continued as a weak factory orders report followed the weak employment report. On the week, the all ordinaries, Hang Seng, Nasdaq and the S&P/TSX composite recorded gains.

Europe and the UK
Equities in the UK, France and Germany lost ground in both the month of May and the past week. At one point during the month (May 22), the FTSE fell to its lowest level since mid-December 2005, but it managed to fight its way back and ended up 2 percent in the month. As to be expected, the three indexes faltered after the U.S. payrolls and factory orders news. They lost much of the gains prior to their releases but recovered after the data also suggested economic growth was slowing. This eased some of the concerns that global interest rates were set to continue rising.

The FTSE 100 had its worst monthly performance since January 2003 and it was a deeper drop than the previous three corrections since the bull run began in March 2003. (These corrections took place in April 2004, February 2005 and October 2005.) Investors are still nervous as shown by a clear shift into defensive stocks. The earlier losses in May were attributed to an unusual wave of derivatives activity by large investment banks and hedge funds. Traders had already been unnerved by the declines in Asian and emerging markets. Mining company stocks were sold as metal prices declined.
However, the consensus view is that corporate profitability is still too high, stock market valuations too reasonable and merger and acquisition activity too robust to suggest that the correction would turn into a bear market for stocks. But on the other hand, it's hard to believe that equities will make significant gains as long as uncertainty remains about inflation and where U.S. interest rates will peak.
Asia/Pacific
Just as in Europe, Asian/Pacific stocks had a tough month in May as well, dropping the most in nearly four years. The all ordinaries was the best performer and it was down 4.5 percent in the month. However, the Nikkei and Topix were down for the second month and both were over 4 percent below their December 31, 2005 levels when the month ended. The Kospi was down in May and was also 4 percent below its end of year level. And things did not improve last week. Only the Hang Seng and the all ordinaries improved on the week. And even though the Nikkei, Topix and STI were up in the first two days in June, they only managed to make a dent in the losses incurred earlier in the week. The main reason for the declines was on fears of U.S. consumer weakness (based on a lower consumer confidence reading), which in turn would negatively impact the area's exports.

Currencies
The dollar sank against the euro and yen after the U.S. employment situation report implied that growth was slowing. Traders lowered the odds for another Federal Reserve interest rate increase at the end of the month. Unlike bond traders, higher interest rates are favorable to currency traders. Previously, the dollar had climbed higher after the May 10th Fed minutes showed that the FOMC might continue its string of interest rate increases. Despite price pressures, the Fed could use the employment report as an excuse to pause. But there will be practically an entire month of new data before the committee meets on June 29th including all important price data. Another negative for the dollar is the upcoming merchandise trade report on Friday. The concern over the ever increasing deficit is most apparent in the foreign exchange markets.

The Bank of Japan injected ¥1,500 billion ($13.3 billion, �10.5 billion, �7.2 billion) into the money market as it desperately sought to keep overnight interest rates under control. The BoJ had injected ¥500 billion the previous week for the same reason as speculation heightened that the Bank would increase interest rates as soon as their mid-June meeting. The latest injection came as overnight rates once again tested the 0.1 percent ceiling, calling into question the central bank's ability to keep rates at effectively zero and in line with its stated policy. In March, the BoJ ended five years of ultra-loose monetary policy aimed at slaying deflation, and switching instead to a policy of targeting interest rates. Following the injection, the overnight call rate or the rate at which banks borrow from one another, dropped back into the 0.07 to 0.08 percent range and higher than when overnight money was virtually free.
Indicator scoreboard
EMU - March industrial production was up 0.4 percent and 3.8 percent when compared with March of 2005. Output was down in Germany, Greece and Italy. These were offset with gains elsewhere. Intermediate goods output was up 0.9 percent while capital goods output edged up 0.1 percent. However, both consumer durable and nondurable output were down on the month.

April M3 money supply was up 8.8 percent when compared with the same month a year ago. M3 for the three months ending in April was up 8.4 percent when compared with the same three months a year ago. The moving average is preferred by the ECB and is used in its policy analysis. It has a target rate of growth of 4.5 percent, substantially below the current rate.

May flash harmonized index of consumer prices were up 2.5 percent when compared with last year. The HICP was up 2.4 percent in the previous month. This is above the ECB's inflation ceiling of 2 percent. As with all flash estimates, only the overall on year change was available.

April seasonally adjusted unemployment rate remained at 8 percent for the second month. The largest drop occurred in Germany, where the Eurostat calculated harmonized rate of unemployment (which differs from national methodology) declined from 8.7 percent to 8.2 percent. Otherwise the improvement was broad based with only Belgium reporting a slight increase.

First quarter real and seasonally adjusted gross domestic product was up 0.6 percent and 1.9 percent when compared with last year. Private consumption improved in the first quarter. It was up 0.7 percent in contrast to 0.1 percent in the previous quarter. But domestic demand was not as strong - it was up 0.3 percent in the first quarter after climbing 0.5 percent in the fourth quarter.

May purchasing managers' index edged up to 57 from 56.7 in April. Both input and output price indexes were up. Input prices climbed to 71.1 from 65.5 in April while the output price reading was up to 55.6 from 54.8 in the prior month. An index reading above 50 signifies growth - and the higher the number the faster the growth. Industry output inched up to 59.5 from 59.3 in the previous month offsetting a slowdown in new orders to 58.9 from 59.5.

April producer price index was up 0.8 percent and 5.4 percent when compared with last year. Energy prices were up 2.1 percent and 17.6 percent on the year. Excluding energy, the PPI was up 0.4 percent and 2.2 percent on the year.

EU - May economic sentiment index climbed to 106.7 from 105.7 in April. Industrial confidence was positive for the second month, increasing to a reading of 2 from 1 in the previous month. Services sentiment increased to plus 19 from plus 18 in April. Retail and construction sentiment were unchanged at minus 1 and minus 3 respectively. Consumer sentiment edged up to minus 9 from minus 10 in April. Overall confidence was up in Germany and France but was down in Italy.

Germany - First quarter gross domestic product was up 0.4 percent and 1.4 percent when compared with the same quarter a year ago. Government expenditures were up 0.6 percent on the quarter and 0.9 percent on the year. Equipment investment jumped by 2.2 percent and was up 4.6 percent on the year. Exports and imports were up 4.6 percent and 4.5 percent respectively on the quarter and 11.4 percent and 13.6 percent on the year.

April total retail sales soared 4.3 percent and were up 2.9 percent when compared with last year. Excluding autos and gasoline stations, retail sales were up 2.8 percent on the year.

May seasonally adjusted unemployment was down 93,000 with a decline of 43,000 in the East and 50,000 in the West. This translates to a decline in unemployment rates across the board. The total unemployment rate declined to 11 percent from 11.3 percent. In the East, unemployment rate declined to 17.5 percent from 17.9 percent. In the West, the unemployment rate dropped to 9.3 percent from 9.5 percent. Employment was helped by demand for workers to help with the World Cup, which will be held in Germany this month.

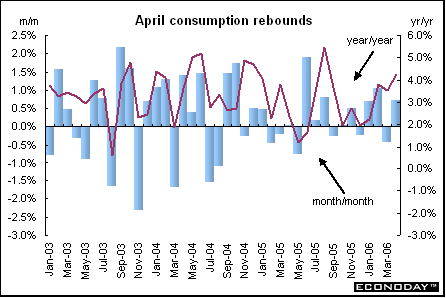
France - April consumer spending on manufactured goods was up 0.7 percent and 4.3 percent when compared with last year. Clothing sales rebounded by 4.7 percent after sinking 6.1 percent in March. However, household durables were down 2.7 percent.
April unemployment rate declined to 9.3 percent from 9.5 percent in March. The number of unemployed persons declined by 39,000. Unemployment is defined according to the International Labour Organisation's definition which excludes those job seekers who did any work during the month.

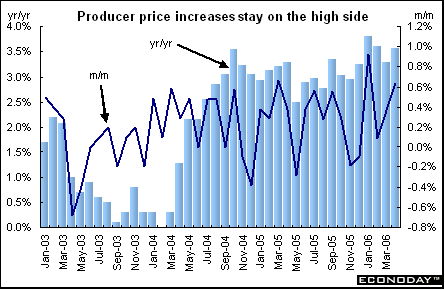
April producer price index was up 0.6 percent and 3.6 percent when compared with last year. Excluding food and energy, the PPI was up a benign 0.3 percent and 1.4 percent on the year. Energy prices were up 2.6 percent and 13 percent on the year. Semi-finished goods were up 0.7 percent and 2.8 percent on the year.
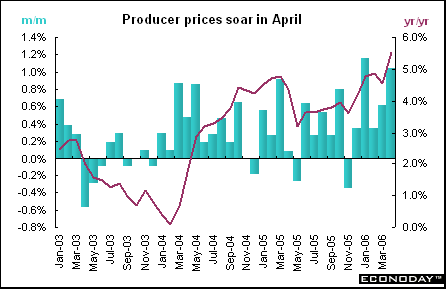
Italy - April producer price index was up 1 percent and 5.5 percent when compared with last year. Energy goods prices jumped 3.4 percent and soared 20.2 percent on the year. Excluding energy, the PPI was up 0.5 percent and 2.2 percent on the year.
Britain - April consumer price index was up 0.6 percent and 2.0 percent when compared with last year. Prices were up for food & non-alcoholic beverages, air fares and gas & electricity. Core CPI, which excludes energy, food, alcoholic beverages and tobacco, was up 1.3 percent on the year. The retail price index excluding mortgage interest payments was up 0.8 percent and 2.4 percent on the year.

First quarter gross domestic product was up 0.6 percent and 2.2 percent when compared with the same quarter a year ago. The service sector, which accounts for about 73 percent of the economy, was up 0.8 percent on the quarter, boosted by strength in areas such as accounting, architecture and engineering. However, there was a slowdown in the output of the distribution, hotels and catering sector, a trend that was reflected in less exuberant demand from the consumer. Household expenditures were up 0.2 percent, down from the fourth quarter's gain of 0.7 percent. Manufacturing grew by 0.7 percent, helped by the production of transport equipment and electrical and optical items. Exports were up by 4.7 percent while imports were up by 5.5 percent.

Asia
Japan - First quarter gross domestic product was up 0.5 percent and 3 percent when compared with the same quarter a year ago. On an annualized basis GDP was up 1.9 percent. Domestic demand was up by 1.7 percent on an annualized basis. Exports were up 2.7 percent but imports were up 3 percent, partly because of higher commodity prices and partly due to comparisons with the weak fourth quarter. As a result, net exports - the initial catalyst for Japan's strongest recovery since the bubble - were a slight net drag on growth. The GDP deflator dropped 1.3 percent for the 32nd straight quarterly decline. Many in the Japanese government are suggesting that the Bank of Japan use the deflator rather than the CPI, which has increased for six straight months, to decide when deflation has come to an end.

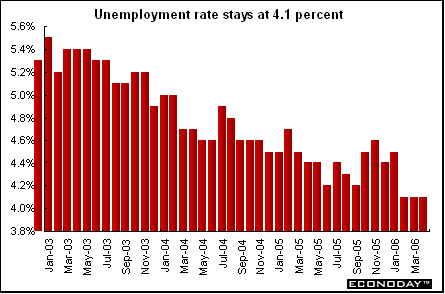
April unemployment rate was 4.1 percent for the third month. The job-to-applicant ratio, which shows how many jobs are available to a job seeker, rose to 1.04 in April from 1.01 in March.
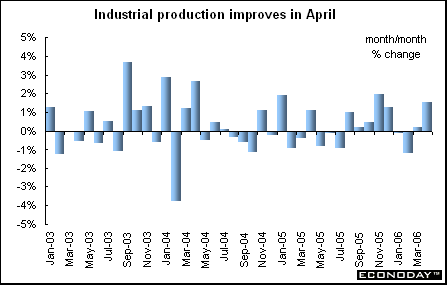
April industrial production was up 1.5 percent and 3.8 percent when compared with last year. Industries that contributed to the increase were general machinery, transport equipment and fabricated metals.
Australia - April retail sales were up 1.4 percent and 7.4 percent when compared with last year. Clothing and soft goods were among the groups showing gains, at 2.7 percent on the month while recreational goods were up 2 percent. Department store sales were up 1.5 percent while hospitality and services were up 1.3 percent.

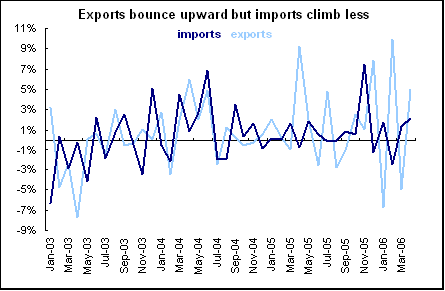
April merchandise trade deficit narrowed to A$1.1 billion from A$1.5 billion in March. Exports jumped 5 percent while imports were up 2.2 percent. Non-rural and other goods exports were up 8 percent while rural exports were down 2 percent.
Americas
Canada - April industrial product price index was up 1.3 percent and 2.2 percent when compared with last year. Higher prices for petroleum products and primary metal products were the major contributors to the increase. Petroleum and coal products prices were up 9.6 percent on the month. Excluding petroleum and coal product prices the IPPI was up 0.5 percent. Prices for primary metal products rose 6.4 percent while prices for primary copper products were up 25 percent, refined zinc products were up 30.7 percent, primary nickel products were up 20 percent, silver products up 18.8 percent and refined gold products were up 7.4 percent.

April raw materials price index was up 5.7 percent and 12.9 percent when compared with last year. The increase was due primarily to higher prices for crude oil and non-ferrous metals. Mineral fuels increased 6.8 percent on the month while crude oil prices jumped by 10.4 percent, mainly due to increased concerns over supply.
The Canadian dollar was up 1.2 percent against the U.S. dollar in April. As a result, the IPPI excluding the effect of the exchange rate would have been up 1.7 percent instead of 1.3 percent. When compared with last year, the Canadian dollar increased in value by 8.1 percent. If the impact of the exchange rate had been excluded, producer prices would have risen 4.3 percent on the year rather than their actual increase of 2.2 percent.
First quarter gross domestic product was up 0.9 percent and 3.2 percent when compared with the same quarter a year ago. On an annualized basis GDP was up 3.8 percent. Consumption expenditures were up 1.1 percent and 3.6 percent on the year. Investment expenditures were up 2.2 percent and 7.6 percent on the year. Prices as measured by the chain price index were down 0.7 percent in the quarter, thanks for the most part to declining energy prices. Excluding energy, prices increased 0.7 percent.

Bottom line
Monthly meetings of the Reserve Bank of Australia, Bank of England and the European Central Bank are on tap during this week. Analysts expect the ECB to continue its series of interest rate increases, which would increase its current 2.5 percent rate to 2.75 percent. The flash harmonized index of consumer prices is now up 2.5 percent on the year, far above the ECB's ceiling of 2 percent. And there are signs that the core HICP (which excludes energy and unprocessed food) is also picking up. The RBA surprised analysts and increased their key interest rate last month, but it is not expected to add another increase this month. Bank of England watchers are split on what to expect. In the minutes of the May meeting, monetary policy committee members were split three ways. While the majority voted for no change in the policy interest rate which is currently 4.5 percent, there were votes to both increase and lower the rate as well.

