|
Once again geopolitical events around the globe captured the attention of investors even though critical new economic data were released. On Thursday, the United States said it was moving ahead with imposing the steel and aluminum tariffs on Mexico, Canada and the EU, ending months of uncertainty about potential exemptions and sending a chill through financial markets. Retaliatory measures have in turn been announced on U.S. products. There were also protests from U.S. business leaders as worries of a trade war escalated.
The tariff move by the U.S. overshadowed a gathering of the Group of Seven finance ministers and central bankers Thursday. The meeting was set to focus on reducing income inequality, but trade concerns have made U.S. Treasury Secretary Steven Mnuchin the top target for bilateral complaints and lobbying from disgruntled allies. Concern about Trump’s hardening approach to trade dominated the discussion panel as top policymakers from the United States, Britain, Germany, France, Italy, Japan and Canada gathered in the alpine village of Whistler, British Columbia, Canada.
On the week, most global equity indexes retreated. They were also mostly lower for the month of May.
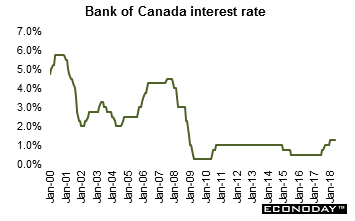 As widely anticipated, the Bank of Canada kept its key interest rate at 1.25 percent where it has been since January of this year. The Bank Rate is correspondingly 1.5 percent and the deposit rate is 1.0 percent. In its statement, the BoC said that developments since its April meeting further reinforced the Governing Council’s view that higher interest rates will be warranted to keep inflation near target. The Governing Council will take a gradual approach to policy adjustments and continue to be data dependent. In particular, the Bank will continue to assess the economy’s sensitivity to interest rate movements and the evolution of economic capacity. As widely anticipated, the Bank of Canada kept its key interest rate at 1.25 percent where it has been since January of this year. The Bank Rate is correspondingly 1.5 percent and the deposit rate is 1.0 percent. In its statement, the BoC said that developments since its April meeting further reinforced the Governing Council’s view that higher interest rates will be warranted to keep inflation near target. The Governing Council will take a gradual approach to policy adjustments and continue to be data dependent. In particular, the Bank will continue to assess the economy’s sensitivity to interest rate movements and the evolution of economic capacity.
The BoC said in its statement that inflation in Canada has been close to the 2 percent target and will likely be a bit higher in the near term than forecast in April, largely because of recent increases in gasoline prices. Core measures of inflation remain near 2.0 percent, consistent with an economy operating close to potential. As usual, the Bank will look through the transitory impact of fluctuations in gasoline prices.
According to the BoC, global economic activity remains broadly on track with the Bank’s April Monetary Policy Report (MPR) forecast. Recent data point to some upside to the outlook for the U.S. economy. At the same time, ongoing uncertainty about trade policies is dampening global business investment and stresses are developing in some emerging market economies. Global oil prices have been higher than assumed in April, in part reflecting geopolitical developments.
| |
|
2017 |
2018 |
% Change |
|
Index |
Dec 29 |
May 25 |
June 1 |
Week |
May |
2018 |
| Asia/Pacific |
|
|
|
|
|
|
|
| Australia |
All Ordinaries |
6167.3 |
6141.0 |
6104.0 |
-0.6% |
0.9% |
-1.0% |
| Japan |
Nikkei 225 |
22764.9 |
22450.8 |
22171.4 |
-1.2% |
-1.2% |
-2.6% |
|
Topix |
1817.56 |
1771.70 |
1749.2 |
-1.3% |
-1.7% |
-3.8% |
| Hong Kong |
Hang Seng |
29919.2 |
30588.0 |
30492.9 |
-0.3% |
-1.1% |
1.9% |
| S. Korea |
Kospi |
2467.5 |
2460.8 |
2439.0 |
-0.9% |
-3.7% |
-1.2% |
| Singapore |
STI |
3402.9 |
3513.2 |
3427.5 |
-2.4% |
-5.1% |
0.7% |
| China |
Shanghai Composite |
3307.2 |
3141.3 |
3075.1 |
-2.1% |
0.4% |
-7.0% |
|
|
|
|
|
|
|
|
| India |
Sensex 30 |
34056.8 |
34924.87 |
35227.3 |
0.9% |
0.5% |
3.4% |
| Indonesia |
Jakarta Composite |
6355.7 |
5975.7 |
5983.6 |
0.1% |
-0.2% |
-5.9% |
| Malaysia |
KLCI |
1796.8 |
1797.4 |
1756.4 |
-2.3% |
-6.9% |
-2.3% |
| Philippines |
PSEi |
8558.4 |
7647.5 |
7630.3 |
-0.2% |
-4.1% |
-10.8% |
| Taiwan |
Taiex |
10642.9 |
10942.3 |
10949.1 |
0.1% |
2.0% |
2.9% |
| Thailand |
SET |
1753.7 |
1741.2 |
1719.8 |
-1.2% |
-3.0% |
-1.9% |
|
|
|
|
|
|
|
|
| Europe |
|
|
|
|
|
|
|
| UK |
FTSE 100 |
7687.8 |
7730.3 |
7701.8 |
-0.4% |
2.2% |
0.2% |
| France |
CAC |
5312.6 |
5542.6 |
5465.5 |
-1.4% |
-2.2% |
2.9% |
| Germany |
XETRA DAX |
12917.6 |
12938.0 |
12724.3 |
-1.7% |
-0.1% |
-1.5% |
| Italy |
FTSE MIB |
21853.3 |
22398.2 |
22109.6 |
-1.3% |
-9.2% |
1.2% |
| Spain |
IBEX 35 |
10043.9 |
9826.5 |
9632.4 |
-2.0% |
-5.2% |
-4.1% |
| Sweden |
OMX Stockholm 30 |
1576.9 |
1587.0 |
1569.5 |
-1.1% |
-1.3% |
-0.5% |
| Switzerland |
SMI |
9381.9 |
8759.1 |
8618.5 |
-1.6% |
-4.8% |
-8.1% |
|
|
|
|
|
|
|
|
| North America |
|
|
|
|
|
|
|
| United States |
Dow |
24719.2 |
24753.09 |
24635.2 |
-0.5% |
-1.0% |
-0.3% |
|
NASDAQ |
6903.4 |
7433.9 |
7554.3 |
1.6% |
-0.3% |
9.4% |
|
S&P 500 |
2673.6 |
2721.3 |
2734.6 |
0.5% |
-0.7% |
2.3% |
| Canada |
S&P/TSX Comp. |
16209.1 |
16075.7 |
16043.5 |
-0.2% |
0.1% |
-1.0% |
| Mexico |
Bolsa |
49354.4 |
45092.0 |
45013.1 |
-0.2% |
-0.1% |
-8.8% |
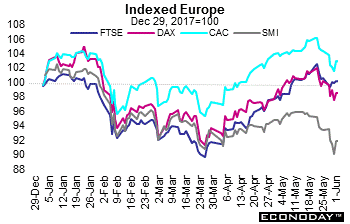 Equities had a rough week. They ended down for the week and all but the FTSE were lower for the month of May thanks to political woes in Italy and Spain. On the week, the FTSE was down 0.4 percent, the CAC declined 1.4 percent, the DAX retreated 1.7 percent and the SMI was 1.6 percent lower. Italy’s FTSE MIB retreated 1.3 percent, after regaining much of the week’s steep losses that were driven by the country’s fractious politics. The IBEX was down 2.0 percent on the week. In May, the FTSE was up 2.2 percent while the CAC lost 2.2 percent, the DAX slipped 0.1 percent and the SMI tumbled 4.8 percent. The MIB dropped 9.2 percent in May while the IBEX lost 5.2 percent. Equities had a rough week. They ended down for the week and all but the FTSE were lower for the month of May thanks to political woes in Italy and Spain. On the week, the FTSE was down 0.4 percent, the CAC declined 1.4 percent, the DAX retreated 1.7 percent and the SMI was 1.6 percent lower. Italy’s FTSE MIB retreated 1.3 percent, after regaining much of the week’s steep losses that were driven by the country’s fractious politics. The IBEX was down 2.0 percent on the week. In May, the FTSE was up 2.2 percent while the CAC lost 2.2 percent, the DAX slipped 0.1 percent and the SMI tumbled 4.8 percent. The MIB dropped 9.2 percent in May while the IBEX lost 5.2 percent.
On Friday, investor sentiment received a boost. Italy's anti-establishment Five Star Movement and the far-right League reached a deal to form a populist government, helping to avert the prospect of a snap election. The new government, however, still faces a confidence vote in parliament. And in Spain, the Prime Minister Mariano Rajoy was ousted by a no-confidence vote. He will be replaced by Socialist leader Pedro Sanchez. The political uncertainty in Europe has rocked global markets on worries that a rise of anti-establishment parties to power could spark a crisis for the euro.
The Trump administration’s plans to re-impose steel and aluminum tariffs on Canada, Mexico and the European Union also weighed on shares. The European bloc has threatened to impose $3.5 billion of its own levies on U.S. agriculture, steel and industrial products and in turn, Trump threatened to hit European cars with a U.S. import tax.
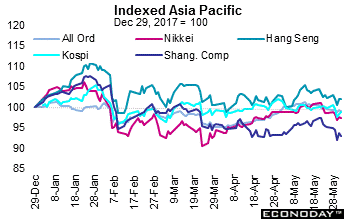 Most Asian equity indexes retreated last week thanks to the geopolitical uncertainties surrounding the governments of Spain and Italy as well as looming threats of a trade war. The uncertainty surrounding the North Korean and United States summit also kept investors on the sidelines. The usual uncertainty regarding the U.S. employment report which would be released after markets here closed added to the mix. Only the Sensex (up 0.9 percent), Jakarta Composite and Taiex (both up 0.1 percent) advanced on the week. Declines ranged from the PSEi (down 0.2 percent) to the STI (down 2.4 percent). The Nikkei retreated 1.2 percent, the Shanghai Composite declined 2.1 percent and the Hang Seng lost 0.3 percent. For the month of May, most indexes followed here declined. Only the All Ordinaries (up 0.9 percent), Shanghai Composite (up 0.4 percent), Sensex (up 0.5 percent) and the Taiex (up 2.0 percent) advanced. Most Asian equity indexes retreated last week thanks to the geopolitical uncertainties surrounding the governments of Spain and Italy as well as looming threats of a trade war. The uncertainty surrounding the North Korean and United States summit also kept investors on the sidelines. The usual uncertainty regarding the U.S. employment report which would be released after markets here closed added to the mix. Only the Sensex (up 0.9 percent), Jakarta Composite and Taiex (both up 0.1 percent) advanced on the week. Declines ranged from the PSEi (down 0.2 percent) to the STI (down 2.4 percent). The Nikkei retreated 1.2 percent, the Shanghai Composite declined 2.1 percent and the Hang Seng lost 0.3 percent. For the month of May, most indexes followed here declined. Only the All Ordinaries (up 0.9 percent), Shanghai Composite (up 0.4 percent), Sensex (up 0.5 percent) and the Taiex (up 2.0 percent) advanced.
The International Monetary Fund kept its forecast for China’s 2018 economic growth unchanged at 6.6 percent but warned that overly rapid credit growth and trade frictions could pose risks to growth. China’s economy grew 6.8 percent on the year in the first quarter of 2018, slightly faster than expected, buoyed by strong consumer demand and surprisingly robust property investment. Earlier in January, the IMF raised its forecast for China’s economic growth this year to 6.6 percent from 6.5 percent. In March, Beijing set a full-year growth target of around 6.5 percent. Expectations are for growth to slow to 6.5 percent this year from 6.9 percent in 2017, citing rising borrowing costs, tougher limits on industrial pollution and a crackdown on local government spending.
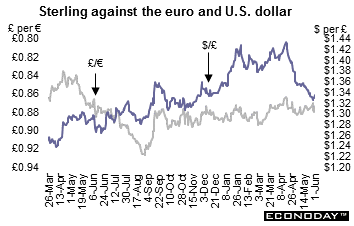 The U.S. dollar was down against the pound sterling, Swiss franc and the Canadian and Australian dollars. It edged higher against both the yen and euro. The U.S. currency lost ground after the political crises in Europe appeared to be resolved. And the pound sterling strengthened against the dollar and the euro Friday as data showed UK manufacturing growth picked up speed in May while Italy’s political crisis dominated investors’ attention. Earlier in the week, sterling was pummeled by a combination of weak UK economic data along with non-UK factors including new U.S. trade tariffs and possible snap elections in Italy. On Friday, however, it was headed for its biggest daily gain in eight weeks. The pound had been one of the best performing currencies in 2018 but it had given up all its gains for the year following a broad rally in the dollar and signs Britain’s economy is slowing. Thanks to recent weakness in the British economy, prospects for a Bank of England interest rate increase have shifted. The U.S. dollar was down against the pound sterling, Swiss franc and the Canadian and Australian dollars. It edged higher against both the yen and euro. The U.S. currency lost ground after the political crises in Europe appeared to be resolved. And the pound sterling strengthened against the dollar and the euro Friday as data showed UK manufacturing growth picked up speed in May while Italy’s political crisis dominated investors’ attention. Earlier in the week, sterling was pummeled by a combination of weak UK economic data along with non-UK factors including new U.S. trade tariffs and possible snap elections in Italy. On Friday, however, it was headed for its biggest daily gain in eight weeks. The pound had been one of the best performing currencies in 2018 but it had given up all its gains for the year following a broad rally in the dollar and signs Britain’s economy is slowing. Thanks to recent weakness in the British economy, prospects for a Bank of England interest rate increase have shifted.
|
|
2017 |
2018 |
% Change |
|
|
Dec 29 |
May 25 |
June 1 |
Week |
2018 |
| U.S. $ per currency |
|
|
|
|
|
|
| Australia |
A$ |
0.779 |
0.755 |
0.757 |
0.3% |
-2.9% |
| New Zealand |
NZ$ |
0.709 |
0.691 |
0.699 |
1.1% |
-1.4% |
| Canada |
C$ |
0.796 |
0.771 |
0.771 |
0.1% |
-3.0% |
| Eurozone |
euro (€) |
1.194 |
1.166 |
1.166 |
-0.1% |
-2.4% |
| UK |
pound sterling (£) |
1.344 |
1.331 |
1.335 |
0.2% |
-0.7% |
|
|
|
|
|
|
|
| Currency per U.S. $ |
|
|
|
|
|
|
| China |
yuan |
6.534 |
6.392 |
6.420 |
-0.4% |
1.8% |
| Hong Kong |
HK$* |
7.816 |
7.845 |
7.846 |
0.0% |
-0.4% |
| India |
rupee |
64.081 |
67.770 |
67.063 |
1.1% |
-4.4% |
| Japan |
yen |
112.850 |
109.460 |
109.570 |
-0.1% |
3.0% |
| Malaysia |
ringgit |
4.067 |
3.981 |
3.979 |
0.1% |
2.2% |
| Singapore |
Singapore $ |
1.338 |
1.342 |
1.339 |
0.3% |
-0.1% |
| South Korea |
won |
1070.630 |
1077.910 |
1074.950 |
0.3% |
-0.4% |
| Taiwan |
Taiwan $ |
29.775 |
29.950 |
29.847 |
0.3% |
-0.2% |
| Thailand |
baht |
32.696 |
31.928 |
32.036 |
-0.3% |
2.1% |
| Switzerland |
Swiss franc |
0.979 |
0.9910 |
0.988 |
0.3% |
-1.0% |
| *Pegged to U.S. dollar |
|
|
|
|
|
|
| Source: Bloomberg |
|
|
|
|
|
|
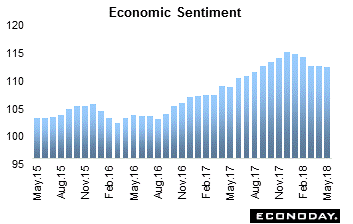 May EU Commission's economic sentiment (ESI) was little changed in May. At 112.5, the ESI was just 0.2 points short of its unrevised April reading. This was its fifth decline in as many months and the weakest reading since August 2017. The lack of any real volatility in the headline measure reflected small declines in morale in industry (6.8 after 7.3), households (0.2 after 0.3) and services (14.3 after 14.7) that together more than offset improvement in retail (0.7 after minus 0.7) and construction (7.0 after 4.6). All sub-indices were well above their respective long-run averages. Among the larger four member states, the national ESI fell in France (108.4 after 110.2), Italy (108.4 after 109.4) and Spain (109.4 after 110.6) but edged marginally firmer in Germany (112.7 after 112.6). Accordingly, the regional index would have been weaker but for the outperformance of the smaller countries. Inflation signals were mixed. May EU Commission's economic sentiment (ESI) was little changed in May. At 112.5, the ESI was just 0.2 points short of its unrevised April reading. This was its fifth decline in as many months and the weakest reading since August 2017. The lack of any real volatility in the headline measure reflected small declines in morale in industry (6.8 after 7.3), households (0.2 after 0.3) and services (14.3 after 14.7) that together more than offset improvement in retail (0.7 after minus 0.7) and construction (7.0 after 4.6). All sub-indices were well above their respective long-run averages. Among the larger four member states, the national ESI fell in France (108.4 after 110.2), Italy (108.4 after 109.4) and Spain (109.4 after 110.6) but edged marginally firmer in Germany (112.7 after 112.6). Accordingly, the regional index would have been weaker but for the outperformance of the smaller countries. Inflation signals were mixed.
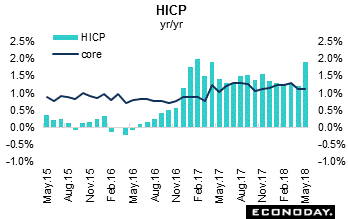 May flash harmonized index of consumer prices was up 1.9 percent from a year ago and was 0.7 percentage points above its final April reading and equaled its highest rate since February 2017. It also moved back to its near-2 percent medium-term target. The core rates accelerated significantly too. The narrowest measure, which excludes energy, food, alcohol and tobacco, saw its yearly gain jump 0.4 percentage points to 1.1 percent. This just more than reversed April's drop and matched the strongest reading since last August. Omitting just energy and unprocessed food, the rate was up a smaller 0.2 percentage points at 1.3 percent. Energy (6.1 percent after 2.6 percent) did much to lift the headline reading and food, alcohol and tobacco (2.6 percent after 2.4 percent) also made a positive contribution. Services (1.6 percent after 1.0 percent) more than made up for April's decline but non-energy industrial goods (0.2 percent after 0.3 percent) moved the other way. May flash harmonized index of consumer prices was up 1.9 percent from a year ago and was 0.7 percentage points above its final April reading and equaled its highest rate since February 2017. It also moved back to its near-2 percent medium-term target. The core rates accelerated significantly too. The narrowest measure, which excludes energy, food, alcohol and tobacco, saw its yearly gain jump 0.4 percentage points to 1.1 percent. This just more than reversed April's drop and matched the strongest reading since last August. Omitting just energy and unprocessed food, the rate was up a smaller 0.2 percentage points at 1.3 percent. Energy (6.1 percent after 2.6 percent) did much to lift the headline reading and food, alcohol and tobacco (2.6 percent after 2.4 percent) also made a positive contribution. Services (1.6 percent after 1.0 percent) more than made up for April's decline but non-energy industrial goods (0.2 percent after 0.3 percent) moved the other way.
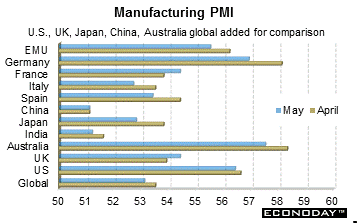 May manufacturing PMI reading was 55.5 — a 15-month low. The headline decline reflected smaller gains in output, new orders and employment although all held onto respectable rates of growth. Backlogs also rose again but, similarly, at a reduced pace compared with April. Against this backdrop, business optimism regarding the year ahead declined to its weakest mark since September 2016. Pressure on capacity was demonstrated in widespread delays at suppliers and input cost inflation was strong and accelerated for the first time since January. However, factory gate inflation eased to a 5-month low while remaining well above its historic norm. Regionally, the best performer was the Netherlands (60.3) ahead of Austria (57.3) and Germany (56.9). Ireland (55.4) was not too far behind but France (54.4), Greece (54.2), Spain (53.4) and Italy (52.7) all lagged. Moreover, the majority of these countries recorded multi-month lows. For comparison, countries outside the Eurozone were added to the graph including Japan, China, Australia, India and the U.S. The overall global manufacturing PMI reading slipped to 53.1, down from 53.5 in April. May manufacturing PMI reading was 55.5 — a 15-month low. The headline decline reflected smaller gains in output, new orders and employment although all held onto respectable rates of growth. Backlogs also rose again but, similarly, at a reduced pace compared with April. Against this backdrop, business optimism regarding the year ahead declined to its weakest mark since September 2016. Pressure on capacity was demonstrated in widespread delays at suppliers and input cost inflation was strong and accelerated for the first time since January. However, factory gate inflation eased to a 5-month low while remaining well above its historic norm. Regionally, the best performer was the Netherlands (60.3) ahead of Austria (57.3) and Germany (56.9). Ireland (55.4) was not too far behind but France (54.4), Greece (54.2), Spain (53.4) and Italy (52.7) all lagged. Moreover, the majority of these countries recorded multi-month lows. For comparison, countries outside the Eurozone were added to the graph including Japan, China, Australia, India and the U.S. The overall global manufacturing PMI reading slipped to 53.1, down from 53.5 in April.
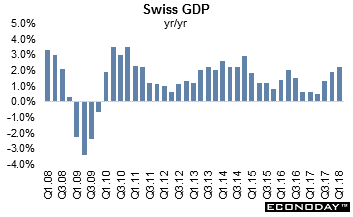 First quarter real gross domestic product expanded 0.6 percent on the quarter. This matched the unrevised gain at the end of 2017 and lifted annual growth from 1.9 percent to 2.2 percent, its fastest reading since the fourth quarter of 2014. The quarterly advance was supported by a 0.4 percent spurt in household consumption, double its fourth quarter rate and back in line with its long-run average. Investment in equipment and software (3.6 percent after minus 1.3 percent) also made a significant positive contribution although construction (minus 0.4 percent after 1.0 percent) moved in the opposite direction. Elsewhere, government consumption dipped 0.3 percent following a 0.5 percent increase last time. Net foreign trade had a small negative impact. First quarter real gross domestic product expanded 0.6 percent on the quarter. This matched the unrevised gain at the end of 2017 and lifted annual growth from 1.9 percent to 2.2 percent, its fastest reading since the fourth quarter of 2014. The quarterly advance was supported by a 0.4 percent spurt in household consumption, double its fourth quarter rate and back in line with its long-run average. Investment in equipment and software (3.6 percent after minus 1.3 percent) also made a significant positive contribution although construction (minus 0.4 percent after 1.0 percent) moved in the opposite direction. Elsewhere, government consumption dipped 0.3 percent following a 0.5 percent increase last time. Net foreign trade had a small negative impact.
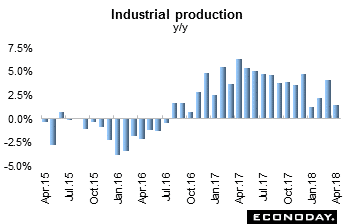 April industrial production advanced 0.3 percent on the month (seasonally adjusted), down from 2.2 percent in March. The monthly gain reflected increases in the output of transport equipment, general-purpose, production and business oriented machinery and fabricated metals. The gains were offset by declines in electronic parts and devices, electrical machinery and chemicals. On the year, output increased 1.5 percent, down from 4.1 percent in March. April industrial production advanced 0.3 percent on the month (seasonally adjusted), down from 2.2 percent in March. The monthly gain reflected increases in the output of transport equipment, general-purpose, production and business oriented machinery and fabricated metals. The gains were offset by declines in electronic parts and devices, electrical machinery and chemicals. On the year, output increased 1.5 percent, down from 4.1 percent in March.
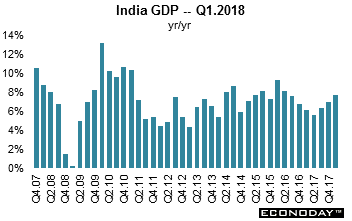 First quarter gross domestic product increased 7.7 percent on the year after rising 7.0 percent in the three months to December. This is the third consecutive increase in year-on-year growth and the strongest since mid-2016. The annual increase was relatively broad-based, with most sectors of the economy recording stronger growth in gross value added, including agriculture, mining, manufacturing, utilities and construction. Growth also picked up in the public sector but weakened in other parts of the services sector. First quarter gross domestic product increased 7.7 percent on the year after rising 7.0 percent in the three months to December. This is the third consecutive increase in year-on-year growth and the strongest since mid-2016. The annual increase was relatively broad-based, with most sectors of the economy recording stronger growth in gross value added, including agriculture, mining, manufacturing, utilities and construction. Growth also picked up in the public sector but weakened in other parts of the services sector.
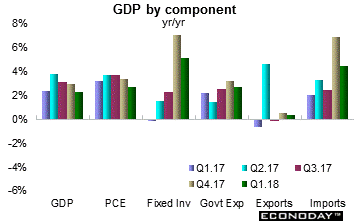 First quarter real gross domestic product (GDP) grew 0.3 percent following an increase of 0.4 percent in each of the previous two quarters. On an annualized basis, GDP was up below expected increase of 2.0 percent at 1.3 percent. Growth was moderated by a deceleration in household spending, lower exports of non-energy products and a decline in housing investment. Household spending grew 0.3 percent, the slowest pace since the first quarter of 2015. Growth was driven by increased outlays on services but household spending on goods was unchanged, following 11 consecutive quarterly increases. Investment in housing fell 1.9 percent in the first quarter, the largest decline since the first quarter of 2009, due to a drop in ownership transfer costs. Lower resale activity coincided with new mortgage stress measures introduced nationwide in January. Business outlays on new construction slowed to 1.2 percent growth, while renovations increased 1.4 percent. Business investment in machinery and equipment and intellectual property products increased at a faster pace than in the fourth quarter of 2017. First quarter real gross domestic product (GDP) grew 0.3 percent following an increase of 0.4 percent in each of the previous two quarters. On an annualized basis, GDP was up below expected increase of 2.0 percent at 1.3 percent. Growth was moderated by a deceleration in household spending, lower exports of non-energy products and a decline in housing investment. Household spending grew 0.3 percent, the slowest pace since the first quarter of 2015. Growth was driven by increased outlays on services but household spending on goods was unchanged, following 11 consecutive quarterly increases. Investment in housing fell 1.9 percent in the first quarter, the largest decline since the first quarter of 2009, due to a drop in ownership transfer costs. Lower resale activity coincided with new mortgage stress measures introduced nationwide in January. Business outlays on new construction slowed to 1.2 percent growth, while renovations increased 1.4 percent. Business investment in machinery and equipment and intellectual property products increased at a faster pace than in the fourth quarter of 2017.
Most of the plethora of economic data that were released during the week was positive in the U.S., Japan, China and India. However, in Europe, it was mixed. Political woes diverted attention from the slew of economic data. Equities tumbled during the week as all attention was riveted on the political machinations in Italy and Spain.
Next week, the Group of Seven (Canada, France, Germany, Italy, Japan, the United Kingdom, and the United States) will meet on June 8 and 9 at the Fairmont Le Manoir Richelieu, in La Malbaie, in the Charlevoix region of Quebec, Canada. The Reserve Banks of Australia and India announce their respective monetary policies. Australia releases its first quarter growth estimate while the Eurozone and Japan offer revisions to previous estimates. Germany posts April manufacturing orders and industrial production. China begins to release its May data for consumer and producer prices and merchandise trade.
| Central Bank activities |
|
| June 5 |
Australia |
Reserve Bank of Australia Monetary Policy Announcement |
| June 6 |
India |
Reserve Bank of India Monetary Policy Announcement |
| |
|
|
| The following indicators will be released this week... |
| Europe |
|
|
| June 5 |
Eurozone |
Manufacturing, Services & Composite PMI (May) |
|
Germany |
Manufacturing, Services & Composite PMI (May) |
|
France |
Manufacturing, Services & Composite PMI (May) |
|
UK |
Services PMI (May) |
| June 7 |
Eurozone |
Gross Domestic Product (Q1.2018 final) |
|
Germany |
Manufacturing Orders (April) |
|
France |
Merchandise Trade (April) |
| June 7 |
Germany |
Industrial Production (April) |
|
|
Merchandise Trade (April) |
|
France |
Industrial Production (April) |
| |
|
|
| Asia Pacific |
|
|
| June 4 |
Australia |
Retail Sales (April) |
| June 5 |
Japan |
Services PMI (May) |
| June 6 |
Australia |
Gross Domestic Product (Q1.2018) |
| June 7 |
Australia |
Merchandise Trade (April) |
| June 8 |
Japan |
Gross Domestic Product (Q1.2018 second estimate) |
|
China |
Merchandise Trade (May) |
|
|
Consumer Price Index (May) |
|
|
Producer Price Index (May) |
| |
|
|
| Americas |
|
|
| June 4 |
United States |
Factory Orders (April) |
| June 5 |
United States |
Services PMI (May) |
|
|
ISM Manufacturing Survey (May) |
|
|
JOLTS (April) |
| June 6 |
Canada |
International Trade (April) |
|
United States |
International Trade (April) |
| June 7 |
United States |
Initial Unemployment Claims (week ending prior Saturday) |
|
|
Consumer Credit (April) |
| June 8 |
Canada |
Labour Force Survey (May) |
|
|
Housing Starts (May) |
Anne D Picker is the author of International Economic Indicators and Central Banks.
|
