
 Does August's weak employment report tip the balance for the Fed'
By R. Mark Rogers, Senior Economist, Econoday
Does August's weak employment report tip the balance for the Fed'
By R. Mark Rogers, Senior Economist, Econoday
September 7, 2007

This past week came out with generally positive economic news outside of the housing sector until Friday’s employment situation report for August showed the first decline in payroll jobs in four years. Many point to the report as the clincher that the Fed will ease at its September 18 FOMC meeting. But the latest jobs report has put the Fed in an unhappy position – the Fed doesn't appear to want to ease immediately but needs to address the issue of August’s payroll dip and the view by many that the Fed is behind the curve.
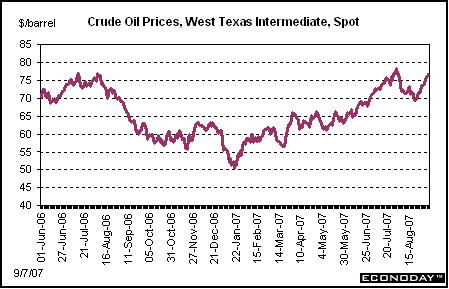
Crude oil prices continued to climb despite signs of a slowing economy. Prices were bumped up early in the week due to commentary renewing predictions for a strong end to the Atlantic hurricane season. Also, prices were lifted by concerns of low inventories in the then upcoming petroleum inventory report, and indeed crude inventories did fall a sharper-than-expected 3.9 million barrels. Prices initially slipped on Friday’s weak employment report but ended both the day and week up.
The spot price for West Texas Intermediate firmed another $2.40 per barrel for the week to close at $76.70 per barrel. Friday’s close was only $1.51 per barrel lower than the record high for spot prices of $78.21 per barrel set this past July 31.
Equities were volatile this past week but ended down sharply on the employment report. The week started on a positive note as a decline in construction outlays and softening in the ISM manufacturing index supported the view that the Fed would be cutting rates on September 18. The markets also got a lift from the Fed and other financial regulators as they announced plans to help lenders mitigate losses related to subprime lending problems. The Nasdaq’s gain was notably pronounced, led by Apple and Yahoo! Stocks headed in the other direction on Wednesday due to a very weak ADP employment report and a sharp decline in pending homes sales. Also, a moderately positive Beige Book raised fears that the Fed would not be cutting rates later this month. On Thursday, better-than-expected chain store sales boosted equities. Markets were mixed for the week through Thursday but Friday’s news of a 4,000 drop in August payroll jobs sent stocks down sharply, hitting small caps and techs the hardest for the day. For the week, small caps bore the brunt of the bad economic news. Although, the jobs report increased the market’s confidence that the Fed will ease on September 18, the market view was that the Fed is behind the curve and that the Fed may be unable to prevent further economic weakening in the near term.
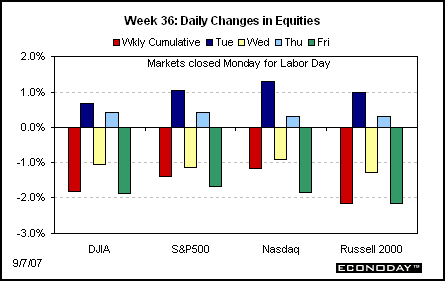
Last week, major indexes were down sharply. Major indexes were down as follows: the Dow, down 1.8 percent; the S&P 500, down 1.4 percent; the Nasdaq, down 1.2 percent; and the Russell 2000, down 2.2 percent.
Year-to-date, the Dow is up 5.2 percent; the S&P 500, up 2.5 percent; the Nasdaq, up 6.2 percent; and the Russell 2000 is down 1.5 percent.
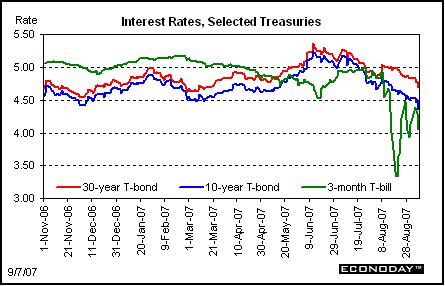
Interest rates fell further last week. Except for the 3-month T-bill, rates rose only incrementally on Tuesday as gains in equities led investors to move out of Treasuries and into stocks, more than offsetting a weaker-than-expected ISM manufacturing report. However, the 3-month T-bill jumped 27 basis points as earlier safe haven moves unwound. Rates fell on Wednesday on very weak reports on pending home sales and ADP employment. Rates declined despite a Fed Beige Book that reported moderate strength outside of housing. On Thursday, Fed Speak sent rates back up with six Fed officials stressing that incoming economic data had not yet solidified the case for a rate cut. A sharp decline in initial jobless claims also boosted rates. But on Friday, there were double-digit basis point declines across the yield curve due to a 4,000 decline in payroll jobs. The near end fell the most for the day with the 3-month T-bill down 24 basis points.
Treasury yields were down as follows in the week: 3-month T-bill, down 7 basis points; 2-year T-note, down 23 basis points; 3-year, down 23 basis points; the 5-year, down 21 basis points; the 10-year bond, down 16 basis points; and the 30-year bond, down 14 basis points.
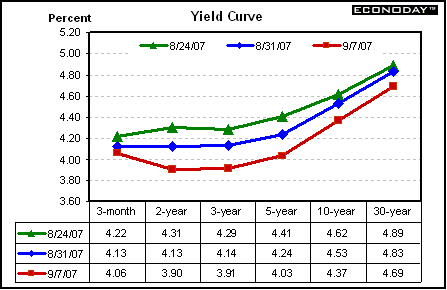
Though the 3-month T-bill continues to be buffeted by in and out flight to quality, the trend has been downward on increased belief that the Fed is about to ease.
Weekly percent change column reflects percent changes for all components except interest rates. Interest rate changes are reflected in simple differences.
Last week was mixed in terms of economic data but the soft August employment report captured the spotlight, leading many to forget some key strong points earlier in the week.
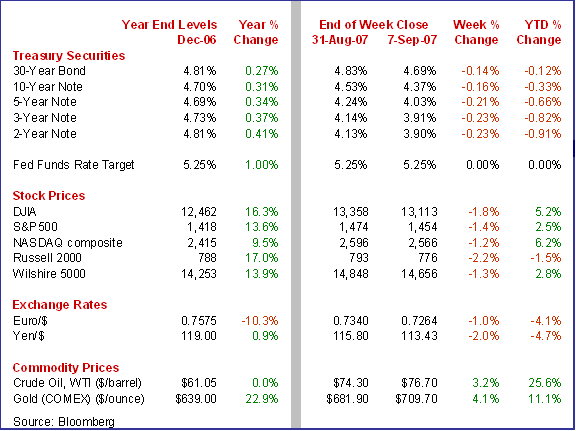
Employment in August came in quite weak, posting a decline for the month and with downward revisions to the prior two months. Household data remained tight. Nonfarm payroll employment fell by 4,000, sharply below the consensus forecast for a 100,000 advance. Payrolls for July were revised down by 24,000 and June by 57,000 for a net downward revision of 81,000. August’s decline was the first since a 42,000 drop in August 2003.
Weakness in the report was not extensively broad-based. Within the payroll survey, weakness was primarily in the goods-producing industries. Manufacturing fell a sharp 46,000 while construction declined 22,000. Natural resources & mining edged up by 4,000 in August.
Overall service-providing industries advanced 60,000 in August, after increasing 78,000 in July. Service-providing gains were led by education & health services, transportation & utilities, and leisure & hospitality. Government jobs fell 28,000, reflecting a drop in local education.
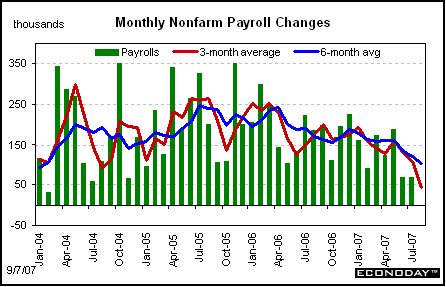
On the inflation front, average hourly earnings increased 0.3 percent in August – the same as in July. Year-on-year, wages are still moderately high at 3.9 percent.
Turning to the household survey, the civilian unemployment rate was unchanged at 4.6 percent in August and came in below the market forecast of 4.7 percent. Household employment, the number of unemployed, and labor force all declined in August. The household survey numbers are much more volatile than the payroll data because of a much smaller sample size.
There are some caveats for the August employment report. First, significant weakness came from a 32,000 drop in local education jobs. This category also fell 20,000 in June and 50,000 in July. This series is known for having seasonal adjustment difficulties – especially over summer months. We could see a sharp upswing in this component in September. While manufacturing fell 46,000 in August, this is not consistent with moderate growth suggested by various manufacturing surveys nor with the huge spike in the latest durable goods orders.
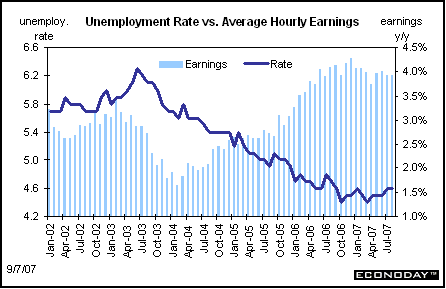
Overall, today’s report adds ammunition to those arguing that the Fed will ease at its September 18 FOMC meeting. The Fed has wanted to see a slowing in the economy and the August payroll data and revised numbers for June and July add to the argument that the economy is slowing. However, there are still data to the contrary – such as more recent initial unemployment claims data, moderately strong chain stores sales, and even auto sales. The Fed clearly puts the payroll numbers in the column for easing but will still be watching upcoming claims numbers before the September 18 FOMC meeting.
In contrast to other periods of weakness, initial claims have not risen in advance of the decline in August payrolls. Firms may not be hiring but they also are being slow to lay off. This suggests that firms are more optimistic about economic strength than pessimistic. The Fed will be mulling over this discrepancy between weak payrolls and healthy claims.
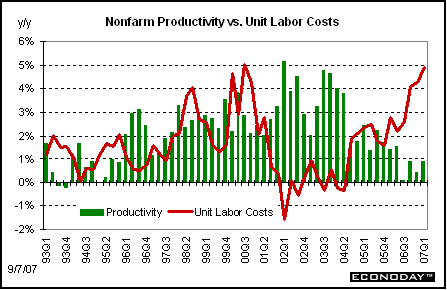
Second quarter productivity was revised up to an annualized 2.6 percent from the initial estimate of 1.8 percent. The upward revision in productivity reflected the upward revision to second quarter GDP to an annualized 4.0 percent from the initial estimate of 3.4 percent. Second quarter unit labor costs were revised down to 1.4 percent from the initial estimate of 2.1 percent annualized. While the latest numbers are favorable, the trend has not yet improved. Year-on-year, productivity is up only 0.9 percent while unit labor costs are at a high 4.9 percent.
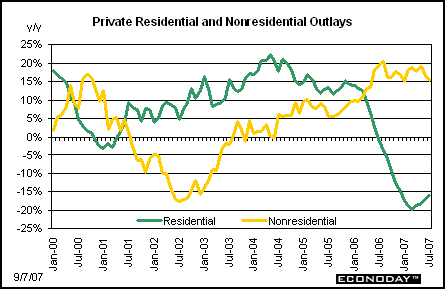
Construction spending declined 0.4 percent in July, following a revised 0.1 percent rise in June. By sectors, private residential construction fell 1.4 percent in July, following a 0.6 percent decline in June. Public outlays rose 0.7 percent in the latest month, following a 1.0 percent boost in June. Private nonresidential construction advanced 0.4 percent in July, equaling the prior month's gain. Nonresidential construction and public construction continue to be sources of strength for the economy.
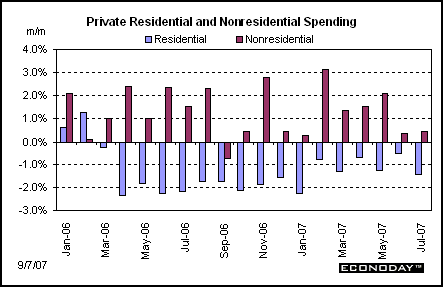
While the media have focused on weakness in housing, strength in nonresidential construction has not gotten as much play. Year-on-year, residential outlays are down 16.1 percent but nonresidential is up 15.4 percent.
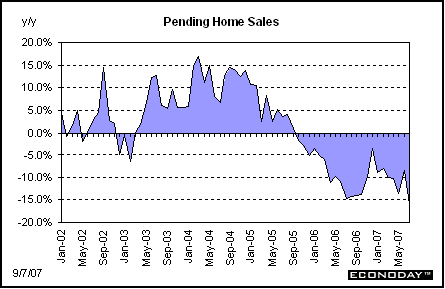
Pending home sales fell 12.2 percent to an index level of 89.9 in July, down 16.1 percent on the year. The report said some sales contracts are not closing because mortgage commitments have fallen through. But despite the weak numbers in this lagging data series, there already are signs that housing is stabilizing. Both existing home and new home sales proved better than expected in July.
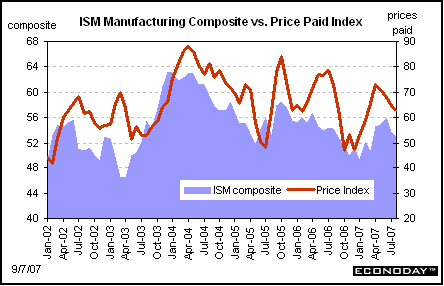
Both the ISM manufacturing and non-manufacturing surveys showed moderately healthy growth in August. The ISM manufacturing index dipped from 53.8 in July to 52.9 in August. The index hit a 14-month peak in June at 56.0. Although the August number represents slower growth, it is still moderately positive. A slowdown in inventory accumulation was a key factor in the index’s overall softness with the inventory index falling to 45.4 from 48.5. While this is a negative in the composite compilation, the slowing in inventory growth could mean that producers have to pick up the pace in coming months to rebuild inventories.
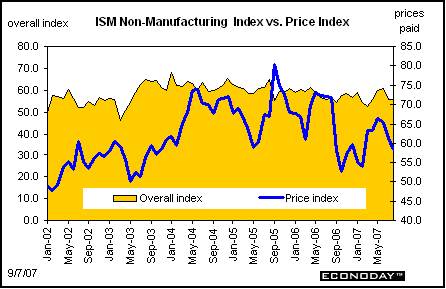
The ISM non-manufacturing index was unchanged in August, at a very solid 55.8 that points to steady economic growth through the second half of the year. New orders were especially strong with the index rising to 57.0 vs. 52.8 in July. Offsetting this slightly was a dip back in backlog orders to 50.0 vs. 53.0.
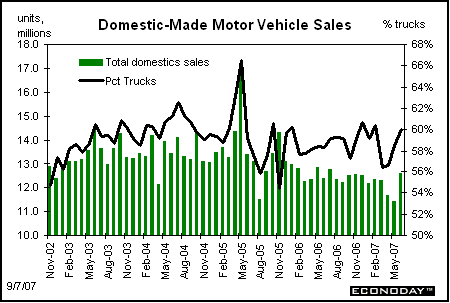
Volatility in the financial markets is appearing to have limited economic effect, at least on light vehicle sales which proved surprisingly strong in August, at a 12.6 million annual rate for domestic-made vehicles vs. 11.4 million in July. August’s sales pace is a good indication that the consumer is still willing to spend despite volatility in the stock market and August’s credit crunch.
Redbook's same-store sales tally firmed in the September 1 week, up 2.7 percent compared with the year-ago week vs. a 2.4 percent rate in the prior week. The report attributed the gain to last minute back-to-school shopping and markdowns. Importantly, the data are very current and suggest that the consumer is not completely retrenching due to subprime problems and potentially alarming news on the stock market.
The Beige Book prepared by regional Fed banks for the upcoming September 18 FOMC meeting indicates that economic activity continues to expand outside of housing. “Outside of real estate, reports that the turmoil in financial markets had affected economic activity during the survey period were limited.” The consumer sector is holding up reasonably well, with retail sales “generally positive,” but several districts described vehicle and furniture sales as slow. Manufacturing is seen as continuing to expand outside of housing-related and auto industries. Employment gains continue and wage increases are “moderate or steady.” Even though wage increases are not accelerating, most Fed districts see labor markets as tight.
The Beige Book is more important than usual because Fed officials have stated that official government statistics have reporting lags and data prior to the early August credit crunch may not reflect current conditions. Fed officials have indicated they will place greater reliance on anecdotal information (such as the Beige Book) and more timely high frequency data (such as jobless claims). The Beige Book gives a more optimistic view of the economy than the August employment report. The Beige Book incorporated information collected prior to August 27.
Last week, the Federal Reserve and a number of other regulatory agencies issued a joint news release encouraging federal and state regulated lending institutions to review their options to mitigate losses on residential mortgages. The Fed and others for now appear to be focusing on micro strategies to reduce the impact on the economy of subprime lending problems. While such a strategy does not preclude near-term cuts in the fed funds rate, this announcement certainly indicates the Fed is doing all it can to make sure that all options are taken before making such cuts. The Fed and other regulators are encouraging loss mitigation strategies that “may include, for example, loan modifications, deferral of payments, or a reduction of principal.”
Outside of housing, the economy is still moderately healthy. While the August jobs report was negative overall, there was at least one possible factor that artificially pulled down the total (seasonal adjustment for public education). Also, the more current jobless claims show a healthy labor market. The Fed has indicated it will weigh more heavily the more recent high frequency data as well as anecdotal information. While the traditional economic data have tipped more toward a Fed cut on September 18, the more recent high frequency numbers and anecdotal information from the Beige Book suggest that it is not certain a rate cut will happen at the next FOMC meeting. What are the policy issues facing the Fed' Most importantly, the Fed is concerned about the morale hazard issue and subprime. The Fed doesn't want to encourage reckless conduct by bailing out lenders who have made bad loan decisions. What many do not realize is that in 1998, there was extreme dissention within the Fed against bailing out Long Term Capital Management. Those supporting that move are no longer at the Fed and many opposing still are. What about monetary policy other than the morale hazard issue' The Fed has consistently worried that the economy is too strong to keep core inflation down. Also oil prices are near record highs, food price inflation is up, the dollar is on a downtrend, gold is spiking, and wage gains could still create higher labor costs. The Fed probably would like to hold off a rate cut but now the question is can they justify a delay – the markets think not.
This coming week gives the markets and the Fed a look more critical data before the September 18 FOMC meeting – with a focus likely on weekly chain-store reports, retail sales, initial jobless claims, and industrial production.
Consumer credit surged for a second straight month, up $13.1 billion in June on top of May's $16.0 billion increase. Gains in June were split evenly between revolving credit (largely credit cards) and non-revolving credit (largely vehicle loans).
Consumer credit Consensus Forecast for July 07: +$7.0 billion
Range: +$3.0 billion to +$12.0 billion
The U.S. international trade gap fell back in June to a lower-than-expected $58.1 billion from $59.2 billion in May. The improvement reflects higher exports, a reflection of strong global demand, and slowing imports, a reflection of slowing domestic demand including a decline in imports of consumer goods excluding autos. We are likely to see a continuation of the upward trend in exports, given the strength in overseas economies. But U.S. retailers are still trying to figure out the strength of the consumer sector and there are lags between changes in businesses’ views on demand and when the imports arrive. On a technical note, exports of capital equipment dipped in June and that component is likely to rebound in July.
International trade balance Consensus Forecast for July 07: -$59.5 billion
Range: -$61.5 billion to -$57.7 billion
Initial jobless claims fell back in the week ending September 1, dropping a surprising 19,000 to 318,000 to indicate tightened conditions in the labor market. Even with this past week’s monthly employment report providing somewhat more up-to-date and comprehensive information during some of August’s financial turbulence, the Fed will still be giving the more current claims data greater scrutiny heading into the September 18, FOMC meeting.
Jobless Claims Consensus Forecast for 9/8/07: 325,000
Range: 320,000 to 340,000
The U.S. Treasury monthly budget report showed a deficit of $36.3 billion, compared to $33.2 billion in July 2006. Still, for year-to-date, the budget deficit is sharply below that for last year, $157.3 billion versus $239.6 billion. Looking ahead, the month of August typically shows a moderate deficit. Over the past 10 years, the average deficit for August is $42.8 billion.
Treasury Statement Consensus Forecast for August 07: -$75.0 billion
Range: -$105.0 billion to -$60.0 billion.
Retail sales rebounded moderately in July with strength broad-based. Overall retail sales increased 0.3 percent in July, following a 0.7 percent drop in June. Excluding auto sales, retail sales rebounded 0.4 percent in July, following a 0.2 percent decline in June. Excluding both motor vehicles and gas stations, sales advanced 0.6 percent, following no change the prior month. More recently, unit new motor vehicles sales bumped up in August and we will likely see that show up in the retail sales numbers. Retail sales will be the last major indicator on the consumer sector before the Fed’s September 18 FOMC meeting.
Retail sales Consensus Forecast for August 07: +0.6 percent
Range: +0.1 to +0.9 percent
Retail sales excluding motor vehicles Consensus Forecast for August 07: +0.2 percent
Range: -0.1 to +0.6 percent
Import prices rose a greater-than-expected 1.5 percent in July but were up only 0.2 percent excluding petroleum products. Year-on-year, both rates are up 2.8 percent. A weak dollar and strong overseas demand for goods are keeping upward pressure on U.S. import prices.
Import prices Consensus Forecast for August 07: +0.4 percent
Range: -0.2 to +0.5 percent
The U.S. current account deficit widened slightly to $192.6 billion in the first quarter from $187.9 billion in the fourth quarter.
Current account Consensus Forecast for Q2 07: -$191.0 billion
Range: -$194.9 billion to -$187.0 billion
Industrial production in July was robust with weakness in utilities masking strength in the headline number. Overall industrial production advanced by 0.3 percent in July, following a 0.6 percent jump in June. However, the manufacturing component posted a 0.6 percent gain in July, equaling June's surge. Overall capacity utilization edged up to 81.9 percent from 81.8 percent in June. More recently, data on the manufacturing sector have been mixed. New durables orders surged 5.9 percent in July. Various manufacturing surveys – such as the Chicago purchasing managers and the ISM - indicated that manufacturing growth for August is still positive but moderating. But the production hours index for manufacturing – from the August jobs report – showed a 0.3 percent drop, suggesting sluggish manufacturing.
Industrial production Consensus Forecast for August: +0.3 percent
Range: -0.1 to +0.5 percent
Capacity utilization Consensus Forecast for August 07: 82.0 percent
Range: 81.5 to 82.2 percent
The Reuter’s/University of Michigan’s Consumer sentiment index, apparently affected by credit crunch worries and volatility in the stock market, slipped in August to 83.4 from July's 90.4. A big positive in the data was a tame reading for one-year inflation expectations, at 3.2 percent.

|