|
Simply Economics will be taking next week off
Simply Economics will return on Friday, January 3, 2014
Merry Christmas and Happy Holidays
from all of us at Econoday!
At this past week’s FOMC meeting, the Fed finally announced the beginning of tapering to start in January 2014. On the news, markets showed relief on the ending of the uncertainty of the start of slowing the pace of bond purchases and equities rose sharply for the week.
 Equities rebounded Monday after a four-day decline for the S&P 500. Bargain hunting lifted stocks despite some caution ahead of the Wednesday FOMC decision along with several major corporate deals. A robust industrial production number also helped. Major indexes edged down Tuesday as traders awaited the Wednesday decision by the Fed on whether to begin tapering its bond buying (QE) programs or not. Equities rebounded Monday after a four-day decline for the S&P 500. Bargain hunting lifted stocks despite some caution ahead of the Wednesday FOMC decision along with several major corporate deals. A robust industrial production number also helped. Major indexes edged down Tuesday as traders awaited the Wednesday decision by the Fed on whether to begin tapering its bond buying (QE) programs or not.
 At mid-week, the suspense finally ended as the Fed announced that it would begin to taper its combined bond buying program by a monthly $5 billion reduction in mortgage-backed securities and a $5 billion in Treasuries. Monthly purchases will be $75 billion starting in January 2014—down from $85 billion. Traders were happier about the reduced uncertainty than worried about a modest amount of reduction in Fed stimulus. Importantly, the FOMC statement was seen as very dovish—especially with comments that policy rates will remain low well after the unemployment rate falls below 6.5 percent. At mid-week, the suspense finally ended as the Fed announced that it would begin to taper its combined bond buying program by a monthly $5 billion reduction in mortgage-backed securities and a $5 billion in Treasuries. Monthly purchases will be $75 billion starting in January 2014—down from $85 billion. Traders were happier about the reduced uncertainty than worried about a modest amount of reduction in Fed stimulus. Importantly, the FOMC statement was seen as very dovish—especially with comments that policy rates will remain low well after the unemployment rate falls below 6.5 percent.
Equities mostly slipped Thursday on profit taking after Wednesday’s surge. Also, economic news was disappointing with a rise in jobless claims, a weak Philly Fed manufacturing index, and a drop in existing home sales. But the week ended on a high note with strong gains. The key factor was an unexpectedly strong upward revision to third quarter GDP growth with upward revisions in demand components and not further in inventories.
Equities were up this past week. The Dow was up 3.0 percent; the S&P 500, up 2.4 percent; the Nasdaq, up 2.6 percent; the Russell 2000, up 3.6 percent; and the Wilshire 5000, up 2.5 percent.
For the year-to-date, major indexes are up as follows: the Dow, up 23.8 percent; the S&P 500, up 27.5 percent; the Nasdaq, up 35.9 percent; the Russell 2000, up 35.0 percent; and the Wilshire 5000, up 29.2 percent.
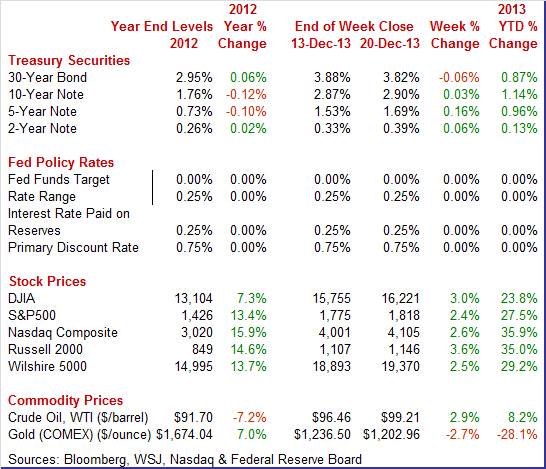
Weekly percent change column reflects percent changes for all components except interest rates. Interest rate changes are reflected in simple differences.
 Treasury yields ended the week mostly up. A key exception was the 30-year bond. Treasury yields ended the week mostly up. A key exception was the 30-year bond.
Rates were marginally higher Monday as traders awaited the Fed’s decision on taper on Wednesday. Yields eased Tuesday after a flat CPI headline number which led many traders to believe that the Fed would not begin to taper at this past week’s FOMC meeting.
But on Wednesday, the Fed announced a $10 billion reduction in the amount of its monthly bond purchases and rates rose on both Wednesday and Thursday. However, on Friday the 10-year and 30-year Treasury yields fell as traders unwound wrong way bets on Fed tapering
For this past week Treasury rates were mostly up as follows: the 2-year note, up 6 basis points; the 5-year note, up 16 basis points; the 7-year note, up 10 basis points; and the 10-year note, up 3 basis points. The 3-month T-bill and 30-year bond were down 1 basis point and 6 basis points, respectively.
 The spot price of West Texas Intermediate rose notably this past week. The spot price of West Texas Intermediate rose notably this past week.
Crude started the week by rising almost a dollar a barrel due to internal politics in Libya which led to three oil ports to remain shut. Libyan rebel leader Ibrahim Al Jedran announced the continued closure since his demands with the Libyan government to share oil revenues with his government in the eastern portion of the country were rejected.
After little change in spot WTI on Tuesday, crude gained a little over a dollar a barrel Wednesday in tandem with equities after the FOMC decision and on belief that the economy is growing stronger. WTI rose marginally on Thursday and Friday.
Net for the week, the spot price for West Texas Intermediate advanced $2.75 per barrel to settle at $99.21.
The big news was the Fed’s decision to begin tapering its quantitative easing programs. Also, the third quarter was significantly stronger than earlier believed. Data for manufacturing and housing were mixed while inflation still appears to be on a low trajectory.
The December 17-18 FOMC meeting ended with the announcement of the beginning of taper but it nonetheless took a dovish tone, also emphasizing the policy rates are to remain exceptionally low for quite some time.
 The Fed announced taper to start in January in measured steps--a $10 billion reduction split between Treasuries and MBSs and future moves still data dependent. The Fed left policy rates unchanged. The reduction in QE purchases is to be modest. Notably, the Fed emphasized that the fed funds rate likely will remain low for quite some time after QE ends-although the context was in terms of continuing beyond when the unemployment rate falls below 6.5 percent. The overall characterization of the economy is still that economic growth is "moderate" although the labor market is described as having shown improvement. The Fed continued to call unemployment as "elevated." Inflation was noted to be running below it long-term goal of (of 2 percent). Overall, even with the announcement of the beginning of taper, the statement had a dovish tone. The Fed announced taper to start in January in measured steps--a $10 billion reduction split between Treasuries and MBSs and future moves still data dependent. The Fed left policy rates unchanged. The reduction in QE purchases is to be modest. Notably, the Fed emphasized that the fed funds rate likely will remain low for quite some time after QE ends-although the context was in terms of continuing beyond when the unemployment rate falls below 6.5 percent. The overall characterization of the economy is still that economic growth is "moderate" although the labor market is described as having shown improvement. The Fed continued to call unemployment as "elevated." Inflation was noted to be running below it long-term goal of (of 2 percent). Overall, even with the announcement of the beginning of taper, the statement had a dovish tone.
The Fed saw improvement in the labor market, consumer spending and business fixed investment. Also, fiscal policy restraint is seen as diminishing.
The Fed expects economic growth to pick up, assuming appropriate monetary policy accommodation. This suggests continued easy monetary policy for some time. Too low inflation adds to that view.
Taper begins in January but at a modest reduction split evenly between Treasuries and mortgage-backed securities.
"In light of the cumulative progress toward maximum employment and the improvement in the outlook for labor market conditions, the Committee decided to modestly reduce the pace of its asset purchases. Beginning in January, the Committee will add to its holdings of agency mortgage-backed securities at a pace of $35 billion per month rather than $40 billion per month, and will add to its holdings of longer-term Treasury securities at a pace of $40 billion per month rather than $45 billion per month."
The Fed continues to reinvest payments on principal on mortgage-backed securities and long-term Treasuries. Even after QE ends, the economy will be supported by very low short-term rates, held down by the fed funds target rate.
"The Committee now anticipates, based on its assessment of these factors, that it likely will be appropriate to maintain the current target range for the federal funds rate well past the time that the unemployment rate declines below 6-1/2 percent, especially if projected inflation continues to run below the Committee's 2 percent longer-run goal."
The vote for the statement was 9 to 1 with Boston Fed's Eric Rosengren dissenting. He believes that, with the unemployment rate still elevated and the inflation rate well below the target, changes in the purchase program are premature until incoming data more clearly indicate that economic growth is likely to be sustained above its potential rate.
The latest Fed decision reflects a modest change in QE starting in January and the path to ending QE remains data dependent. Importantly, short rates will remain low for some time. The overall tone of the statement was still dovish.
Separately but related, the Fed hit a milestone in quantitative easing as seen in the Fed’s balance sheet report that was released the day after the FOMC decision. For the December 18 week. The Fed balance sheet increased $14.1 billion topping the $4 trillion level. Total assets for the December 18 week came in at $4.008 trillion—about $3 trillion higher than when quantitative easing began.
 Real GDP growth unexpectedly was revised up sharply. But this time demand numbers were bumped up and the inventory number was little revised. Real GDP was revised up to 4.1 percent annualized, compared to the 3.6 percent second estimate and 2.5 percent in the second quarter. The upward revision was largely due stronger PCEs growth, a boost in the estimate for intellectual property, slightly higher exports, and slightly lower imports. Real GDP growth unexpectedly was revised up sharply. But this time demand numbers were bumped up and the inventory number was little revised. Real GDP was revised up to 4.1 percent annualized, compared to the 3.6 percent second estimate and 2.5 percent in the second quarter. The upward revision was largely due stronger PCEs growth, a boost in the estimate for intellectual property, slightly higher exports, and slightly lower imports.
 Demand numbers were raised. Final sales of domestic product were revised up to 2.5 percent, compared to the second estimate of 1.9 percent and 2.1 percent in the second quarter. Final sales to domestic purchasers (which exclude net exports) were bumped up to 2.3 percent versus the second estimate of 1.8 percent and 2.1 percent in the second quarter. Demand numbers were raised. Final sales of domestic product were revised up to 2.5 percent, compared to the second estimate of 1.9 percent and 2.1 percent in the second quarter. Final sales to domestic purchasers (which exclude net exports) were bumped up to 2.3 percent versus the second estimate of 1.8 percent and 2.1 percent in the second quarter.
The GDP price index was unrevised at an annualized pace of 2.0 percent, compared second quarter growth of 0.6 percent.
Overall, it is good news that demand growth is somewhat stronger than earlier believed. Still, inventory growth was strong and the question remains as to whether it will weigh down on fourth quarter growth.
 Industrial production for November surged on utilities output but manufacturing was quite healthy for the month. Overall industrial production jumped 1.1 percent, following a 0.1 percent rise in October. Industrial production for November surged on utilities output but manufacturing was quite healthy for the month. Overall industrial production jumped 1.1 percent, following a 0.1 percent rise in October.
The November index level passed its pre-recession peak.
 Turning to major components, manufacturing jumped 0.6 percent, following a rise of 0.5 percent in October. Motor vehicles played a key role in boosting November manufacturing output. Motor vehicle assemblies jumped to an annualized pace of 11.61 million units from 11.10 million in October. Turning to major components, manufacturing jumped 0.6 percent, following a rise of 0.5 percent in October. Motor vehicles played a key role in boosting November manufacturing output. Motor vehicle assemblies jumped to an annualized pace of 11.61 million units from 11.10 million in October.
Nonetheless, output was quite healthy elsewhere. Excluding motor vehicles, manufacturing increased 0.5 percent after gaining 0.6 percent in October.
 The production of durable goods advanced 0.8 percent in November. The output of motor vehicles and parts increased 3.4 percent, following a 1.3 percent dip in October. The output of nondurables rose 0.5 percent in November for its largest increase since December 2012. The production of durable goods advanced 0.8 percent in November. The output of motor vehicles and parts increased 3.4 percent, following a 1.3 percent dip in October. The output of nondurables rose 0.5 percent in November for its largest increase since December 2012.
The output of utilities surged 3.9 percent, following a dip of 0.3 percent in October percent in October. Mining activity made a comeback of 1.7 percent after decreasing 1.5 percent the prior month. Temporary shutdowns of oil and gas rigs in the Gulf of Mexico in anticipation of Tropical Storm Karen contributed to the October decrease.
Capacity utilization for total industry jumped to 79.0 percent from 78.2 percent in October. Analysts anticipated 78.4 percent.
Manufacturing clearly regained momentum over the last two months.
Markit's US manufacturing sample reported solid growth in activity in its flash reading for December at an index of 54.4 which was very little changed from 54.7 in final November and 54.3 at mid-month November. Strength was led by output where monthly growth was at 57.3, again which was in line with the two prior readings. Employment was a special positive, at 53.7 for a 1.4 point gain to show the best rate of growth since March. On the slowing side, however, were new orders, at 54.5 which is still respectable but down from 56.2 in the final November reading.
Regional Fed manufacturing surveys are turning out to be very mixed for December. New York and Kansas City Fed report weakened conditions while Philly Fed manufacturing activity improved.
 New orders continued to slide in the Empire State report pointing to contraction ahead for New York's manufacturing economy. The main index came in barely above zero in the December report, at 0.98 for the third flat reading in a row with the new orders index at minus 3.54 following the prior month's minus 5.53. Unfilled orders extended their long run of contraction and at a very steep minus 24.10. New orders continued to slide in the Empire State report pointing to contraction ahead for New York's manufacturing economy. The main index came in barely above zero in the December report, at 0.98 for the third flat reading in a row with the new orders index at minus 3.54 following the prior month's minus 5.53. Unfilled orders extended their long run of contraction and at a very steep minus 24.10.
Shipments so far this month, however, have expanded, at 7.66 vs November's minus 0.53. But with orders down, shipments are very likely to resume contraction in the January report. Other readings were also weak including a speeding up of delivery times, which indicates that capacity in the supply chain is loose, with inventories showing a major contraction, one that likely points to an intentional draw as manufacturers in the region prepare for weakness ahead.
 Turning to the Philly Fed report, mid-Atlantic manufacturing activity is solid with general conditions at 7.0 in December to show a slightly better monthly rate of growth than November's 6.5 reading. New orders were very solid, at 15.4 on top of 11.8 in November to point to rising activity in general conditions in the months ahead. Turning to the Philly Fed report, mid-Atlantic manufacturing activity is solid with general conditions at 7.0 in December to show a slightly better monthly rate of growth than November's 6.5 reading. New orders were very solid, at 15.4 on top of 11.8 in November to point to rising activity in general conditions in the months ahead.
Shipments were also strong, at 13.3 for a big gain from November's 5.6. But the increase in output did not do much for employment which was flat though in the plus column at 2.2.
 The Kansas City Fed reported that in its District manufacturing activity fell in December, but producers’ expectations for future activity improved modestly. Some contacts cited poor weather, and continued fiscal and regulatory uncertainty as reasons for the December slowdown. Slightly over half of all respondents noted labor shortages, with nearly one third indicating additional wage pressures. Current price indexes posted few changes, but expectations for future prices continued to rise. The Kansas City Fed reported that in its District manufacturing activity fell in December, but producers’ expectations for future activity improved modestly. Some contacts cited poor weather, and continued fiscal and regulatory uncertainty as reasons for the December slowdown. Slightly over half of all respondents noted labor shortages, with nearly one third indicating additional wage pressures. Current price indexes posted few changes, but expectations for future prices continued to rise.
The month-over-month composite index was minus 3 in December, down from 7 in November and 6 in October. The composite index is an average of the production, new orders, employment, supplier delivery time, and raw materials inventory indexes. The production index fell at nearly all types of durable goods plants, while production at nondurable goods plants declined at a slower rate than last month. Most future factory indexes continued to improve somewhat and were at solid levels. The future composite index rose from 12 to 14, and the future production, shipments, and new orders indexes also increased.
 Housing is regaining some strength despite recent slowing in sales. Housing starts surged in November—and this time it was not just the multifamily component. Housing starts in November jumped 22.7 percent after rising 1.8 percent in October. The November starts annualized level of 1.091 million units was up 29.6 percent on a year-ago basis. September starts were 0.873 million and October was 0.889 million. Housing is regaining some strength despite recent slowing in sales. Housing starts surged in November—and this time it was not just the multifamily component. Housing starts in November jumped 22.7 percent after rising 1.8 percent in October. The November starts annualized level of 1.091 million units was up 29.6 percent on a year-ago basis. September starts were 0.873 million and October was 0.889 million.
The gain in starts was led by the multifamily component which increased 26.8 percent after dipping 2.0 percent in October. The single-family component also was strong in November, jumping 20.8 percent after a 3.8 percent increase the month before.
Permits declined but after a strong October. This time strength is in the single-family component. Permits decreased 3.1 percent in November after gaining 6.7 percent the month before. The 1.007 million pace was up 7.9 percent on the year.
 Strength was in the single-family component which improved 2.1 percent after a 1.0 percent rise in October. The multifamily component dropped 10.8 percent after jumping 16.4 percent in October. The multifamily component is up 3.9 percent on a year-ago basis while the single-family component is 10.5 percent. Strength was in the single-family component which improved 2.1 percent after a 1.0 percent rise in October. The multifamily component dropped 10.8 percent after jumping 16.4 percent in October. The multifamily component is up 3.9 percent on a year-ago basis while the single-family component is 10.5 percent.
Housing regained some momentum over the last three months, partly due to low supply of single-family homes. For gains to continue further in the recovery, sales will need to pick up.
 Demand for existing homes was definitely down in November as sales fell a sharp 4.3 percent to a 4.900 million annual rate for a 4th straight month of disappointment. And for the first time in nearly 2-1/2 years, the year-on-year rate was in contraction at minus 1.2 percent. And for a second month in a row, all regions showed monthly declines led once again by the West where November sales fell 8.5 percent. Demand for existing homes was definitely down in November as sales fell a sharp 4.3 percent to a 4.900 million annual rate for a 4th straight month of disappointment. And for the first time in nearly 2-1/2 years, the year-on-year rate was in contraction at minus 1.2 percent. And for a second month in a row, all regions showed monthly declines led once again by the West where November sales fell 8.5 percent.
Lack of homes for sale, especially in the West, was a major reason for the weak sales. Supply on the market fell to 2.090 million in the month from 2.110 million. Because of the weakness in sales, monthly supply on a sales basis did improve but not by much, to 5.1 months from 4.9 months.
Unattractive mortgage rates are yet another reason for the lack of sales punch with all cash buyers making up 32 percent of sales. This segment of the market has been significant for supporting the pace of sales.
 Inflation is hard to find. Headline CPI inflation in November posted a flat reading after dipping 0.1 percent in October. The CPI excluding food and energy firmed to 0.2 percent, following a rise of 0.1 percent the prior month. Inflation is hard to find. Headline CPI inflation in November posted a flat reading after dipping 0.1 percent in October. The CPI excluding food and energy firmed to 0.2 percent, following a rise of 0.1 percent the prior month.
The energy component pulled down on overall inflation as energy slipped 1.0 percent, following a drop of 1.7 percent in October. Gasoline declined 1.6 percent after falling 2.9 percent the month before. Food price inflation was 0.1 percent in November, matching the pace in October.
 Within the core, increases in the indexes for shelter and airline fares accounted for most of the increase, with the indexes for recreation and for used cars and trucks also rising. The indexes for apparel, for household furnishings and operations, and for new vehicles all declined in November. Within the core, increases in the indexes for shelter and airline fares accounted for most of the increase, with the indexes for recreation and for used cars and trucks also rising. The indexes for apparel, for household furnishings and operations, and for new vehicles all declined in November.
Year-on-year, overall CPI inflation posted at 1.2 percent, up from 0.9 percent in October (seasonally adjusted). The core rate came in at 1.7 percent, equaling the pace in October. On an unadjusted year-ago basis, the headline CPI in November was up 1.2 percent and the core was up 1.7 percent.
Overall, inflation is subdued and is allowing the Fed to maintain quantitative easing, although at a reduced pace.
 The economy appears to be gaining some momentum with leading indicators up five months in a row and with four of those notably strong. The index of leading economic indicators surged 0.8 percent in November, following a rise of 0.1 percent I October and a spike of 1.0 percent in September. The November gain was backed by strength in manufacturing orders and convincing strength in both credit conditions and the stock market. The economy appears to be gaining some momentum with leading indicators up five months in a row and with four of those notably strong. The index of leading economic indicators surged 0.8 percent in November, following a rise of 0.1 percent I October and a spike of 1.0 percent in September. The November gain was backed by strength in manufacturing orders and convincing strength in both credit conditions and the stock market.
But there was less convincing strength coming from unemployment claims which came down from quirky levels in October that were tied to the government shutdown and counting problems in California. And the report's yield spread was once again the leading contributor even as long rates go up, a rise that will limit economic strength.
Other readings include a solid 0.4 percent gain in the coincident index which points to ongoing strength in the economy. All in all, this report is very solid and points to opening strength for the economy next year.
Despite volatility in some indicators, the recovery appears to be slowly gaining traction while inflation is still on a sluggish path. With these trends (not too strong growth, elevated unemployment, and weak inflation), the Fed will not be in a hurry to accelerate the pace of tapering. Of course, future moves are data dependent.
The focus this week is on the consumer and housing. Personal income and spending starts the week. After the upward revision to PCEs in Q3 GDP, the November income report will give a hint on how strong the fourth quarter is. For housing, existing home sales for November were disappointing but we get a second chance with new home sales. With starts up, homebuilders will want to see demand up. We also get an update on manufacturing with durables orders.
Personal income was weak in October, slipping 0.1 percent, following two very strong months at plus 0.5 percent. The decline was the first since January and may be related to the impact of the government shutdown on private wages. Wages & salaries were especially soft, up only 0.1 percent following gains of 0.4 and 0.6 percent in the two prior months. Overall consumer spending picked up a bit as expected at the beginning of the fourth quarter but not by much, to plus 0.3 percent in October versus plus 0.2 percent in September. Inflation readings were very soft with the price index unchanged and the core index up only 0.1 percent. The year-on-year rate for the price index was only plus 0.7 percent with the core year-on-year rate at plus 1.1 percent, both declining in the month and both well below the Fed's goal of 2 percent.
Personal income Consensus Forecast for November 13: +0.5 percent
Range: +0.2 to +0.6 percent
Personal consumption expenditures Consensus Forecast for November 13: +0.5 percent
Range: +0.4 to +0.8 percent
PCE price index Consensus Forecast for November 13: +0.1 percent
Range: 0.0 to +0.2 percent
Core PCE price index Consensus Forecast for November 13: +0.1 percent
Range: +0.1 to +0.2 percent
The Chicago Fed National Activity Index slipped in October, to minus 0.18 from a revised plus 0.18 in September. Pulled lower by a monthly drop in industrial production, the production component showed the biggest swing, subtracting 0.01 percentage points from October's index after being a big positive for September at plus 0.19. Consumption & housing remained by far the greatest negative, subtracting 0.15 points from the index after subtracting 0.18 points in September. Sales/orders/inventories was the only component adding to the index though not quite as much as September, at plus 0.03 vs plus 0.07.
Chicago Fed National Activity Index Consensus Forecast for November 13: 0.05
Range: -0.10 to 0.20
The Reuter's/University of Michigan's consumer sentiment index posted at 82.5 for the early December reading versus 75.1 for final November and 72.0 at mid-month November. The latest reading is the best since July. A striking gain in the report was the current conditions component, up nearly 10 points to 97.9 which was also the best reading since July. Also showing a gain was the expectations component, up nearly 6 points to 72.7 for the first plus 70 reading since August. A separate reading on the 12-month economic outlook really improved, to 95 versus November's 79.
Consumer sentiment Consensus Forecast for final December 13: 83.5
Range: 81.5 to 85.0
Durable goods orders in October fell on a downward swing in aircraft orders and the core was flat. New orders for durables declined 1.6 percent after gaining 4.2 percent in September. Excluding transportation, durables orders rose 0.4 percent in October after gaining 0.3 percent the prior month. The transportation component dropped 5.7 percent after jumping 13.1 percent in September. Outside of transportation, gains were seen primary metals, computers & electronics, and electrical equipment. Components that declined were fabricated metals, machinery, and "other."
Numbers reflect revisions from the more recent total factory orders report.
New orders for durable goods Consensus Forecast for November 13: +1.5 percent
Range: -0.5 percent to +4.0 percent
New orders for durable goods, ex-trans., Consensus Forecast for November 13: +0.8 percent
Range: +0.2 percent to +1.9 percent
The FHFA purchase only house price index continued to rise in September but at a moderate pace according to FHFA. The FHFA house price index for September rose 0.3 percent after increasing 0.4 percent in August. The September HPI is the twentieth consecutive monthly price increase in the purchase-only, seasonally adjusted index.
FHFA purchase only house price index Consensus Forecast for October 13: +0.4 percent
Range: +0.3 to +0.7 percent
New home sales surged 25.4 percent in October to a very solid 444,000 million annual rate. This was the highest rate since early in the year. Tight supply has been limiting sales all year. Due to the big jump in sales, supply at the October sales rate fell sharply to 4.9 months from 6.4 months.
New home sales Consensus Forecast for November 13: 450 thousand-unit annual rate
Range: 400 thousand to 475 thousand-unit annual rate
The Richmond Fed manufacturing index was up very sharply in November, jumping to 13 from 1 in October and zero in September. Details included a big gain for shipments, to 16 from minus 2, and a big gain for new orders, to 15 versus zero. The rise in new orders points to strength in activity for December's report.
Richmond Fed manufacturing index Consensus Forecast for December 13: 10
Range: 7 to 15
NYSE Early Close
SIFMA Recommended Early Close 2:00 ET
U.S. Holiday: Christmas Day. All Markets Closed.
Initial jobless claims in the December 14 week remained very elevated for a second week, at 379,000 for a 10,000 gain from the prior week and up a very sizable 74,000 from the week before that. But the 4-week average, which helps smooth out seasonal hiccups tied to holiday adjustment problems, was at 343,500 which is little changed from the month-ago trend.
Jobless Claims Consensus Forecast for 12/21/13: 340,000
Range: 321,000 to 365,000
Check back with Econoday web calendars for updates on consensus numbers for the week of December 30 through January 3.
The pending home sales index fell 0.6 percent in October to 102.1 and was down for a fifth month in row, pointing to further declines for final sales of existing homes which have already fallen for 2 months in a row. Confirming the negative trend, the year-on-year comparison, down 1.6 percent, was in the minus column for a 2nd month. The National Association of Realtors attributed some of the October weakness to the government shutdown which it says sidelined some buyers. But the key negative factor for the NAR is the rise underway in home prices. Higher mortgage rates are also a factor pulling down sales.
Pending home sales Consensus Forecast for November 13: +1.5 percent
Range: +0.9 to +3.5 percent
The Dallas Fed general business activity index in November posted its sixth consecutive positive reading but edged down to 1.9. The production index, a key measure of state manufacturing conditions, rose from 13.3 to 16.9, reaching its highest reading in five months. Other measures of current manufacturing activity indicated further expansion in November. The new orders index came in at 5.4, marginally slower from its October level of 6.2, and marked a seventh consecutive month of increased demand. The capacity utilization index rose to 16.2, its highest level since March 2011, and the shipments index edged up to 14.8. Expectations regarding future business conditions remained optimistic in November. The index of future general business activity was little changed at a reading of 7.
No consensus numbers are available for this month’s report
The S&P/Case-Shiller 20-city home price index (SA) rose an adjusted 1.0 percent in September vs monthly gains of 0.9 percent and 0.6 percent in the prior two months. Very respectable gains swept all 20 cities for the second month in a row, led this time by Atlanta at plus 1.9 percent followed by a string of cities in the West where S&P says there is talk now of a housing bubble. The depth of the gains nationally is impressive with the smallest monthly gain posted by Charlotte at a very respectable 0.4 percent. The year-on-year rate for the 20-city index is at a recovery best of plus 13.3 percent, up 5 tenths from August for the third straight improvement.
The S&P/Case-Shiller 20-city HPI (SA, m/m) Consensus Forecast for October 13: +1.1 percent
Range: +0.8 to +1.1 percent
The S&P/Case-Shiller 20-city HPI (NSA, y/y) Consensus Forecast for October 13: +13.7 percent
Range: +13.6 to +13.7 percent
The Chicago PMI in November remained exceptionally strong at reading of 63.0 versus an even stronger 65.9 in October. Strength was centered in new orders which were at a robust 68.8. The prior reading, at 74.3, was a 9 year high. Production slowed in the month but remained very strong at 64.3 versus 71.1.
Chicago PMI Consensus Forecast for December 13: 61.5
Range: 58.0 to 64.0
The Conference Board's consumer confidence index fell further in November, to 70.4 from October's revised 72.4. Confidence took a big hit in October, falling from September's 80.2 amid the government shutdown and budget standoff. The weakness continued to be centered in the expectations component where wide swings are common. Expectations fell to 69.3 from 72.2 in October and against 84.7 in September before all the Washington trouble started. Consumers are showing less confidence in their income prospects and especially on the outlook for the jobs market. But the present situation component continues to hold up, at 72.0 in November for only a 6 tenth decline from October.
Consumer confidence Consensus Forecast for December 13: 76.0
Range: 73.9 to 80.0
SIFMA Recommended Early Close 2:00 ET
U.S. Holiday: New Year’s Day. All Markets Closed.
Initial jobless claims for December 28 are scheduled.
Consensus numbers are not yet available for this month’s report
The Markit PMI manufacturing flash index reported solid growth in activity in its early reading for December at an index of 54.4 which was very little changed from 54.7 in final November and 54.3 at mid-month November. Strength was led by output where monthly growth was at 57.3, again which was in line with the two prior readings. Employment was a special positive, at 53.7 for a 1.4 point gain to show the best rate of growth since March. On the slowing side, however, were new orders, at 54.5 which is still respectable but down from 56.2 in the final November reading.
Consensus numbers are not yet available for this month’s report
The composite index from the ISM manufacturing survey in November turned in its best month in 2-1/2 years, rising to 57.3 from October's already strong 56.4. New orders, up 3 points to 63.3, were also the strongest in 2-1/2 years. Export orders, unlike the reading in the PMI manufacturing index, were very strong, at 59.5 for the strongest rate of monthly growth since early last year. And new orders are piling up into backlogs which are at 54.0 which is very strong for this reading. Strength in orders points to gains ahead for production which was already humming at a 62.8 level in November.
ISM manufacturing composite index Consensus Forecast for December 13: 56.8
Range: 56.0 to 58.3
Construction spending made a comeback in October but it was from the public sector. Overall construction outlays rebounded 0.8 percent after declining 0.3 percent in September. Public construction spending jumped a monthly 3.9 percent, following a 1.9 percent decrease the month before. In the private sector, residential outlays dipped 0.6 percent in October, following a 1.7 percent boost the month before. But subcomponent news was mixed. New 1-family spending declined 0.6 percent after rising 1.7 percent. Strength was in new multi-family outlays, up 2.2 percent after jumping 4.3 percent in September. Residential outlays excluding new home fell 1.2 percent, following a gain of 3.6 percent the month before.
Construction spending Consensus Forecast for November 13: +1.0 percent
Range: +0.5 to +4.0 percent
Sales of total light motor vehicles in November came in at a much greater-than-expected annual rate of 16.4 million, easily beating out Econoday expectations for 15.7 million as well as high-end expectations for 16.1 million. Combined domestics and imports jumped a monthly 7.7 percent following a 0.6 percent rise in October. Details show across-the-board gains. For November, light trucks increased 8.8 percent while cars gained 6.7 percent. Imports sold better than domestic-made, up 9.3 percent versus up 7.3 percent.
Motor vehicle domestic sales Consensus Forecast for December 13: 12.5 million-unit rate
Range: 12.4 to 12.6 million-unit rate
Motor vehicle total sales Consensus Forecast for December 13: 16.0 million-unit rate
Range: 15.6 to 16.4 million-unit rate
R. Mark Rogers is the author of The Complete Idiot’s Guide to Economic Indicators, Penguin Books.
He can also be found on a weekly broadcast talking about the U.S. economy, the easiest way to find him is by going to iTunes and searching for "Simply Economics."
Econoday Senior Writer Mark Pender contributed to this article.
|
