|
The Fed is in transition—both in policy and leadership. This past week’s focus was on whether economic news made taper more likely with the December 18 FOMC decision. Economic news was limited.
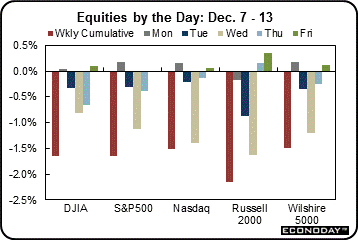 Equities fell notably this past week. At the start of the week, there was no notable economic news as traders awaited the December 17-18 FOMC decision and indexes were mixed and little changed. However, the S&P 500 edged up to a new record high. But it was downhill the next three days. Stocks declined Tuesday on profit taking and on improved labor market numbers. Job openings in the U.S. hit a five-year high in October, suggesting that employers were confident about demand despite the federal government shutdown which took place that month. Also, traders began to sense that a budget deal in Washington was likely. Equities fell notably this past week. At the start of the week, there was no notable economic news as traders awaited the December 17-18 FOMC decision and indexes were mixed and little changed. However, the S&P 500 edged up to a new record high. But it was downhill the next three days. Stocks declined Tuesday on profit taking and on improved labor market numbers. Job openings in the U.S. hit a five-year high in October, suggesting that employers were confident about demand despite the federal government shutdown which took place that month. Also, traders began to sense that a budget deal in Washington was likely.
 The biggest downward movement was Wednesday as stocks declined on news of two-year budget deal in Washington. This was seen as increasing the odds of taper on December 18 as the Fed has stated that one concern about downside risks to the economy was the lack of certainty about the budget and debt ceiling. The biggest downward movement was Wednesday as stocks declined on news of two-year budget deal in Washington. This was seen as increasing the odds of taper on December 18 as the Fed has stated that one concern about downside risks to the economy was the lack of certainty about the budget and debt ceiling.
Equities declined Thursday as good news was seen as bad news—increased odds of Fed taper. Released Thursday, retail sales advanced solidly in November, topping expectations with broad-based gains. Initial jobless claims unexpectedly spiked but were discounted on the view that seasonal adjustment is difficult during the holiday season. On Friday, stocks were little changed with the only notable economic news being a soft producer price report.
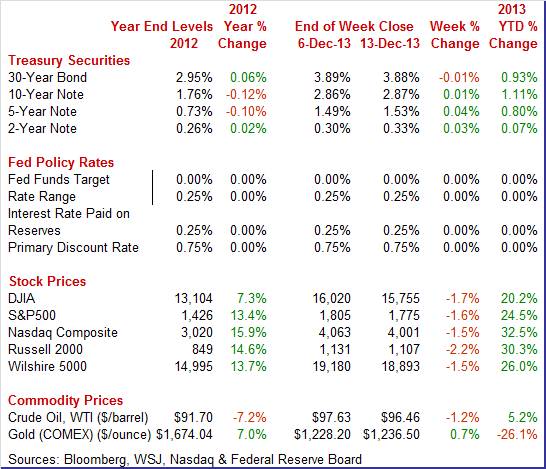
Equities were down this past week. The Dow was down 1.7 percent; the S&P 500, down 1.6 percent; the Nasdaq, down 1.5 percent; the Russell 2000, down 2.2 percent; and the Wilshire 5000, down 1.5 percent.
For the year-to-date, major indexes are up as follows: the Dow, up 20.2 percent; the S&P 500, up 24.5 percent; the Nasdaq, up 32.5 percent; the Russell 2000, up 30.3 percent; and the Wilshire 5000, up 26.0 percent.
Weekly percent change column reflects percent changes for all components except interest rates. Interest rate changes are reflected in simple differences.
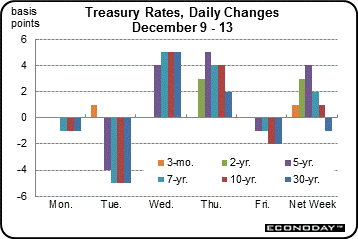 Treasury rates were mostly up this past week but modestly. After little change Monday, rates dipped somewhat on Tuesday as yields were seen as attractive—many rates were near three-month highs. Treasury rates were mostly up this past week but modestly. After little change Monday, rates dipped somewhat on Tuesday as yields were seen as attractive—many rates were near three-month highs.
Yields gained modestly at mid-week on news of a budget deal in Washington—fueling speculation that the Fed might taper at the upcoming FOMC meeting. Rates gained again Thursday on stronger-than-expected retail sales data. Yields eased slightly on Friday on a very soft producer prices report which reminded traders that inflation is running well below the Fed’s target—indicating that the Fed still has room to continue the current pace of quantitative easing.
For this past week Treasury rates were up as follows: 3-month T-bill, up 1 basis point; the 2-year note, up 3 basis points; the 5-year note, up 4 basis points; the 7-year note, up 2 basis points; and the 10-year note, up 1 basis point. The 30-year bond was down 1 basis point.
 The price of crude fell modestly this past week. After little change Monday, the spot price of West Texas Intermediate rose a dollar a barrel on expectations that a government report on inventories posted the next day would show a draw down in stocks. Tuesday's price was at a six-week high. The price of crude fell modestly this past week. After little change Monday, the spot price of West Texas Intermediate rose a dollar a barrel on expectations that a government report on inventories posted the next day would show a draw down in stocks. Tuesday's price was at a six-week high.
On Wednesday, the government report showed a decline in crude supply but a sharp rise in product inventories. The increase in product inventories indicated less need for crude, bumping WTI down by a dollar a barrel. WTI was little changed Thursday despite a jump in retail sales as higher inventories of refined product continued to weigh on crude prices. Weak demand for refined products continued to weigh on crude on Friday with fears of Fed taper also coming into play.
Net for the week, the spot price for West Texas Intermediate declined $1.17 per barrel to settle at $96.46.
With little economic news, real activity continued to improve while inflation was hard to be found.
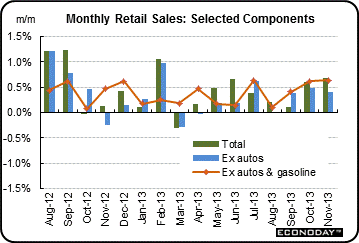 The holiday season is turning out to be better than expected for retailers. Overall retail sales in November jumped 0.7 percent, following a rise of 0.6 percent the month before (originally up 0.4 percent). Analysts forecast a 0.6 percent surge. The holiday season is turning out to be better than expected for retailers. Overall retail sales in November jumped 0.7 percent, following a rise of 0.6 percent the month before (originally up 0.4 percent). Analysts forecast a 0.6 percent surge.
Autos were a big part of the November boost, gaining 1.8 percent after a 1.1 percent increase in October. Excluding autos, sales increased 0.4 percent after advancing 0.5 percent in October. But gasoline prices tugged down on this measure. Gas station sales dropped 1.1 percent in November, following a 0.4 percent decrease the month before. Excluding both autos and gasoline, sales jumped 0.6 percent in November, matching the October pace.
In the core, strength was seen in furniture & home furnishings, electronics & appliance stores, building materials & garden equipment, nonstore retailers, and food services & drinking places.
 Weakness was led by declines in food & beverage stores, clothing & accessories, and miscellaneous store retailers. Weakness was led by declines in food & beverage stores, clothing & accessories, and miscellaneous store retailers.
General merchandise (which includes department stories) edged up only 0.1 percent, following a 0.3 percent rise in October.
The latest report suggests a healthy number for PCEs in fourth quarter GDP and lowers worry about the high inventory figure in third quarter GDP. With healthy November numbers and upward revisions to October, the odds are higher for the Fed to begin taper next week. Against that argument is an unexpected spike in jobless claims, posted the same time as retail sales.
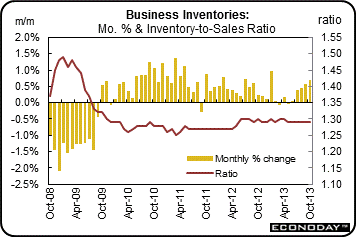 The jury is still out on whether the sharp third quarter boost in inventories will weigh on fourth quarter production. But at the start of the fourth quarter sales were keeping up with inventories. Inventory balance held stable in October as a 0.7 percent rise in business inventories was roughly in line with a 0.5 percent rise in business sales that leaves the stock-to-sales ratio unchanged at 1.29. The jury is still out on whether the sharp third quarter boost in inventories will weigh on fourth quarter production. But at the start of the fourth quarter sales were keeping up with inventories. Inventory balance held stable in October as a 0.7 percent rise in business inventories was roughly in line with a 0.5 percent rise in business sales that leaves the stock-to-sales ratio unchanged at 1.29.
Inventories among retailers rose 0.8 percent in October, also roughly in line with a 0.5 percent rise in retail sales during the month with the stock-to-sales ratio in the sector unchanged at 1.42. Retail inventories of vehicles jumped in the month but so did sales. As already noted, the strong retail sales report for November—which showed strength across most components—points to easing inventory pressure for November.
 For November, there was widespread softness in inflation at the producer level. The November PPI edged down 0.1 percent, following a decline of 0.2 percent in October. For November, there was widespread softness in inflation at the producer level. The November PPI edged down 0.1 percent, following a decline of 0.2 percent in October.
The core rate, which excludes both food and energy, eased to a 0.1 percent rise after gaining 0.2 in October. Analysts projected a 0.1 percent increase.
At the headline level, weakness was led by energy which decreased 0.4 percent, following a decrease of 1.5 percent in October. Gasoline prices declined 0.7 percent in November after a drop of 3.8 percent in October. Food prices also were sluggish, posting at unchanged after rebounding rebounded 0.8 percent October.
Leading the rise within the core, prices for light motor trucks increased 0.6 percent. Higher prices for agricultural machinery and equipment also contributed to the advance in the finished core index. Tugging down on the core was a 0.8 percent drop in prices for passenger cars and a 0.5 percent decrease for computers.
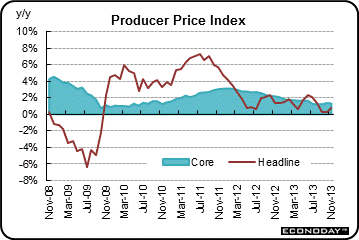 For the overall PPI, the year-ago rate posted at 0.7 percent versus 0.3 percent in October (seasonally adjusted). The core rate eased to 1.3 percent from 1.4 percent in October. On a not seasonally adjusted basis for November, the year-ago headline PPI was up 0.7 percent, while the core was up 1.3 percent. For the overall PPI, the year-ago rate posted at 0.7 percent versus 0.3 percent in October (seasonally adjusted). The core rate eased to 1.3 percent from 1.4 percent in October. On a not seasonally adjusted basis for November, the year-ago headline PPI was up 0.7 percent, while the core was up 1.3 percent.
The bottom line is that inflation is close to nonexistent at the producer level and the doves at the Fed can argue that inflation is too low and that it is too soon to taper at the December 17-18 FOMC. Hawks will point to improvement in the real economy.
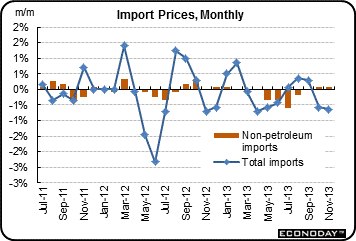 Inflation is too low judging by import & export prices which continue to move in reverse, at minus 0.6 percent for a second straight month for import prices and at only plus 0.1 percent for export prices following a 0.6 percent decline in October. Inflation is too low judging by import & export prices which continue to move in reverse, at minus 0.6 percent for a second straight month for import prices and at only plus 0.1 percent for export prices following a 0.6 percent decline in October.
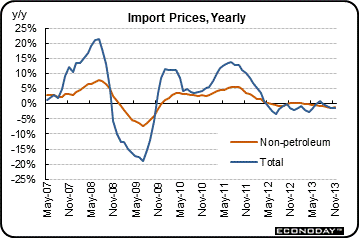
Year-on-year rates show negative readings for the fourth straight month for both, at minus 1.5 percent for import prices and at minus 1.6 percent on the export side.
 Petroleum was the key negative factor for a second straight month on the import side, falling 3.5 percent in November following a 3.2 percent monthly decline in October. Excluding petroleum, import prices show gains for the two months but only very small ones, 0.1 percent for both November and October. Petroleum was the key negative factor for a second straight month on the import side, falling 3.5 percent in November following a 3.2 percent monthly decline in October. Excluding petroleum, import prices show gains for the two months but only very small ones, 0.1 percent for both November and October.
Prices of imported finished goods, which offer clues to consumer prices and producer prices, are flat with a 0.2 percent monthly gain for capital goods, a 0.1 percent gain for consumer goods, and no change for motor vehicles. Year-on-year rates for all these readings are in the negative column.
Export details show a second monthly decline for agricultural products, down 0.2 percent in November for a year-on-year rate of minus 6.7 percent. This is a negative indication for farm income. Prices of finished goods on the export side are very similar to those on the import side.
Global inflation pressures are flat at best and have been moving into reverse on prior declines in oil prices. Essentially, inflation is not being imported into the U.S. and deflation could even be an issue—one that adds to the arguments for no taper on December 18 for quantitative easing.
Demand is picking up as reflected in retail sales while inflation is nearly nonexistent as seen this past week in producer prices and import prices. Anemic inflation rates do give the Fed room, if it wants, to continue quantitative easing.
While many see the odds of taper as having risen this month, most economists still see taper beginning early in 2014—either in January or March. A minority of economists expect taper on December 18.
Not only is the Fed in transition for policy but also for leadership. Senator Reid last week said that the Senate late this week will consider Janet Yellen’s nomination to be chair of the Fed, replacing Ben Bernanke on February 1, 2014 if approved.
Market attention is focused on Wednesday’s FOMC decision on whether to taper or not. Recent economic news has been moderately more upbeat with jobs and retail sales standing out. Some economists now put it at even odds of whether taper starts or not. News on two key sectors posts during the week. Manufacturing has shown signs of improvement and industrial production will provide a national summary for November. On the housing front, the Census Bureau plays catchup with starts data, releasing for three months—September, October, and November.
The Empire State manufacturing index turned negative in November, falling to minus 2.21 in the November reading versus 1.52 in October. Though the degree of change was slight, the breadth of change was wide with negatives sweeping the November readings. New orders were at minus 5.53 with unfilled orders at a very steep minus 17.11. Lack of orders hinted at further declines in other readings including shipments, at minus 0.53, and employees, at zero for November. But this was only the first time since May that the Empire State index was in the minus column, which may point more to a flattening in growth not a reversal.
Empire State Manufacturing Survey Consensus Forecast for December 13: 4.50
Range: 0.00 to 8.00
Nonfarm business productivity for the third quarter gained 1.9 percent, following a 1.8 percent increase the prior quarter. Unit labor costs dipped an annualized 0.6 percent after a 0.5 percent increase the prior quarter. Based on the upward revision to third quarter GDP to 3.6 percent from the initial estimate of 2.8 percent, there likely will be a notable upward revision to productivity and downward revision to unit labor costs.
Nonfarm Business Productivity Consensus Forecast for revised Q3 13: +2.9 percent annual rate
Range: +2.2 to +3.2 percent annual rate
Unit Labor Costs Consensus Forecast for revised Q3 13: -1.4 percent annual rate
Range: -1.6 to 0.0 percent annual rate
The Markit PMI manufacturing index (final) grew solidly in November with the composite index well over 50, at a 10-month high of 54.7 versus 54.3 for the mid-month flash reading and versus 51.8 for final October. The outlook for December is also solid as new orders, the most important and most heavily weighted component of the composite, rose strongly to 56.2 for a 3-1/2 point gain from October. But the strength is not coming from foreign demand as new export orders, at 51.4, remain subdued.
Markit PMI manufacturing flash index Consensus Forecast for December 13: 55.0
Range: 55.0 to 55.5
Industrial production for October slipped 0.1 percent after jumping 0.7 percent in September. Importantly, the manufacturing component advanced 0.3 percent in October, following a rise of 0.1 percent the month before. Manufacturing increased despite a decline of 1.3 percent in motor vehicles and parts in October. Excluding motor vehicles, manufacturing gained 0.4 percent after no change in September. Output of utilities fell 1.1 percent in October after jumping 4.5 percent in September. Mining activity decreased 1.6 percent, following a gain of 1.0 percent in September. Capacity utilization for total industry slipped to 78.1 percent from 78.3 percent in September. Looking ahead, production worker hours in manufacturing were up 0.5 for the month, suggesting a significant gain in the manufacturing component for November industrial production.
Industrial production Consensus Forecast for November 13: +0.6 percent
Range: +0.2 to +1.0 percent
Manufacturing production component Consensus Forecast for November 13: +0.5 percent
Range: +0.2 to +0.6 percent
Capacity utilization Consensus Forecast for November 13: 78.4 percent
Range: 78.2 to 78.7 percent
The consumer price index dipped 0.1 percent in October after rising 0.2 percent the prior month. The CPI excluding food and energy rose 0.1 percent in both October and September. Tugging down on the overall figure, energy dropped 1.7 percent after a 0.8 percent rise in September. Gasoline fell a monthly 2.9 percent, following a 0.8 percent increase. Food edged up 0.1 percent in October after no change the month before. Within the core, the shelter index rose but posted its smallest increase since December 2012. The indexes for airline fares, for recreation, and for used cars and trucks also increased. The medical care index was unchanged, while the indexes for apparel, for household furnishings and operations, and for new vehicles all declined.
CPI Consensus Forecast for November 13 0.0 percent
Range: 0.0 to +0.1 percent
CPI ex food & energy Consensus Forecast for November 13: +0.1 percent
Range: +0.1 to +0.2 percent
NAHB housing market index for November posted at 54 this month, unchanged from a downward revised October reading and down from a recovery peak of 58 in August. The index now has failed to show a gain for 4 straight months. But there's still plenty of strength in the 6-month outlook where the component was at 60. Present sales were also strong at 58. But judging by lack of traffic, which was well below 50 at 42, high-end buyers appear to be a driving force in sales. The traffic component has yet to break 50 this recovery.
NAHB housing market index Consensus Forecast for December 13: 55
Range: 53 to 57
The housing starts report will be notably unusual due to the recent federal government shutdown and data collection issues. There will be three months of new data for housing starts for September, October, and November. Permits data have already been published for September and October.
Housing starts rose in August but only because July was revised down. Housing may be flattening. Housing starts in August advanced 0.9 percent after rebounding 5.7 percent in July. The August starts annualized level of 0.891 million units was up 19.0 percent on a year-ago basis. July was revised down to 0.883 million units from the original estimate of 0.896 million. The gain in starts was led by the single-family component which increased 7.0 percent after declining 3.0 percent the prior month. The volatile multifamily component declined 11.1 percent after jumping 28.7 percent in July.
Permits jumped 6.2 percent in October after gaining 5.2 percent the month before. The 1.034 million pace was up 13.9 percent on the year. Strength was in the multifamily component which spiked a monthly 15.3 percent after a 20.1 percent surge in September. The single-family component rebounded 0.8 percent after dipping 1.9 percent in September.
The multifamily component was up 22.5 percent on a year-ago basis while the single-family component was 8.8 percent.
Housing starts Consensus Forecast for November 13: 0.952 million-unit rate
Range: 0.925 million to 1.000 million-unit rate
Housing permits Consensus Forecast for November 13: 0.995 million-unit rate
Range: 0.970 million to 1.055 million-unit rate
Housing starts Consensus Forecast for October 13: 0.935 million-unit rate
Range: 0.885 million to 0.995 million-unit rate
Housing starts Consensus Forecast for September 13: 0.910 million-unit rate
Range: 0.857 million to 0.945 million-unit rate
The FOMC announcement at 2:00 p.m. ET for the December 17-18 FOMC policy meeting is expected to leave policy rates unchanged. However, with recent improvement in economic data, there are increased odds for the start of taper. Focus also will be on any changes in guidance and the characterization of the economy. Also, the Fed will release its quarterly forecasts at the same time as the statement. With the unemployment rate down to 7.0, an interesting question will be how much may the Fed lower its unemployment rate forecast.
FOMC Consensus Forecast for 12/18/13 policy vote on fed funds target range: unchanged at a range of zero to 0.25 percent
Chairman press conference after the FOMC meeting statement is scheduled for 2:30 p.m. ET. Fed Chairman Ben Bernanke conducts a press conference after FOMC meetings in which participants present their quarterly economic forecasts. Bernanke is expected to comment on the forecast and take Q&A. This is Bernanke’s last chairman press conference.
Initial jobless claims for the December 7 week showed a huge 68,000 jump to 368,000. Claims are now back at their highest point since the government shutdown in early October. The 4-week average is the only handle right now on initial claims and it shows a much less severe increase of 6,000 to 328,750, a level that is nearly 20,000 below the month-ago trend to point at improvement in the jobs market. Data on continuing claims are mixed, up 40,000 in the November 30 week to 2.791 million but with the 4-week average down 4,000 to 2.794 million.
Jobless Claims Consensus Forecast for 12/14/13: 337,000
Range: 323,000 to 360,000
The general business conditions index of the Philadelphia Fed's Business Outlook Survey for November was still above zero to indicate monthly growth, but at 6.5 the rate of growth was the slowest since May and is much slower than October's 19.8 and September's 22.3. New orders were down nearly 16 points but to a still moderately healthy monthly growth rate of 11.8. Unfilled orders, after moving into the plus column the prior month, are back in the negative column at minus 4.2.
Philadelphia Fed survey Consensus Forecast for December 13: 10.0
Range: 5.0 to 20.0
Existing home sales declined 3.2 percent in October to a 5.12 million annual sales rate. Weakness, for the third month in a row, was centered in the key single-family component which was down 4.1 percent following a 1.5 percent decline in September. The condo component, which is much smaller than single-family homes, popped 3.3 percent higher but still could not offset the prior month's 4.7 percent decline. National supply for existing homes was down for a third straight month, at 2.13 million units for sale. The rate, however, on a sales basis did improve but only very slightly, to 5.0 months from 4.9 months in the prior 2 months.
Existing home sales Consensus Forecast for November 13: 5.02 million-unit rate
Range: 4.95 to 5.25 million-unit rate
The Conference Board's index of leading indicators rose 0.2 percent in October versus September's upwardly revised jump of 0.9 percent and August's strong gain of 0.7 percent. Initial claims held down the index very steeply in October, by 0.46 percentage points as the government shutdown together with a counting backup in California inflated claims levels early in the month. Claims have since come down and are certain to be a positive in the November report.
The only other negative component in October was consumer expectations which showed some pop for November. Strength remains centered in financial components where the yield curve component, as it has all recovery, continues to skew the composite higher, contributing 0.28 points to October. The next largest contributors were building permits, at 0.19, and, at 0.16, the report's credit index which continues to point to improving levels of borrowing.
Leading indicators Consensus Forecast for November 13: +0.7 percent
Range: +0.3 to +0.8 percent
GDP growth in the second estimate for the third quarter was revised up to 3.6 percent annualized, compared to the 2.8 percent advance estimate and 2.5 percent in the second quarter. The upward revision was largely due to a higher estimate for inventory growth. Small upward revisions were in nonresidential fixed structures and government purchases. Net exports were revised down (higher imports and lower exports). Small downward revisions were in PCEs and residential investment. Demand numbers were little changed. Final sales of domestic product were nudged down to 1.9 percent, compared to the initial estimate of 2.0 percent and 2.1 percent in the second quarter. Final sales to domestic purchasers (which exclude net exports) were bumped up to 1.8 percent versus the first estimate of 1.7 percent and 2.1 percent in the second quarter. The GDP price index was raised marginally to an annualized gain of 2.0 percent, compared to the advance estimate of 1.9 percent and second quarter growth of 0.6 percent. The core GDP price index was unrevised at 1.9 percent, following an annualized rise of 0.9 percent in the second quarter.
Real GDP Consensus Forecast for third estimate Q3 13: +3.6 percent annual rate
Range: +3.3 to +3.8 percent annual rate
GDP price index Consensus Forecast for third estimate Q3 13: +2.0 percent annual rate
Range: +2.0 to +2.0 percent annual rate
The Kansas City Fed manufacturing index edged up to 7 in November, up slightly from 6 in October and 2 in September. The composite index is an average of the production, new orders, employment, supplier delivery time, and raw materials inventory indexes. The production index fell slightly at nearly all types of durable goods plants, while production of nondurable goods products increased, particularly for chemicals and plastics. Most other month-over-month indexes improved over last month. The new orders index jumped from 3 to 15, and the order backlog and employment indexes reached their highest levels since early 2012. In contrast, the production index moderated from 14 to 11, and the shipments and new orders for exports indexes also slipped somewhat.
Kansas City Fed manufacturing index Consensus Forecast for December 13: 8
Range: 7 to 8
R. Mark Rogers is the author of The Complete Idiot’s Guide to Economic Indicators, Penguin Books.
He can also be found on a weekly broadcast talking about the U.S. economy, the easiest way to find him is by going to iTunes and searching for "Simply Economics."
Econoday Senior Writer Mark Pender contributed to this article.
|
