
 Fed cuts discount rate to ease credit crunch
By R. Mark Rogers, Senior Economist, Econoday
August 17, 2007

Equities were headed down the first four days of the week as the Fed and other central banks continued to add extra liquidity to the banking system and financial markets. Investors out of fear and uncertainty moved funds out of equities and into government fixed income instruments, pushing rates down – especially on the near end of the yield curve. In response to liquidity problems at high quality lenders, such as banks, the Fed announced on Friday morning a 50 basis point cut in the discount rate, the rate the Fed charges banks and other financial institutions for reserves. The Fed left the fed funds target rate unchanged. The Fed’s move calmed both the equity and credit markets significantly. A key question is whether the Fed’s discount rate cut is a precursor to an imminent cut in the fed funds rate. This past week’s inflation numbers and other economic data may provide some clues.
Crude oil prices were volatile as usual but new factors came into play this past week. Prices rose the first three days of the week, reaching $73.26 for Wednesday settlement. Upward pressure largely came from two tropical storms in the mid-Atlantic and Gulf and in which one turned into the season’s first hurricane, Hurricane Dean. At mid-week, Tropical Storm Erin hit the Texas coast – which is packed with oil refiners – but the weakened storm did little damage to oil industry structures. Meanwhile, Tropical Storm Dean moved from the Atlantic to the Caribbean and became Hurricane Dean, and was headed toward the Yucatan Peninsula but still could head further north in the Gulf. Inventory draw downs also boosted prices on Wednesday. But crude prices dropped $2.26 per barrel on Thursday as the downward spiral in equities led many traders to believe that U.S. economic growth would be slowing sharply. Friday’s cut in the discount rate by the Fed firmed prices by $0.98 per barrel on the day as fears of a slowing U.S. economy subsided.
The spot price per barrel for West Texas Intermediate ended up little changed this past week. Spot prices for West Texas Intermediate edged up $0.51 per barrel to close at $71.98 per barrel.

Equities ended the week down even though the Fed’s discount rate cut this past Friday led to an end-of-the-week rally that limited the damage. Stocks were especially volatile with intraday swings of 300 points for the Dow at times. From Monday through Thursday, subprime worries weighed on equities. But the market started the week fairly stable with healthy retail sales on Monday restoring some confidence in the economy. Stocks headed up on the retail sales numbers but ended the day essentially flat over concern that subprime problems were spreading. The sharpest declines were seen on Tuesday and Wednesday – the Dow dropping 207.61 points and 213.91 points on these days, respectively. Warnings from Home Depot and Wal-Mart added to the downward momentum. Wednesday’s release of a 16-year-low builders’ confidence figure and a 10-year-low in housing starts on Thursday tugged stocks down except for bottom fishing that bumped up the small caps. An announcement that Countrywide Financial was having to draw on an $11.5 billion line of credit to continue to operate spooked equities early on Thursday with the Dow down over 340 points before a late rally pushed the Dow back almost to break even for the day. The Fed’s discount rate cut boosted equities across the board on Friday. Financials led the late rally on Thursday and during the day on Friday.

Last week, major indexes were down net. Major indexes were down as follows: the Dow, down 1.2 percent; the S&P 500, down 0.5 percent; the Nasdaq, down 1.6 percent; and the Russell 2000, down 0.3 percent.
Year-to-date last week, the Dow is up 4.9 percent; the S&P 500, up 1.9 percent; the Nasdaq, up 3.7 percent. The Russell 2000 is down 0.2 percent.
Interest rates fell last week – especially on the near end. Rates fell despite relatively strong real sector economic data during the week, including for retail sales and industrial production. Markets did see Tuesday’s PPI report and Wednesday’s CPI report as favorable, although that interpretation is open to debate. The biggest interest rate move last week was a 62 basis point drop in the 3-month T-bill during Wednesday. The decline was due to heavy flight to quality, the Fed flooding reserves into the financial system, and traders betting that there may be an imminent cut in the fed funds target rate by the Fed.
The Treasury yield curve fell last week. Yields were down as follows: 3-month T-bill, down 78 basis points; 2-year T-note, down 29 basis points; 3-year, down 26 basis points; 5-year, down 25 basis points; the 10-year bond, down 13 basis points; and the 30-year bond, down 4 basis points.

Rates fell last week with the 3-month T-bill dropping especially sharply due to flight to quality as equities swooned. The 3-month T-bill is down to rates not seen since October 2005.


Weekly percent change column reflects percent changes for all components except interest rates. Interest rate changes are reflected in simple differences.
Last week was packed with generally positive news on inflation, consumer spending and manufacturing. And at week end, the Fed jumped into the fray with a 50 basis point cut in the discount rate.
In response to the credit crunch expanding beyond the subprime sector, the Fed cut the discount rate on Friday by 50 basis points to 5.75 percent. This was in addition to injecting over $100 billion in extra reserves to increase liquidity. The discount rate is the rate the Fed charges when lending reserves to banks directly. This is in contrast to the fed funds rate which is what banks charge other banks when lending spare reserves. The Fed left the fed funds target rate unchanged at 5-1/4 percent.
One of the problems during this past week’s credit crunch was that banks were beginning to wait on incoming payments before making payments to their creditors in order to avoid being in the negative on cash at the end of the day. The Fed basically told banks not to worry about waiting on payments because at the end of the day, you can go to the discount window and get the reserves you need. The Fed also expanded the loan period to 30 days to those needing it.
The discount rate has been 100 basis points above the fed funds target rate since the Fed changed its discount rate strategy in January 2003. The Fed decided that the discount rate should be above the fed funds rate to give banks an incentive to first go to the private market to get needed reserves when short on reserves. This is the first time that differential has been less than 100 basis points under this discount rate regime.

Is the Fed getting ready to cut the fed funds rate target' A special FOMC statement was released on the discount rate cut.
“Financial market conditions have deteriorated, and tighter credit conditions and increased uncertainty have the potential to restrain economic growth going forward. In these circumstances, although recent data suggest that the economy has continued to expand at a moderate pace, the Federal Open Market Committee judges that the downside risks to growth have increased appreciably. The Committee is monitoring the situation and is prepared to act as needed to mitigate the adverse effects on the economy arising from the disruptions in financial markets.”
This announcement by the FOMC was highly unusual but was very creative in terms of helping the Fed retain flexibility. These kinds of statements usually come out only when the FOMC actually has made a move. In terms of Fed speak, the FOMC came close to stating a neutral policy stance but did not. When the Fed moves toward a neutral stance, the word “balanced” typically appears but did not in the press release. Essentially, the added liquidity and extended loan periods will help the credit markets operate smoothly giving the FOMC time to further debate internally its anti-inflation stance. The Fed has retained the option of not lowering the fed funds rate at its next meeting while at the same time opening the door to do so.
The Fed move clearly helps mainstream banks and other healthy lenders avoid liquidity problems. But the discount rate cut does not eliminate the issue of devalued assets with and from subprime lenders. The Fed likely will continue to monitor economic data and financial conditions as the next FOMC meeting on September 18 approaches. The Fed likely welcomes a little slowing in real economic growth and would like to see further confirmation that core inflation has come down on a sustainable basis.

Nonetheless, the fed funds futures market has priced in a 25 basis point cut in the fed funds target rate at the September 18 FOMC meeting. Futures also price in a 4-3/4 percent target by the end of October and a 4-1/2 percent target by December of this year.
Consumer price inflation in July softened overall in July while core inflation held steady. The overall consumer price index posted a 0.1 percent increase in July, following a 0.2 percent rise in June and matching the consensus expectation for a 0.1 percent rise in the overall CPI. The core CPI showed a second straight and as-expected 0.2 percent increase.

Energy prices actually helped the overall CPI in July. In the non-expenditure category for energy, prices fell 1.0 percent, following a 0.5 percent decline the month before. For July, gasoline prices were down 1.7 percent. Food price inflation moderated to a 0.3 percent rise in July from 0.5 percent in June.
Expenditure categories showing weakness were transportation, recreation, and “other.” Upward price pressure was seen in medical care, apparel, and food & beverages. Housing and also education & communication both were moderate.
While the markets declared that the core rate increase of 0.2 percent in July was favorable for the Fed to consider easing interest rates soon, a closer examination casts doubt on this view. On an unrounded basis, the core CPI rose 0.23618 in July, following a 0.23244 percent boost in June. These are on the high side of the rounded 0.2 percent gains. When annualized, the core CPI rose 2.9 percent in July, following a 2.8 percent increase in June. These are notably higher than the Fed’s implied target zone of 1 to 2 percent annualized for the core PCE price index – even after taking into account that the core CPI tends to run about 0.2 to 0.3 percentage points higher than the core PCE price index. The latest core CPI likely still fits the Fed’s view that any improvement in inflation is not yet convincing and provides plenty of fodder for the Fed to keep its anti-inflation bias.

Year-on-year, the overall CPI stood at 2.4 percent in July, compared to 2.7 percent in June. The core rate was unchanged in July at up 2.2 percent on a year-on-year basis.
Overall producer prices jumped in July due to higher energy costs but the core eased. The overall PPI increased 0.6 percent in July, following a 0.2 percent dip in June. In contrast, the core rate eased to 0.1 percent in July, following a 0.3 percent rise in June. For the overall PPI, strength was in energy. By special groupings, energy rebounded 2.5, following a 1.1 decline in June. July’s jump in energy was led by gasoline, up 3.2 percent, following a 3.9 percent drop in June. Consumer food prices slipped another 0.1 percent in July, following a 0.8 percent drop in June. The easing in the core rate was primarily due to soft prices for capital equipment.

The year-on-year rate for the overall PPI jumped to up 3.9 percent in July (seasonally adjusted) from up 3.2 percent in June. The year-on-year core rate stood at 2.4 percent in July, up from 1.8 percent in June.

The nation's trade gap shrank in June to $58.1 billion from $59.2 billion in May. The improvement reflects higher exports, a reflection of strong global demand, and slowing imports, a reflection of slowing domestic demand including a decline in imports of consumer goods excluding autos.

The merchandise trade gap (Census basis) narrowed to $65.7 billion from a revised $66.0 billion deficit in May. The goods gap excluding petroleum was little changed in June at $42.3 billion, compared to $42.2 billion the prior month.
On the import side, overall merchandise imports increased $1.3 billion in June. Gains were seen in automotive, capital goods excluding autos, and in industrial supplies. Imports of consumer goods excluding autos declined somewhat while foods, feeds & beverages slipped marginally. On the export side, merchandise exports increased $1.6 billion in June. Gains were seen in industrial supplies, automotive, capital goods excluding autos, and in food, feeds & beverages.
The latest trade data point to what appear to be shifts in relative strength within the U.S. economy. Exports continue to do well while the consumer sector may be moderating a little. Year-on-year, overall exports were up 11.2 percent in June while imports were up 3.8 percent. Manufacturers in the U.S. clearly are benefiting from a lower dollar.
Retail sales rebounded moderately in July with strength broad-based. Overall retail sales increased 0.3 percent in July, following a 0.7 percent drop in June. Excluding auto sales, retail sales rebounded 0.4 percent in July, following a 0.2 percent decline in June. Excluding both motor vehicles and gas stations, sales jumped a robust 0.6 percent, following no change the prior month.

July’s resurgence in overall sales was broad-based with gains led by clothing, electronics, and general merchandise (mainly department stores). Weakness was primarily in gasoline sales and motor vehicles sales. Because much of the weakness in gasoline sales was price related (price decline), consumer spending is actually stronger once that factor is taken into account.
The latest retail sales numbers show a robust consumer sector but were before the recent sharp declines in the stock market. More recent weekly numbers in chain store sales suggest that recent strength will likely moderate – but not weaken excessively. In light of recently healthy payroll job increases in the private sector and low initial jobless claims, fundamentals are still good for the consumer sector.
Year-on-year, overall retail sales in July declined to up 3.2 percent from up 4.0 percent the month before. Excluding motor vehicles, July’s year-on-year sales stood at up 4.4 percent, compared to up 4.5 percent in June. Excluding motor vehicles and gas station sales, year-on-year sales in July rose to up 5.2 percent from up 4.9 percent the prior month.

A healthy manufacturing sector is important for the current economic expansion to remain on a respectable upward trajectory and the latest industrial production numbers indicate that this sector is in good shape. Industrial production in July was robust with weakness in utilities masking strength in the headline number. Overall industrial production advanced by 0.3 percent in July, following a 0.6 percent jump in June. Importantly, the manufacturing component posted a 0.6 percent gain in July, equaling June’s surge. For July, utilities output fell 2.1 percent while mining output jumped 0.7 percent.

Overall capacity utilization edged up to 81.9 percent from 81.8 percent in June. July’s level came in just above the consensus forecast for 81.8 percent capacity utilization and compares to June’s initial estimate of 81.7 percent. The capacity utilization rate for manufacturing rose to 80.7 percent in July from 80.4 percent in June.
Within manufacturing, strength was broad-based. Industries showing greatest strength in July were motor vehicles, primary metals, machinery, computers & electronics, paper, and petroleum products. By market categories, consumer goods output rose 0.3 percent in the latest month while business equipment jumped 0.9 percent. Nonindustrial supplies fell 0.3 percent in July while materials output increased 0.4 percent.
Year-on-year, overall industrial production was up 1.4 percent in July while manufacturing was up 2.0 percent.

Housing starts in July resumed its downtrend, declining 6.1 percent, following a revised 2.1 percent rise in June. In July, single-family starts fell 7.3 percent while multifamily starts declined 1.6 percent. July’s starts rate of 1.381 million is the lowest level in over 10 years – since the 1.355 million unit pace of January 1997.

On a year-on-year basis, overall starts are down 20.9 percent in July, compared to down 19.2 percent in June.
Housing permits also fell in July, declining 2.8 percent, following a 7.0 percent drop in June. Both single-family and multifamily permits dipped. On a year-on-year basis, overall permits were down 22.6 percent in July, up from down 24.8 percent in June.
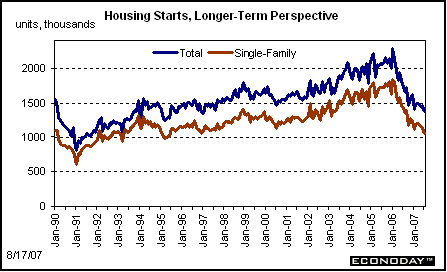
The July starts report shows the housing sector to still be under pressure from subprime problems and unsold inventories. Recovery in this sector is still quite some time away. Total starts in July were 39.7 percent below this cycle’s peak and historical high of 2.292 million units in January 2006. Single-family starts were 41.8 percent below this cycle’s peak and historical high of 1.837 million units, also set in January 2006.
The Empire State report shows continued strong growth in the region's manufacturing sector, with the business conditions index at 25.1 in August, the third straight reading between 25 and 27 (zero is the breakeven point). New orders and shipments also were robust. Delivery times slowed, reflecting mild and understandable strain on the supply chain. Inventories were drawn down for a second straight month.
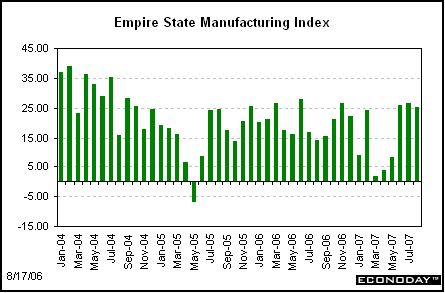
Other readings in the Empire report show price pressures stable, with prices paid at 34.4 vs. 34.6. High input costs are not pressuring output prices with prices received at a very mild 3.2 vs. July's 8.6.
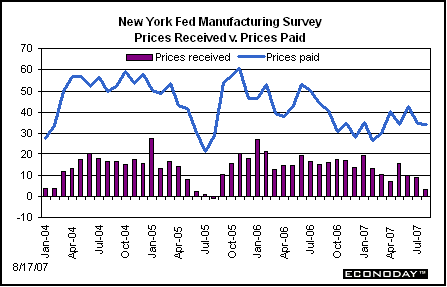
Overall, the New York Fed’s manufacturing survey points to strong manufacturing ahead. But this survey has been relatively strong compared to some of the other regional surveys and even the ISM. The latest Philly Fed survey released last week, in fact, was not as optimistic.
The Philadelphia Fed's business activity index came in with a flat reading of 0.0 in August, indicating no change from July. This month, the fact that the business activity index is not a composite of other indexes in the report led to some divergence in this overall index and more detailed indexes. Detail indexes actually showed modest strength. New orders came in at 7.1, though down from 11.3 in July, while shipments posted a similar month-to-month comparison at 12.4 vs. 20.3. The good news in the Philly report is that sluggishness in the Philly Fed district may be temporary. The six-month outlook actually rose to 36.2 from 30.4, an indication manufacturers in the region are confident that orders will continue apace.
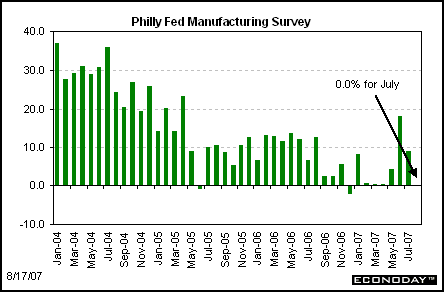
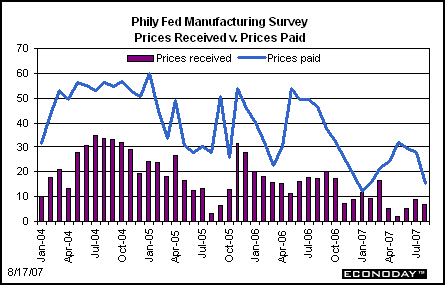
Price readings in the Philly Fed survey eased in the month, reflecting lower energy prices with prices paid at 15.4 vs. 28.1 and prices received at 6.8 vs. 8.8.
What does the Fed want to accomplish' First, the Fed does not believe it is its job to bail out the subprime lenders. The Fed does want the financial system to operate smoothly. The Fed does not want to give up its inflation fight, yet it wants to keep economic growth sustainable. The Fed will best meet those goals by supplying liquidity as needed and watching incoming economic data before making a potential change in the fed funds rate at its September 18 FOMC meeting. For now, the real sector data indicate that the Fed should stay on hold other than ensuring adequate liquidity in the banking system.
This coming week is relatively quiet. The highlights do not come until Friday with updates on manufacturing and housing with the durable goods report and new home sales.
The Conference Board's index of leading indicators fell 0.3 percent in June, following a 0.2 percent rise in May. More recently, housing permits have declined further – likely the key negative component for July. On the plus side, the S&P 500 index was still positive at that time, the 10-year T-bond/fed funds spread had narrowed, initial jobless claims had drifted downward, and vendor performance had slowed.
Leading indicators Consensus Forecast for July 07: +0.4 percent
Range: +0.2 to +0.8 percent
Initial jobless claims rose 6,000 in the week ending August 11 to 322,000, pushing the four-week average up 4,750 to a level of 312,500 that still indications tight conditions in the labor market. There were no special factors in the latest week. Initial and continuing claims have been edging higher in the last couple of weeks but levels are still quite low, indicating that conditions in the labor market remain strong.
Jobless Claims Consensus Forecast for 8/18/07: 320,000
Range: 315,000 to 330,000
Durable goods orders rebounded 1.3 percent in June, following a 2.4 percent decline in May. New durables orders have been up in four of the last five months. Manufacturing has been one the bright spots in the economy lately and it is important for momentum in this sector to continue as housing is still declining and the consumer sector may be moderating.
New orders for durable goods Consensus Forecast for July 07: +1.0 percent
Range: +0.5 percent to +5.0 percent
New home sales fell 6.6 percent in June, following a 2.2 percent decline the month before. Pending home sales rose 5.0 percent in June but it is hard to translate this given the tightening in lending standards. Home builders desperately want to see some leveling off in sales and improvement in backlogs. Housing is swollen with supply, at 7.8 months for new homes and 8.8 months for existing homes. Prices are holding up a little better. The median price for a new home did fall 1.3 percent in the month to $237,900 but is only down 2.2 percent year-on-year. But this is likely a statistical artifact of fewer low end homes being sold as a percentage of the total.
New home sales Consensus Forecast for July 07: 0.820 million-unit rate
Range: 0.770 million to 0.840 million-unit rate


|

