|
Simply Economics will be taking off next week to celebrate
Thanksgiving. Simply Economics will return on December 6, 2013.
Happy Thanksgiving from all of us at Econoday!
The Fed minutes continue to focus on continued ease. And economic news has been mixed. The big question—likely for some months—is when the recovery is strong enough for traders to not worry about the Fed eventually tapering QE. Meanwhile, quantitative easing and decent corporate news make equities attractive.
 This past week major indexes trudged upward to record closes. However, it was an up and down week. On Monday, equities were mixed. Soon after trading began, the S&P crossed the 1,800-point mark for the first time, and the Dow surpassed 16,000 points for the first time. However, both indices closed below those intraday highs on skittishness about Fed policy. Stocks eased Tuesday ahead of an after-close speech by Fed Chairman Ben Bernanke and disappointing numbers from Best Buy and Campbell Soup Co. Bernanke’s comments were very general and not market moving. This past week major indexes trudged upward to record closes. However, it was an up and down week. On Monday, equities were mixed. Soon after trading began, the S&P crossed the 1,800-point mark for the first time, and the Dow surpassed 16,000 points for the first time. However, both indices closed below those intraday highs on skittishness about Fed policy. Stocks eased Tuesday ahead of an after-close speech by Fed Chairman Ben Bernanke and disappointing numbers from Best Buy and Campbell Soup Co. Bernanke’s comments were very general and not market moving.
However, at mid-week, traders continued to evaluate Fed stance on tapering after the release of Fed FOMC minutes. Some decided that the minutes indicated the Fed could decide to scale back its stimulus program at one of its next few meetings if economic growth improved enough. Retail sales pointed to an improved recovery while existing home sales headed in the other direction.
On Thursday, traders took a dual look at the numbers and sent equities up notably. Jobless claims were down more than expected and the good news was seen as good news. Also, producer price inflation was weak—suggesting the Fed could continue QE. At week’s end, stocks rose moderately on favorable corporate news—notably for health care stocks plus Time Warner and United Continental.
 Equities were up this past week. The Dow was up 0.6 percent; the S&P 500, up 0.4 percent; the Nasdaq, up 0.1 percent; the Russell 2000, up 0.8 percent; and the Wilshire 5000, up 0.2 percent. Equities were up this past week. The Dow was up 0.6 percent; the S&P 500, up 0.4 percent; the Nasdaq, up 0.1 percent; the Russell 2000, up 0.8 percent; and the Wilshire 5000, up 0.2 percent.
For the year-to-date, major indexes are up as follows: the Dow, up 22.6 percent; the S&P 500, up 26.5 percent; the Nasdaq, up 32.2 percent; the Russell 2000, up 32.4 percent; and the Wilshire 5000, up 27.7 percent.
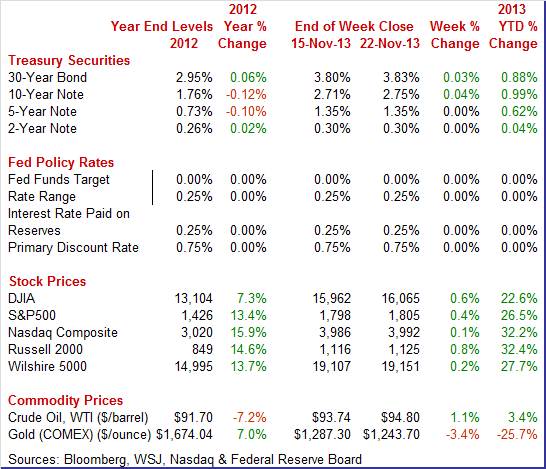
Weekly percent change column reflects percent changes for all components except interest rates. Interest rate changes are reflected in simple differences.
 Treasury yields again oscillated on daily speculation about when the Fed will begin to taper and how fast. The biggest daily move was Wednesday after the release of FOMC minutes, resulting in a moderate rise in rates on speculation (du jour) that the Fed might taper somewhat soon. But those concerns eased and yields were mixed and little changed. Treasury yields again oscillated on daily speculation about when the Fed will begin to taper and how fast. The biggest daily move was Wednesday after the release of FOMC minutes, resulting in a moderate rise in rates on speculation (du jour) that the Fed might taper somewhat soon. But those concerns eased and yields were mixed and little changed.
For this past week Treasury rates were mixed and little changed as follows: 3-month T-bill, down 1 basis point; the 2-year note, unchanged; the 5-year note, unchanged; the 7-year note, up 2 basis points; the 10-year note, up 4 basis points; and the 30-year bond, up 3 basis points.
 The spot price of West Texas Intermediate rose modestly this past week. There were only two notable daily moves. Crude slipped Monday by less than a dollar on comments by New York President William C. Dudley that the Fed might taper quantitative easing soon. But on Thursday, WTI rose almost $2 per barrel as initial jobless claims dipped more than expected. The spot price of West Texas Intermediate rose modestly this past week. There were only two notable daily moves. Crude slipped Monday by less than a dollar on comments by New York President William C. Dudley that the Fed might taper quantitative easing soon. But on Thursday, WTI rose almost $2 per barrel as initial jobless claims dipped more than expected.
Net for the week, the spot price for West Texas Intermediate firmed $1.06 per barrel to settle at $94.80.
The recovery continues to waffle upward with shifts by sector. For now, the consumer sector is doing marginally better than expected, housing is slipping, but manufacturing may be improving a little. Meanwhile, the Fed is keeping monetary policy loose.
The one thing that most FOMC participants agreed upon was that taper of quantitative easing should not be automatic. Data dependency rules. Nonetheless, some participants argued for a specific timetable for ending QE.
There was notable discussion on other issues. Monetary policy is getting complicated but the Fed is debating in advance. Debate ranges from how much taper should be in Treasuries versus mortgage-backed securities, whether to change the rate paid on excess reserves, and whether qualitative guidance is better than specific numeric guidance (unemployment and inflation).
Fed staff economists described that "economic activity continued to rise at a moderate pace," although delayed releases of statistical data reduced the view of the economy. Growth forecasts were nudged down due to the government shutdown. The staff continued to expect that inflation would be modest in the second half of this year, but higher than its level in the first half. Participants generally saw the direct economic effects of the partial shutdown of the federal government as temporary and limited, but a number of them expressed concern about the possible economic effects of repeated fiscal impasses on business and consumer confidence.
The Fed also was paying attention to the federal government impasse and had a special meeting to consider options. On October 16, 2013, the Committee met by video-conference to discuss issues associated with contingencies in the event that the Treasury was temporarily unable to meet its obligations because the statutory federal debt limit was not raised. The Fed did not have to engage in special actions as the debt ceiling was raised.
The biggest news from the minutes is that the Fed is debating almost everything related to how and when to unwind quantitative easing. The Fed is not waiting to the last minute to be ready to unwind. Separately from the minutes, the NY Fed continues to practice unwinding QE with token reverse repo operations. This means the Fed’s trading desk will be ready to unwind whenever that decision is made—whether it is in December, January, March or other.
 Consumer sentiment is in a rut. But consumers are somewhat more positive about opening their wallets than they are talking. Retail sales in October were moderately healthy with more components positive than not. Overall retail sales gained 0.4 percent after no change in September. Consumer sentiment is in a rut. But consumers are somewhat more positive about opening their wallets than they are talking. Retail sales in October were moderately healthy with more components positive than not. Overall retail sales gained 0.4 percent after no change in September.
 Autos helped, increasing 1.3 percent after a decline of 1.2 percent in September. Excluding autos, sales advanced 0.2 percent in October after rising 0.3 percent in September. But gasoline prices weighed down. Gas station sales slipped 0.6 percent in October, following a 0.2 percent increase the month before. Excluding both autos and gasoline, sales increased 0.3 percent, matching the pace in September. Autos helped, increasing 1.3 percent after a decline of 1.2 percent in September. Excluding autos, sales advanced 0.2 percent in October after rising 0.3 percent in September. But gasoline prices weighed down. Gas station sales slipped 0.6 percent in October, following a 0.2 percent increase the month before. Excluding both autos and gasoline, sales increased 0.3 percent, matching the pace in September.
In the core, strength was seen in electronics & appliance stores; sporting goods, hobby, etc.; furniture & home furnishings, clothing; and food services & drinking places. Declines were seen in building materials & garden equipment and miscellaneous store retailers.
Overall, the consumer is feeling more able to spend despite being in a bad mood in terms of sentiment. The numbers are not outstanding but they are moderately good—a favorable sign for continued recovery.
 Housing appears to be slowing with existing home sales down 3.2 percent in October to a 5.12 million annual sales rate. Weakness, for the third month in a row, was centered in the key single-family component which was down 4.1 percent following a 1.5 percent decline in September. The condo component, which is much smaller than single-family homes, popped 3.3 percent higher but still could not offset the prior month's 4.7 percent decline. Housing appears to be slowing with existing home sales down 3.2 percent in October to a 5.12 million annual sales rate. Weakness, for the third month in a row, was centered in the key single-family component which was down 4.1 percent following a 1.5 percent decline in September. The condo component, which is much smaller than single-family homes, popped 3.3 percent higher but still could not offset the prior month's 4.7 percent decline.
Regional data show across-the-board declines with the West falling the most, at 7.1 percent. The West, where supply on the market is very tight, has also been showing the most weakness in new home sales.
National supply for existing homes was down for a third straight month, at 2.13 million units for sale. The rate, however, on a sales basis did improve but only very slightly, to 5.0 months from 4.9 months in the prior 2 months.
Housing, billed as a leading sector for 2013, has been stumbling during the second half of the year, held down by low supply and also by higher mortgage rates and a slow jobs market which are keeping first-time buyers out of the market.
Manufacturing may be on the rebound. Composite activity in Markit Economics' manufacturing sample picked up steam in early November at an 8-month high of 54.3 for sizable gains versus October's final reading of 51.8 and October's mid-month flash of 51.1. Markit's PMI is now almost matching the ISM's manufacturing index which has been much stronger, over 55 going back to July.
Strength was centered so far this month in output which surged to 57.1 to show the strongest rate of monthly growth since February. This pointed to a second straight month of strength for the manufacturing component of the November industrial production report. The index for new orders also showed strength at 54.9 for a roughly 3 point gain from the October readings. On the soft side was employment which still showed monthly growth, at a plus 50 reading of 52.2, but not very much. This index has averaged only 52.0 over the past 6 months.
 This past week’s regional Fed surveys headed in opposite directions for November. The Philly Fed survey softened while the Kansas City Fed survey mostly improved, although modestly. This past week’s regional Fed surveys headed in opposite directions for November. The Philly Fed survey softened while the Kansas City Fed survey mostly improved, although modestly.
The November rate of growth in the Philadelphia Fed's manufacturing sector did not match the very strong pace of the prior two months. The index for general conditions was still above zero to indicate monthly growth, but at 6.5 the rate of growth was the slowest since May and is much slower than October's 19.8 and September's 22.3.
New orders were down nearly 16 points but to a still moderately healthy monthly growth rate of 11.8. Unfilled orders, after moving into the plus column the prior month, are back in the negative column at minus 4.2.
 Kansas City Fed District manufacturing activity continued to grow in November, and producers' expectations for future activity improved moderately. Kansas City Fed District manufacturing activity continued to grow in November, and producers' expectations for future activity improved moderately.
The month-over-month composite index was 7 in November, up slightly from 6 in October and 2 in September. The composite index is an average of the production, new orders, employment, supplier delivery time, and raw materials inventory indexes.
The production index fell slightly at nearly all types of durable goods plants, while production of nondurable goods products increased, particularly for chemicals and plastics. Most other month-over-month indexes improved over last month. The new orders index jumped from 3 to 15, and the order backlog and employment indexes reached their highest levels since early 2012. In contrast, the production index moderated from 14 to 11, and the shipments and new orders for exports indexes also slipped somewhat.
 Inflation is not to be found according to the latest CPI report-giving the Fed room to continue QE if chosen. Headline inflation dipped 0.1 percent in October after rising 0.2 percent the prior month. The CPI excluding food and energy rose 0.1 percent in both October and September. Inflation is not to be found according to the latest CPI report-giving the Fed room to continue QE if chosen. Headline inflation dipped 0.1 percent in October after rising 0.2 percent the prior month. The CPI excluding food and energy rose 0.1 percent in both October and September.
Tugging down on the overall figure, energy dropped 1.7 percent after a 0.8 percent rise in September. Gasoline fell a monthly 2.9 percent, following a 0.8 percent increase. Food edged up 0.1 percent in October after no change the month before.
 Within the core, the shelter index rose, but posted its smallest increase since December 2012. The indexes for airline fares, for recreation, and for used cars and trucks also increased. The medical care index was unchanged, while the indexes for apparel, for household furnishings and operations, and for new vehicles all declined. Within the core, the shelter index rose, but posted its smallest increase since December 2012. The indexes for airline fares, for recreation, and for used cars and trucks also increased. The medical care index was unchanged, while the indexes for apparel, for household furnishings and operations, and for new vehicles all declined.
Year-on-year, overall CPI inflation slowed to 0.9 percent from 1.2 percent in September (seasonally adjusted). The core rate posted at 1.7 percent versus 1.7 percent in September. On an unadjusted year-ago basis, the headline CPI in October was up 1.0 percent and the core was up 1.7 percent.
The bottom line is that price pressure is very weak on average. Many within the FOMC will likely point to below-target inflation (2 percent year-ago PCE prices) as a reason to continue quantitative easing.
 Producer price inflation declined at the headline level but nudged up at the core. Energy was the difference. The October PPI declined 0.2 percent after dipping 0.1 percent the month before. The core rate, which excludes both food and energy, firmed to 0.2 percent after rising 0.1 percent in September. The consensus forecast was for a 0.1 percent increase. Producer price inflation declined at the headline level but nudged up at the core. Energy was the difference. The October PPI declined 0.2 percent after dipping 0.1 percent the month before. The core rate, which excludes both food and energy, firmed to 0.2 percent after rising 0.1 percent in September. The consensus forecast was for a 0.1 percent increase.
 Food prices rebounded 0.8 percent after falling 1.0 percent in September. Energy fell 1.5 percent, following a gain of 0.5 percent in September. Gasoline prices dropped 3.8 percent in October, following a dip of 0.1 percent the month before. Food prices rebounded 0.8 percent after falling 1.0 percent in September. Energy fell 1.5 percent, following a gain of 0.5 percent in September. Gasoline prices dropped 3.8 percent in October, following a dip of 0.1 percent the month before.
For the core, leading the October advance, prices for passenger cars climbed 1.7 percent. By contrast, the index for light motor trucks edged down 0.1 percent.
For the overall PPI, the year-ago rate held steady at 0.3 percent in October (seasonally adjusted). The core rate firmed to 1.4 percent from 1.2 percent in September. On a not seasonally adjusted basis for October, the year-ago headline PPI was up 0.3 percent, while the core was up 1.4 percent.
The recovery is still wobbly although consumers are spending despite worries about the economy. While some within the Fed are concerned about future inflation, the FOMC still is likely to keep policy accommodative. Any near-term change in quantitative easing is likely to only be token.
In a holiday shortened week, the focus is on housing. The existing home sales report was very disappointing last week, putting extra pressure on this week’s pending home sales and housing starts numbers. While home sales have softened, prices have not due in part to low supply. Reports from FHFA and Case-Shiller will update on whether upward price trends continue.
The pending home sales index has been down for four months in a row. Most recently, pending home sales fell a very sharp 5.6 percent in September, following a 1.6 percent dip the month before. Year-on-year, the index is down 1.2 percent for the first negative reading in nearly 2-1/2 years. The National Association of Realtors (NAR), which compiles the report, cites as a major factor the government shutdown which it says pushed government workers and contractors to the sidelines of the housing market.
Pending home sales Consensus Forecast for October 13: +1.1 percent
Range: -2.5 to +3.0 percent
The Dallas Fed general business activity index in October fell to 3.6 after rising sharply to 12.8 in September. The company outlook index posted a fifth consecutive positive reading but moved down to 5.4 from 7.9 in September. The production index, a key measure of state manufacturing conditions, rose from 11.5 to 13.3, suggesting output increased at a slightly faster pace than in September. Other measures of current manufacturing activity also indicated a slightly stronger expansion in October. The new orders index came in at 6.2, slightly above its September level, and marked a sixth consecutive month of increased demand.
Dallas Fed general business activity index Consensus Forecast for November 13: 5.0
Range: 2.0 to 7.0
Housing starts rose in August but only because July was revised down. Housing starts in in August advanced 0.9 percent after rebounding 5.7 percent in July. The August starts annualized level of 0.891 million units was up 19.0 percent on a year-ago basis. July was revised down to 0.883 million units from the original estimate of 0.896 million. Forward momentum is slipping. Permits fell 3.8 percent after a 3.9 percent rebound in July. August’s annualized pace of 0.918 million units was up 11.0 percent on a year-ago basis.
Housing starts Consensus Forecast for September 13: 0.903 million-unit rate
Range: 0.880 million to 0.975 million-unit rate
Housing permits Consensus Forecast for September 13: 0.930 million-unit rate
Range: 0.910 million to 1.010 million-unit rate
Housing starts Consensus Forecast for October 13: 0.905 million-unit rate
Range: 0.875 million to 0.950 million-unit rate
Housing permits Consensus Forecast for October 13: 0.930 million-unit rate
Range: 0.900 million to 0.985 million-unit rate
The FHFA purchase only house price index for August rose 0.3 percent after jumping 0.8 percent in July. The August HPI is the 19th consecutive monthly price increase in the purchase-only, seasonally adjusted index. The increase was led by a 1.3 percent gain in the Mountain region. The biggest decline was in the South Atlantic, down 0.5 percent. Seven of nine Census regions showed gains in the latest month while two decreased. The year-on-year rate for August came in at 8.5 percent versus 8.6 percent in July.
FHFA purchase only house price index Consensus Forecast for September 13: +0.4 percent
Range: +0.3 to +0.7 percent
The S&P/Case-Shiller 20-city home price index (SA) picked up new steam in August, at an adjusted 0.9 percent versus 0.6 percent in July for the 20-city index. This was the first monthly acceleration since April when prices jumped 1.7 percent. The year-on-year rate showed special strength, at plus 12.8 percent for a 5 tenth gain from July and the best rate of the recovery.
The S&P/Case-Shiller 20-city HPI (SA, m/m) Consensus Forecast for September 13: +0.9 percent
Range: +0.5 to +1.1 percent
The S&P/Case-Shiller 20-city HPI (NSA, m/m) Consensus Forecast for September 13: +0.7 percent
Range: +0.4 to +0.7 percent
The S&P/Case-Shiller 20-city HPI (NSA, y/y) Consensus Forecast for September 13: +13.1 percent
Range: +11.2 to +13.5 percent
The Conference Board's consumer confidence index in October fell to 71.2 from a revised 80.2. With an 11 point drop, the dip is the largest since 12 points in January, a month that was also hit by a fiscal standoff in Washington. But in what is a likely plus in the details, the weakness in October was centered entirely in expectations which fell from 84.7 to 71.5, a low for this year that ends 5 straight months of plus 80 readings for this component. Note that the DC standoff was likely resolved too late in the initial sampling for the Conference Board report where the cutoff for the preliminary reading was likely mid-month. There could be an upward revision to October’s headline when the full month sample for October is reported in November's report.
Consumer confidence Consensus Forecast for November 13: 72.9
Range: 70.7 to 76.0
The Richmond Fed manufacturing index for October remained at flat with a reading of 1 versus 0 in the September report. New orders, at 0 versus 5 in September, pointed to flat activity for the next report as well. Shipments are at minus 2 while employment jumped to 4 from minus 6. But given the weakness in orders and shipments, the employment index is not likely to begin much of a climb going into year end.
Richmond Fed manufacturing index Consensus Forecast for November 13: 4
Range: 1 to 5
Durable goods orders jumped in September—largely on aircraft orders. But outside of transportation, durables orders were marginally negative, indicating that manufacturing is still sluggish. New factory orders for durables in September surged 3.8 percent after gaining 0.5 percent in August. The transportation component spiked 12.9 percent after an increase of 1.8 percent in August. The transportation surge came from nondefense aircraft with defense aircraft also being strong. Excluding transportation, durables orders slipped 0.2 percent, following a decline of 0.1 percent in August. Numbers reflect revisions from the more recent total factory orders report.
New orders for durable goods Consensus Forecast for October 13: -2.0 percent
Range: -9.9 percent to +0.5 percent
New orders for durable goods, ex-trans., Consensus Forecast for October 13: +0.4 percent
Range: -1.1 percent to +2.0 percent
Initial jobless claims in a November 16 week shortened by Veterans Day, fell a sharp 21,000 to 323,000 for the lowest level since the government shutdown lifted claims in the first half of October. Shortened reporting periods increase the effects of adjustments and turn the focus on the 4-week average which confirms improvement, down 6,750 to 338,500. This level is nearly even with the 337,500 in the October 19 week. Both the latest week and the October 19 week were the reporting periods for the monthly employment report.
Jobless Claims Consensus Forecast for 11/23/13: 330,000
Range: 325,000 to 340,000
The Chicago Fed National Activity Index held at a moderate rate in September, at plus 0.14 and little changed from a revised plus 0.13 in August. A positive reading for this index is consistent with above-trend economic growth. Despite the gains for September and August, the 3-month average was still in the negative column, but just barely at minus 0.03 versus a revised minus 0.15 in August. Details show 3 of 4 components in the plus column for September led by production followed by employment and then by sales/orders/inventories. The only component in the negative column was consumption & housing.
Chicago Fed National Activity Index Consensus Forecast for October 13: 0.20
Range: 0.00 to 2.00
The Chicago PMI for October surged more than 10 points for the strongest monthly gain in over 30 years. The rate of monthly growth, at 65.9, was the strongest in more than 2-1/2 years. And the strength was centered in new orders which surged more than 15 points to 74.3 for the highest rate in 9 years. Backlog orders were at a 2 1/2-year high, up more than 14 points to 61.0.
Chicago PMI Consensus Forecast for November 13: 60.5
Range: 56.0 to 65.5
The Reuter's/University of Michigan's consumer sentiment index slipped to 72.0 for the early November reading versus 73.2 for final October and versus 75.2 in the early October reading. The latest result was the 7th straight dip going through both early and final readings back to final July. The erosion continues to be centered in expectations which were at 62.3, down steadily from July's peak at 76.5. Current conditions have also been coming down but less so, to 87.2 in the preliminary November reading versus a peak of 99.7 in early July.
Consumer sentiment Consensus Forecast for final November 13: 73.3
Range: 72.0 to 76.0
The Conference Board's index of leading indicators was up 0.7 percent for a second straight month in September. Strength remained centered in financial components where the yield curve component, as it has all recovery, appears to be skewing the composite higher. A special plus was credit activity which has been showing consistent strength but this measure focuses mainly on broker accounts and commercial lending—not the consumer sector. Another plus for September was unemployment claims. Other readings include a 0.2 percent rise in the coincident index, which pointed to modest ongoing growth, and a strong 0.6 percent rise in the lagging index which points to upward revisions for prior growth.
Leading indicators Consensus Forecast for October 13: +0.1 percent
Range: -0.1 to +0.4 percent
U.S. Holiday: Thanksgiving Day. All Markets Closed
NYSE Early Close
SIFMA Recommended Early Close 2:00 ET
Consensus numbers for December 2 through 6 will be posted on Econoday’s web sites as they become available.
Markit PMI manufacturing index (final) for November 13
ISM manufacturing composite index for November 13
Construction spending for September 13
Construction spending for October 13
Motor vehicle sales for November 13
ADP private payrolls for November 13
International trade balance for October 13
New home sales for September 13
New home sales for October 13
The Beige Book being prepared for the December 17-18 FOMC meeting is released.
Real GDP report for second estimate Q3 13
Jobless Claims for 11/30/13
Factory orders for October 13
Employment Situation report for November 13
Personal income report for October 13
Consumer sentiment for final November 13
Consumer credit for October 13
R. Mark Rogers is the author of The Complete Idiot’s Guide to Economic Indicators, Penguin Books.
Econoday Senior Writer Mark Pender contributed to this article.
|
