|
This past week’s big event was a Senate confirmation hearing for Fed vice chair Janet Yellen to become Ben Bernanke’s successor as Fed chair early next year. Markets reacted favorably to likely continuation of currently easy Fed policy in the near term. Meanwhile, limited economic news was mixed.
 Equities posted moderately strong gains this past week—largely on belief that quantitative easing will continue at its current pace in coming months. Favorable earnings also came into play. Equities posted moderately strong gains this past week—largely on belief that quantitative easing will continue at its current pace in coming months. Favorable earnings also came into play.
The week got off to a slow start, however, as traders preferred to stay on the sidelines ahead of Thursday’s confirmation hearing for Fed chair. Also, there was conflicting FedSpeak Tuesday on potential taper. But at mid-week, equities jumped after retailer Macy’s announced better-than-estimated earnings, suggesting that the holiday season for retailers might be healthy.
 Stocks gained Thursday after Janet Yellen indicated that loose monetary policy is still needed. Key indexes—including the Dow and S&P500—ended the week at record closes. Stocks continued up on favorable testimony by Yellen on Thursday. Stocks gained Thursday after Janet Yellen indicated that loose monetary policy is still needed. Key indexes—including the Dow and S&P500—ended the week at record closes. Stocks continued up on favorable testimony by Yellen on Thursday.
Equities were up this past week. The Dow was up 1.3 percent; the S&P 500, up 1.6 percent; the Nasdaq, up 1.7 percent; the Russell 2000, up 1.5 percent; and the Wilshire 5000, up 1.6 percent.
For the year-to-date, major indexes are up as follows: the Dow, up 21.8 percent; the S&P 500, up 26.1 percent; the Nasdaq, up 32.0 percent; the Russell 2000, up 31.4 percent; and the Wilshire 5000, up 27.4 percent.
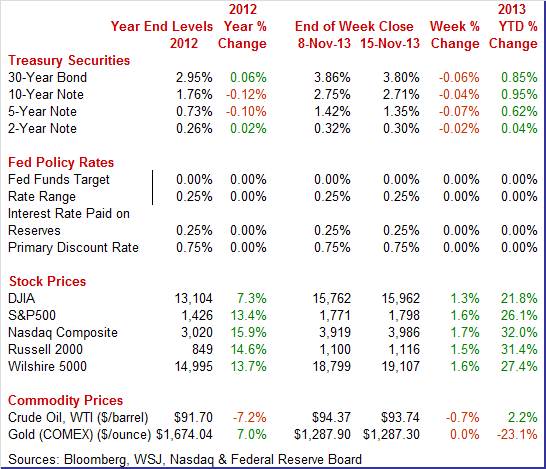
Weekly percent change column reflects percent changes for all components except interest rates. Interest rate changes are reflected in simple differences.
 After a bond trading holiday on Monday, the rest of the week centered on where monetary policy is headed under new leadership at the Fed. After a bond trading holiday on Monday, the rest of the week centered on where monetary policy is headed under new leadership at the Fed.
Treasury rates nudged up Tuesday on concern that the economy might be improving enough (notably after the prior week’s jobs report) to lead the Fed to start to curtail its bond buying programs.
The big moves, however, were Wednesday and Thursday. Wednesday, traders made bets that Yellen’s confirmation testimony would indicate that quantitative easing would continue at its current pace of $85 billion per month, bumping rates down. Traders got their wish with Thursday’s testimony, further pushing yields down.
For this past week Treasury rates were down as follows: the 2-year note, down 2 basis points; the 5-year note, down 7 basis points; the 7-year note, down 8 basis points; the 10-year note, down 4 basis points; and the 30-year bond, down 6 basis points. The 3-month T-bill firmed 2 basis points.
 The spot price of West Texas Intermediate was little changed this past week. After little movement Monday, WTI dropped by $2 a barrel on a report by the International Energy Agency that the U.S. will continue to gain dominance as an oil producer—not new news but still moved markets. The spot price of West Texas Intermediate was little changed this past week. After little movement Monday, WTI dropped by $2 a barrel on a report by the International Energy Agency that the U.S. will continue to gain dominance as an oil producer—not new news but still moved markets.
Crude changed little the rest of the week.
Net for the week, the spot price for West Texas Intermediate dipped 63 cents per barrel to settle at $93.74.
WTI has fallen $16.43 since a recent peak of $110.17 on September 6, 2013.
The big issue this past week is what monetary policy will be under new leadership next year.
Fed leadership is in transition but policy likely is not for the near term. President Barack Obama nominated vice chair Janet Yellen to become the new Fed chair when Ben Bernanke’s term as chair ends January 31, 2014. A Senate confirmation hearing was held this past Thursday and her views on monetary policy appear to be very similar to Bernanke’s.
In prepared remarks, Janet Yellen indicated that monetary policy is likely to remain loose in the near term. "We have made good progress, but we have farther to go to regain the ground lost in the crisis and the recession. Unemployment is down from a peak of 10 percent, but at 7.3 percent in October, it is still too high, reflecting a labor market and economy performing far short of their potential. At the same time, inflation has been running below the Federal Reserve's goal of 2 percent and is expected to continue to do so for some time."
During Q&A, Yellen emphasized that changes in monetary policy are data dependent. She offered somewhat countervailing arguments on pending policy changes. She noted that the Fed should do what it can to ensure a robust recovery and that there are dangers to ending asset purchases too early. The Fed chair nominee also said that QE cannot continue forever as there are inflation risks. She indicated that the Fed has the tools to unwind assets when it is the appropriate time.
Basically, Ben Bernanke technically is still the chair of the Fed (yes, we are switching from saying chairman to saying chair). But unless there are unexpected dramatic circumstances, Bernanke likely is to be low key at the December FOMC meeting. That is his style. And he likely will not attend the late January 2014 FOMC meeting just as his term as chair ends. On a technicality, Bernanke likely will submit his resignation as a Board member (his Board of Governors membership ends January 31, 2020 and is separate from that of being chair). For all practical purposes (baring emergency actions before January 31, 2014), Yellen is now seen as the Fed chair. Bernanke clearly seems to be bowing out gracefully after handling difficult issues and setting in motion an exit strategy.
 Industrial production for October was not good at the headline level but the detail was notably good. Overall industrial production slipped 0.1 percent after jumping 0.7 percent in September. Industrial production for October was not good at the headline level but the detail was notably good. Overall industrial production slipped 0.1 percent after jumping 0.7 percent in September.
Importantly, the manufacturing component advanced 0.3 percent in October, following a rise of 0.1 percent the month before. Manufacturing increased despite a decline of 1.3 percent in motor vehicles and parts in October. Excluding motor vehicles, manufacturing gained 0.4 percent after no change in September.
Weakness was outside of the key manufacturing component. Output of utilities fell 1.1 percent in October after jumping 4.5 percent in September. Mining activity decreased 1.6 percent, following a gain of 1.0 percent in September.
Capacity utilization for total industry slipped to 78.1 percent from 78.3 percent in September.
Manufacturing appears to have regained some momentum in October despite the headline number.
 General conditions turned negative in November, at least slightly negative, in the New York manufacturing region where the index fell to minus 2.21 in the November reading versus 1.52 in October. General conditions turned negative in November, at least slightly negative, in the New York manufacturing region where the index fell to minus 2.21 in the November reading versus 1.52 in October.
Though the degree of change is slight, the breadth of change is wide with negatives sweeping the November readings. New orders were at minus 5.53 with unfilled orders at a very steep minus 17.11. Lack of orders hinted at further declines in other readings including shipments, currently at minus 0.53, and employees, at zero for November.
Price pressures eased slightly with finished prices turning into the negative column at minus 3.95.
But this was only the first time since May that the Empire State index was in the minus column, which may point more to a flattening in growth not a reversal.
 The trade gap worsened more than expected in September but perhaps part of the reason is good. The September trade deficit came in at $41.8 billion versus $38.7 billion in August. Exports slipped 0.2 percent after no change in August. Imports jumped 1.2 percent in September, following an unchanged reading the month before. The trade gap worsened more than expected in September but perhaps part of the reason is good. The September trade deficit came in at $41.8 billion versus $38.7 billion in August. Exports slipped 0.2 percent after no change in August. Imports jumped 1.2 percent in September, following an unchanged reading the month before.
The widening in the trade gap was led by goods excluding petroleum which expanded to $40.5 billion from $38.5 billion in August. The petroleum deficit increased to $19.8 billion from $18.6 billion in August. The services surplus slipped to $19.5 billion from $19.6 billion.
 The latest import numbers were up on a broad based basis-indicating possibly a little more optimism about both business and consumer demand in coming months. Gains were seen in industrial supplies (oil), capital goods excluding autos, automotive, and consumer goods. The latest import numbers were up on a broad based basis-indicating possibly a little more optimism about both business and consumer demand in coming months. Gains were seen in industrial supplies (oil), capital goods excluding autos, automotive, and consumer goods.
This past week there were glimmers of improvement for the economy in October—though not dramatic. November manufacturing data, however, are in the other direction but have not been reliable recently for projecting the national trend.
There is considerable competition for this week’s highlight with retail sales report and Fed FOMC minutes. The consumer sector carries the weight of the economy and we are headed into the key holiday season. Markets continue to focus on the timing of Fed taper and the FOMC minutes will give more insight into the internal debate within the FOMC.
The NAHB housing market index for September was not quite as high as it was August but is still showing the best readings in nearly 10 years. The housing market index was at 55 for the October reading, versus 57 in September and a recovery peak of 58 in August. All three components, like the composite itself, were down 2 points in September. The weakest of the components, traffic at 44, has yet to pop over 50 this recovery which, given strength in sales, points to a concentration of high powered buyers. The 6-month sales outlook is the strongest of the components, at 62, with current sales at 58.
NAHB housing market index Consensus Forecast for October 13: 55
Range: 52 to 58
The employment cost index for the second-quarter increase was on the high side, at plus 0.5 percent for a second straight quarter with the year-on-year rate, which was still under 2 percent, but just barely at 1.9 percent for a second straight quarter. The first-quarter rate was revised upward from an initial plus 0.3 percent with the year-on-year rate also revised higher from an initial 1.8 percent.
Employment cost index Consensus Forecast for Q3 13: +0.5 percent
Range: +0.4 to +0.8 percent
The consumer price index in September rose 0.2 percent, following a 0.1 percent rise the prior month. The core CPI—excluding food and energy—held steady at a rate of 0.1 percent. By major components outside the core, energy jumped 0.8 percent, following a decline of 0.3 percent in August. Gasoline increased 0.8 percent (NSA-down 1.3 percent), following a dip of 0.1 percent the month before. Food prices were unchanged after edging up 0.1 percent in August. For the core measure, the shelter (up 0.2 percent) and medical care indexes (up 0.3 percent) accounted for most of this increase. Year-on-year, overall CPI inflation slowed to 1.2 percent from 1.5 percent in August (seasonally adjusted). The core rate came in at 1.7 percent versus 1.8 percent in August. On an unadjusted year-ago basis, the headline CPI in August was up 1.2 percent and the core was up 1.7 percent.
CPI Consensus Forecast for October 13 0.0 percent
Range: -0.2 to +0.2 percent
CPI ex food & energy Consensus Forecast for October 13: +0.2 percent
Range: +0.1 to +0.2 percent
Retail sales in September were not good at the headline level but were positive at the core level. Retail sales slipped 0.1 percent in September, following a 0.2 percent rise in August. As expected (from unit new auto sales) autos fell 2.2 percent after a 0.7 percent rebound in August. Retail sales excluding autos gained 0.4 percent after nudging up 0.1 percent in August. Gasoline sales were unchanged in September, following a 0.3 percent decline the month before. Excluding both autos and gasoline components, sales gained 0.4 percent, following a 0.1 percent rise in August. Core sales showed broad based gains.
Retail sales Consensus Forecast for October 13: 0.0 percent
Range: -0.3 to +0.4 percent
Retail sales excluding motor vehicles Consensus Forecast for October 13: +0.1 percent
Range: -0.1 to +0.3 percent
Less motor vehicles & gasoline Consensus Forecast for October 13: +0.3 percent
Range: 0.0 to +0.5 percent
Business inventories rose 0.3 percent in August versus a 0.4 percent rise in sales which kept the stock-to-sales ratio unchanged for a third straight month at 2.90. All three components contributed to the balance. The stock-to-sales ratio in retail is unchanged at 1.40 for a 3rd straight month. The ratios in wholesale, at 1.17, and in manufacturing, at 1.29, have been dead steady for 4 straight months.
Business inventories Consensus Forecast for September 13: +0.3 percent
Range: +0.2 to +0.4 percent
Existing home sales declined 1.9 percent in September following a downwardly revised no change reading for August. The annual rate, at 5.29 million, came in right on expectations. Sales fell in 3 of the report's 4 regions with only the West showing a gain, and only a small gain following a decline in August.
Existing home sales Consensus Forecast for October 13: 5.13 million-unit rate
Range: 5.00 to 5.30 million-unit rate
The Minutes of the October 29-30 FOMC meeting are scheduled for release at 2:00 p.m. ET. Once again, the focus will be on how willing the FOMC is to delay tapering of asset purchases and views on the labor market.
Initial jobless claims fell but only slightly in the November 9 week to a 339,000 level. The prior week, at 341,000, was revised 5,000 higher. The 4-week average, at 344,000, pointed to improvement but again not very much. The average was down 4,250 from mid-month October when the government shutdown hit which hints at improvement for the November employment report.
Jobless Claims Consensus Forecast for 11/16/13: 335,000
Range: 323,000 to 360,000
The producer price index for September declined 0.1 percent after rising 0.3 percent in August. The core rate, which excludes both food and energy, firmed to 0.1 percent after no change in August. Food prices fell 1.0 percent in September after jumping 0.6 percent the month before. Energy increased 0.5 percent, following a surge of 0.8 percent in August. Gasoline prices dipped 0.1 percent after spiking 2.6 percent in August. A 0.6 percent increase in prices for motor vehicles led the advance in the finished core index.
PPI Consensus Forecast for October 13: -0.2 percent
Range: -0.4 to +0.1 percent
PPI ex food & energy Consensus Forecast for October 13: +0.1 percent
Range: 0.0 to +0.2 percent
The Markit PMI manufacturing index (final) was definitely on the soft side, at only 51.8 for final October which is the slowest final monthly rate in a year. The reading was over 50, which signals month-to-month growth, but not by much and has been trending lower since July. The October flash reading was 51.1 with final September at 52.8. The new orders index, the report's leading component, was soft at 52.7 with new export orders, at 51.3, pointing to soft foreign demand. Backlog orders were slightly positive, at 51.4.
Markit PMI manufacturing flash index Consensus Forecast for November 13: 53.0
Range: 51.0 to 53.0
The general business conditions index of the Philadelphia Fed's Business Outlook Survey has been somewhat strong the last two months. The Philly Fed's general business conditions index, at 19.8 in October versus September's 22.3, has now been over 20 or near 20 for 3 of the last 4 months which is the best run since early 2011. The surge was made more convincing by an even stronger showing for the report's leading index—the new orders index—which at 27.5 for October and 21.2 for September showed its first back-to-back 20 reading since late 2004.
Philadelphia Fed survey Consensus Forecast for November 13: 15.5
Range: -3.0 to 23.5
The Labor Department’s Job Openings and Labor Turnover Survey showed that they were 3.883 million job openings on the last business day of August, up from July at a revised 3.808 million. The job openings rate improved slightly to 2.8 percent from 2.7 percent in July. The hires rate was unchanged at 3.3 percent in August while the separations rate edged up to 3.2 percent from 3.1 percent in July. These series are somewhat volatile on a monthly basis. The average monthly change over the last three months is down 8,000 for openings, down 1,000 for hires, and down 2,000 for separations.
JOLTS job openings Consensus Forecast for September 13: 3.830 million
Range: 3.800 million to 3.915 million
The Kansas City Fed manufacturing index improved moderately in October, while producers' expectations for future activity eased somewhat but remained at solid levels. The month-over-month composite index was 6 in October, up from 2 in September but down from 8 in August. The production index jumped from 4 to 14, and the shipments and new orders for exports indexes also increased.
Kansas City Fed manufacturing index Consensus Forecast for November 13: 6
Range: 3 to 7
R. Mark Rogers is the author of The Complete Idiot’s Guide to Economic Indicators, Penguin Books.
Econoday Senior Writer Mark Pender contributed to this article.
|
