|
It’s all about expectations. The latest jobs report topped expectations on the payroll headline numbers. But the bar was rather low as a weak number was expected. Equity traders were quite happy but the economy is still soft.
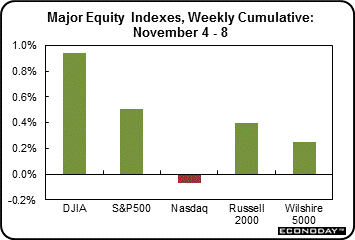
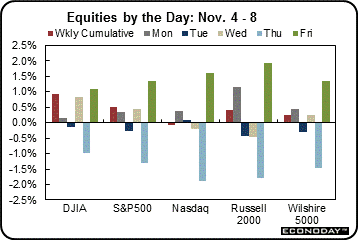 Equities mostly ended the week up—with the Nasdaq a key exception. Equities mostly ended the week up—with the Nasdaq a key exception.
Most indexes posted gains Monday in light trading ahead of the delayed employment report for October. Equities generally slipped Tuesday after a better-than-expected ISM report on the non-manufacturing sector which raised worries about early Fed taper of QE.
 Stocks were mixed at midweek as investors awaited the advance estimate of third quarter GDP on Thursday and the Friday employment report. Better-than-expected economic data from Europe and the U.S. (corporate news and leading indicators) helped support shares on Wednesday. But hopes for continuing stimulus efforts from the Fed drove much of the day's advance, sparking gains in interest rate sensitive stock sectors. Stocks were mixed at midweek as investors awaited the advance estimate of third quarter GDP on Thursday and the Friday employment report. Better-than-expected economic data from Europe and the U.S. (corporate news and leading indicators) helped support shares on Wednesday. But hopes for continuing stimulus efforts from the Fed drove much of the day's advance, sparking gains in interest rate sensitive stock sectors.
On Thursday, equities declined despite a GDP figure for the third quarter that topped expectations. Some saw the 2.8 percent figure (above the consensus of 2.0 percent) as leading to early taper by the Fed. But on Friday, good news was actually good news with a better-than-expected payroll gain in October of 204,000 versus expectations of 120,000. Equities ended the week with sharp gains after the jobs report—offsetting concerns of when the Fed will curtail its bond purchase programs.
Equities mostly were up this past week. The Dow was up 0.9 percent; the S&P 500, up 0.5 percent; the Russell 2000, up 0.4 percent; and the Wilshire 5000, up 0.3 percent. The Nasdaq slipped 0.1 percent.
For the year-to-date, major indexes are up as follows: the Dow, up 20.3 percent; the S&P 500, up 24.1 percent; the Nasdaq, up 29.8 percent; the Russell 2000, up 29.5 percent; and the Wilshire 5000, up 25.4 percent.
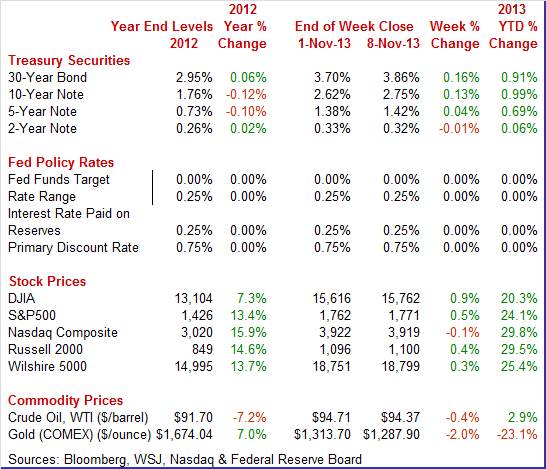
Weekly percent change column reflects percent changes for all components except interest rates. Interest rate changes are reflected in simple differences.
 Treasury yields rose moderately strongly this past week. Treasury yields rose moderately strongly this past week.
After little change Monday, rates firmed Tuesday on a favorable ISM non-manufacturing report. Yields eased Wednesday and Thursday on speculation that the Fed will maintain its current pace of bond purchases and after the European Central Bank cut its benchmark interest rate to a record low.
But it all came down to Friday’s jobs report which beat expectations significantly on payroll growth, and boosted yields significantly at week’s close.
For this past week Treasury rates were up as follows: 3-month T-bill, up 2 basis points; the 5-year note, up 4 basis points; the 7-year note, up 10 basis points; the 10-year note, up 13 basis points; and the 30-year bond, up 16 basis points. The 2-year note edged down 1 basis point.
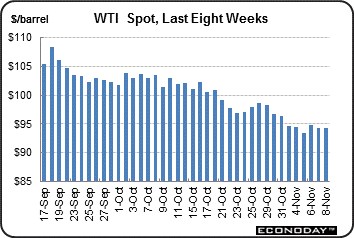 The spot price of West Texas Intermediate was essentially unchanged net for the past week. There were only two notable daily moves. The spot price of West Texas Intermediate was essentially unchanged net for the past week. There were only two notable daily moves.
Net for the week, the spot price for West Texas Intermediate slipped 34 cents per barrel to settle at $94.37.
The latest economic news was mostly stronger than expected—but much of the detail still points to a soft economy.
 Economists generally expected a slower third quarter than the second. However, GDP growth for the third quarter surprised on the high side but inventories played a big role. Real GDP grew 2.8 percent in the third quarter, following a 2.5 percent rise the quarter before. Analysts projected a 2.0 percent rise. Economists generally expected a slower third quarter than the second. However, GDP growth for the third quarter surprised on the high side but inventories played a big role. Real GDP grew 2.8 percent in the third quarter, following a 2.5 percent rise the quarter before. Analysts projected a 2.0 percent rise.
By contributions to growth, it was a mix. PCEs rose an annualized 1.5 percent, contributing 1.04 percentage points to GDP. Inventories gained $86.0 billion, following a $56.6 billion increase in the second quarter—leading to a third quarter contribution of 0.83 percentage points.
However, PCEs slowed for the quarter after a 1.8 percent increase in the second quarter. Net exports played a notable role in the boost to GDP growth but in the wrong way. Import growth decelerated to 1.9 percent, following a 6.9 percent jump in the second quarter. Essentially, demand slowed. Exports grew but at a slower pace of 4.5 percent versus 8.0 percent in the second quarter.
Housing investment remained healthy as did nonresidential structures. Equipment investment slipped while government purchases were basically flat.
But overall demand is sluggish. Final sales of domestic product rose 2.0 percent in the third quarter after a 2.1 percent increase the prior period. Final sales to domestic purchasers softened to a 1.7 percent gain, following a 2.1 percent rise in the second quarter.
Inflation was a little warmer than expected. The overall GDP price index rose 1.9 percent, following a 0.6 percent annualized gain in the second quarter. Market expectations were for a 1.4 percent annualized gain. Excluding food and energy, inflation was 1.9 percent in the third quarter, following a 0.9 percent rise the previous quarter.
Overall, the economy is not as strong as the headline suggests. We may see some pullback in the fourth quarter on inventories. Another caveat is that the BEA had to estimate more subcomponents than usual for the advance estimate due to the federal government shutdown. There could be a large revision with the next estimate for the third quarter.
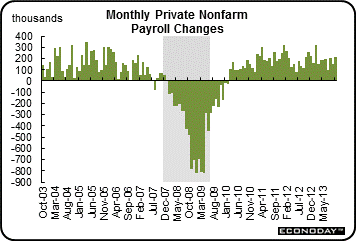 Employment growth picked up in October. The big question is whether it was enough for the Fed to seriously think about curtailing quantitative easing. Employment growth picked up in October. The big question is whether it was enough for the Fed to seriously think about curtailing quantitative easing.
The jobs report overall topped expectations, though there were some weak spots. Total payroll jobs in October increased 204,000, following a revised increase of 163,000 for September (originally up 148,000) and after a revised gain of 238,000 for August (previous estimate was 193,000). The consensus forecast was for a 120,000 rise for the latest month. The net revisions for August and September were up 60,000. Private payrolls gained 212,000 after a 150,000 increase in September. The consensus expected 128,000 in October.
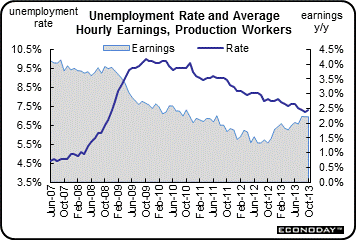
The unemployment rate firmed to 7.3 percent after dipping to 7.2 percent in September. The median forecast was for a 7.3 percent unemployment rate.
 Turning back to the payroll survey, goods-producing jobs advanced 35,000 after rising 27,000 in September. Manufacturing was up 19,000 after edging up 4,000 in September. Construction gained 11,000, following a boost of 18,000. Mining rose 4,000 after a rise of 5,000 in September. Turning back to the payroll survey, goods-producing jobs advanced 35,000 after rising 27,000 in September. Manufacturing was up 19,000 after edging up 4,000 in September. Construction gained 11,000, following a boost of 18,000. Mining rose 4,000 after a rise of 5,000 in September.
According to the BLS, “There were no discernible impacts of the partial federal government shutdown on the estimates of employment, hours, and earnings from the establishment survey.”
Private service-providing jobs increased 177,000 in October after a 123,000 rise in September. The October gain was led by professional and business services (up 21,000), leisure and hospitality (up 53,000), retail trade (up 44,000), and professional & business services (up 44,000).
Government jobs declined 8,000 in October after gaining 13,000 in September.
Wage growth was sluggish in October, rising only 0.1 percent for average hourly earnings, following 0.1 percent the month before. Expectations were for a 0.2 percent gain. The average workweek held steady at 34.4 hours, but falling short of analysts’ forecast for 34.5 hours.
Overall, the employment report showed moderately healthy job gains but there was sluggishness in wages and hours. And the unemployment rate rose. The Fed will have much to mull over ahead of its December policy meeting. This was indicated in part by Atlanta Fed President Dennis Lockhart who later on Friday said that it is not a good idea to draw too much of a conclusion from one month’s data and also that a 7.3 percent unemployment rate is not meeting the Fed’s mandate.
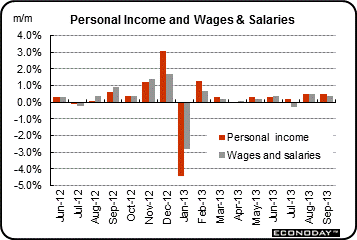 Overall consumer spending slowed a bit as expected at the end of the third quarter, to plus 0.2 percent in September following a 0.3 percent rise in August. Weakness was in durable goods which offset gains for nondurable goods and services. Overall consumer spending slowed a bit as expected at the end of the third quarter, to plus 0.2 percent in September following a 0.3 percent rise in August. Weakness was in durable goods which offset gains for nondurable goods and services.
A plus was a second solid gain for personal income, up 0.5 percent for a second straight month. Growth in wages and salaries did slow 1 tenth but still came in at respectable 0.4 percent.
On a year-ago basis, personal income for September was up 3.7 percent, compared to 3.8 percent in August.
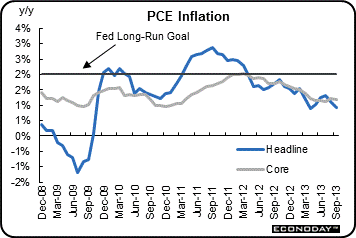 Inflation readings are soft. The overall PCE price index and the core index both posted at a monthly 0.1 percent after the same pace in August. Inflation readings are soft. The overall PCE price index and the core index both posted at a monthly 0.1 percent after the same pace in August.
The year-on-year rate for the price index was only plus 0.9 percent with core year-on-year rate at plus 1.2 percent, both well below the Fed's goal of 2 percent. This is consistent with some Fed officials stating that inflation is too low—suggesting no change in QE soon.
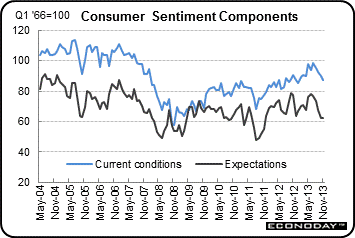
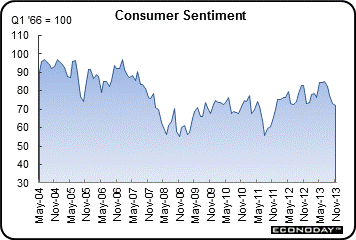 Consumer sentiment continues to turn lower, to 72.0 for the early November reading versus 73.2 for final October and versus 75.2 in the early October reading. The latest result was the 7th straight dip going through both early and final readings back to final July. Consumer sentiment continues to turn lower, to 72.0 for the early November reading versus 73.2 for final October and versus 75.2 in the early October reading. The latest result was the 7th straight dip going through both early and final readings back to final July.
The erosion continues to be centered in expectations which were at 62.3, down steadily from July's peak at 76.5. Consumer expectations hinge on the outlook for income and specifically jobs.
Current conditions have also been coming down but less so, to 87.2 in the preliminary November reading versus a peak of 99.7 in early July.
 Gas prices have been coming down but inflation expectations nevertheless are edging higher though readings remain soft for this report. Inflation expectations 1-year out rose 1 tenth from final October to 3.1 percent while expectations 5 years out also rose 1 tenth, to 2.9 percent. Gas prices have been coming down but inflation expectations nevertheless are edging higher though readings remain soft for this report. Inflation expectations 1-year out rose 1 tenth from final October to 3.1 percent while expectations 5 years out also rose 1 tenth, to 2.9 percent.
The decline in the expectations component of this report underscores some of the less positive details in the jobs report including the rise in the unemployment rate and the very slow improvement in hourly earnings.
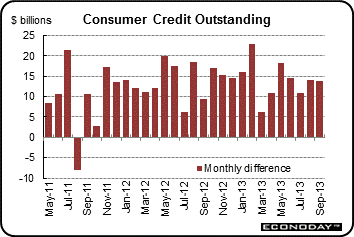 The government's acquisition of student loans is once again inflating gains for consumer credit which rose $13.7 billion in September versus a revised gain of $14.2 billion in August. The latest gain, like past gains, was entirely in the nonrevolving component which jumped $15.8 billion with details showing another big unadjusted gain in the federal government component where student loans are classified. Revolving credit, the component where credit card debt is tracked, was down $1.2 billion for a 4th straight decline. The government's acquisition of student loans is once again inflating gains for consumer credit which rose $13.7 billion in September versus a revised gain of $14.2 billion in August. The latest gain, like past gains, was entirely in the nonrevolving component which jumped $15.8 billion with details showing another big unadjusted gain in the federal government component where student loans are classified. Revolving credit, the component where credit card debt is tracked, was down $1.2 billion for a 4th straight decline.
Consumer confidence in future income has been coming down sharply the last month following the government shutdown and has yet to bounce back, concern that is likely to keep pulling down the revolving credit component of this report. Retailers are increasingly concerned that spending will be limited during the holidays which doesn't look like it will get much of a boost from consumer borrowing. Apparently, consumers are still nervous about the economy and are buying with cash—unless they are replacing an aged auto.
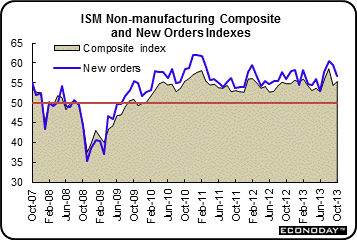 Prior strength in new orders is giving an increasing boost to current conditions for ISM's non-manufacturing sample where composite growth rose to 55.4 in October versus an already solid 54.4 in September. The business activity component shows special strength, at 59.7 versus September's 55.1. And foretelling the subsequent jobs report, the employment index rose to 56.2 from 52.7 in what is one of the better readings of the year. Prior strength in new orders is giving an increasing boost to current conditions for ISM's non-manufacturing sample where composite growth rose to 55.4 in October versus an already solid 54.4 in September. The business activity component shows special strength, at 59.7 versus September's 55.1. And foretelling the subsequent jobs report, the employment index rose to 56.2 from 52.7 in what is one of the better readings of the year.
Growth in new orders backed off somewhat but remained moderately positive with the index down from the near 60 level to 56.8. This index had been very strong in the prior 3 months, peaking just over 60 in August. Other readings were mostly steady including prices which showed easing pressure, at 56.1 for a more than 1 point decline.
The ISM non-manufacturing report is pointing to building momentum in ongoing activity in what should boost expectations for fourth-quarter GDP.
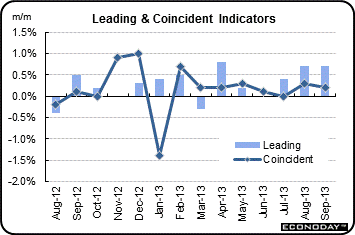 The index of leading economic indicators pointed to strong momentum for the economy going into the government shutdown, up 0.7 percent for a second straight month in September. Strength remained centered in financial components where the yield curve component, as it has all recovery, appears to be skewing the composite higher. The index of leading economic indicators pointed to strong momentum for the economy going into the government shutdown, up 0.7 percent for a second straight month in September. Strength remained centered in financial components where the yield curve component, as it has all recovery, appears to be skewing the composite higher.
A special plus was credit activity which has been showing consistent strength but this measure focuses mainly on broker accounts and commercial lending—not the consumer sector. Another plus for September was unemployment claims which however are certain to be a big minus for October due in part to temporary layoffs tied to the government shutdown. Other readings include a 0.2 percent rise in the coincident index, which points to modest ongoing growth, and a strong 0.6 percent rise in the lagging index which points to upward revisions for prior growth.
Economic news was stronger than expected at the headline level. But there were concerns at the detail level for some reports. For the individual, wages are growing very little and many are still unemployed. For the Fed, inflation is too low and unemployment is too high—keeping in mind that the Fed recognizes lags in impact from changes in monetary policy. GDP growth may slow in the fourth quarter due to a possible inventory adjustment. However, growth is still likely to moderately positive.
Manufacturing takes the spotlight with industrial production on center stage. The September number was a head fake from higher utilities but manufacturing was soft. October will be a key update for the manufacturing component. Ahead of the industrial production report, international trade hits the wires and updates on export demand. Also, Empire State for November prints just before October industrial production.
U.S. Holiday: Veteran’s Day
Markets Open, Banks Closed
The NFIB Small Business Optimism Index dipped slightly in September to 93.9 versus 94.1 in August (this series is not usually revised but was for August due to a processing error). September was held down by pessimism about future business conditions which in part reflected anticipation of the fiscal impasse in Washington. This was offset in part by a contrasting gain in future sales expectations. Small businesses see regulations & red tape as their number one problem followed by taxes and poor sales.
NFIB Small Business Optimism Index Consensus Forecast for October 13: 93.3
Range: 92.0 to 95.0
The Chicago Fed National Activity Index jumped to plus 0.14 in August from minus 0.43 in July. Production-related indicators contributed 0.22 to the index in August after a minus 0.20 reading in July. The standout plus here was the 0.7 percent surge in the manufacturing component of the industrial production report.
No consensus numbers are available for this month’s report
Import prices rose 0.2 percent in September after a gain of the same size in August. The driver of the gain was petroleum import prices, up 0.8 percent in September and up 1.9 percent the prior month. Non-petroleum was flat in September after a dip of 0.2 percent in August. Year-on-year, import prices are down 1.0 percent. On export side, prices rebounded 0.3 percent but following a sizeable 0.5 percent decline in August. The big swings were due to agricultural exports which made a partial rebound of 0.7 percent in September, following a drop of 4.2 percent the month before. Non-agricultural exports rose 0.3 percent, following no change in August. Year-on-year, export prices are down 1.6 percent.
Import prices Consensus Forecast for October 13: -0.5 percent
Range: -2.0 to +0.2 percent
Export prices Consensus Forecast for October 13: +0.2 percent
Range: -0.1 to +0.3 percent
The U.S. Treasury monthly budget report posted a sizable $75.1 billion surplus in the month of September, ending a fiscal year of big improvement in the deficit. The deficit fell 37 percent in fiscal 2013 to $680 billion. Receipts rose a very sharp 13.3 percent in the year and were led by individual taxes which, boosted by this year's payroll tax, jumped 16.3 percent. The outlay side shows a total decline of 2.3 percent with defense spending down 6.3 percent.
Looking ahead, the month of October typically shows a deficit for the month. Over the past 10 years, the average deficit for the month of October has been $97.0 billion and $138.2 billion over the past 5 years. The October 2012 deficit came in at $120.0 billion.
No consensus numbers are available for this month’s report
The U.S. international trade gap widened marginally in August but from an improved July number. The August trade gap posted at $38.8 billion compared to $38.6 billion in July. Exports slipped 0.1 percent, following a 0.6 percent decline in July. Imports were unchanged in August after a 1.3 percent gain the prior month. The slight worsening in the trade gap was primarily due a modest widening in the nonpetroleum goods deficit which grew to $38.5 billion in August from $38.3 billion in July. The petroleum deficit decreased to $18.6 billion from $18.7 billion in July. The services surplus nudged down to $19.4 billion from $19.5 billion.
International trade balance Consensus Forecast for September 13: -$39.1 billion
Range: -$41.0 billion to -$38.3 billion
Initial jobless claims fell 9,000 in the November 2 week to 336,000. This is the 4th decline in a row from a 373,000 peak in early October. The 4-week average, after 4 straight large gains, is finally turning lower, down 9,250 to 348,250. Continuing claims have been showing less effect from special factors and appear to be trending slightly lower. Continuing claims in data for the October 26 week did rise slightly, up 4,000 to 2.868 million, but the 4-week average moved lower for a 2nd straight week, down 9,000 to 2.866 million. The unemployment rate for insured workers is unchanged at 2.2 percent.
Jobless Claims Consensus Forecast for 11/9/13: 330,000
Range: 325,000 to 340,000
Nonfarm business productivity for the second quarter was revised up to a rise of 2.3 percent versus the initial estimate of a gain at an annualized 0.9 percent. Productivity fell 1.7 percent in the first quarter. Unit labor costs were revised down to no change in the second quarter, compared to an increase of 1.4 percent as originally estimated and compared to minus 3.5 percent in the first quarter. Compensation rose an annualized 2.3 percent, following a drop of 5.2 percent in the first quarter. Year-on-year, productivity was up 0.3 percent in the second quarter versus being flat the quarter before. Year-ago unit labor costs were up 1.5 percent, compared to 1.6 percent in the first quarter.
Nonfarm Business Productivity Consensus Forecast for initial Q3 13: +2.3 percent annual rate
Range: +1.0 to +1.5 percent annual rate
Unit Labor Costs Consensus Forecast for initial Q3 13: -0.3 percent annual rate
Range: -1.0 to +1.5 percent annual rate
The Empire State manufacturing index for October slipped to just over zero, at 1.52 to indicate a slight rate of growth in general conditions, down from September's 6.29. But the new orders index accelerated slightly, from 2.35 and 0.27 in the prior two months to 7.75 which is the best reading since March.
Empire State Manufacturing Survey Consensus Forecast for November 13: 5.5
Range: 3.0 to 7.5
Industrial production gained 0.6 percent in September, following a 0.4 percent rise in August. However, the manufacturing component only edged up 0.1 percent, following a 0.5 percent boost in August. One of the positives was a rise in motor vehicle assemblies. Excluding motor vehicles, manufacturing was unchanged after a 0.2 percent rebound in August. For the overall industrial production number, strength was in the volatile utilities component. The output of utilities surged 4.4 percent in September after a 0.9 percent dip the month before. Production at mines advanced 0.2 percent, following a 0.6 percent boost in August. Capacity utilization for total industry rose to 78.3 percent from 77.9 percent in August.
Industrial production Consensus Forecast for October 13: +0.1 percent
Range: -0.1 to +0.5 percent
Manufacturing production component Consensus Forecast for October 13: +0.3 percent
Range: +0.1 to +0.4 percent
Capacity utilization Consensus Forecast for October 13: 78.3 percent
Range: 77.9 to 78.6 percent
Wholesale inventories rose a sizable 0.5 percent in August for the largest build since January, but the build was matched by a 0.6 percent pop higher for sales. The readings kept the wholesale stock-to-sales ratio unchanged at 1.17 for a straight third month. Inventories in the sector were at their leanest levels since early last year.
Wholesale inventories Consensus Forecast for September 13: +0.4 percent
Range: +0.3 to +0.9 percent
R. Mark Rogers is the author of The Complete Idiot’s Guide to Economic Indicators, Penguin Books.
Econoday Senior Writer Mark Pender contributed to this article.
|
